HORIZONTV FEATURING BD+C : WATCH EPISODES ON DEMAND AT HORIZONTV

Currently Reading
Higher education construction costs for 2023.
Fresh data from Gordian breaks down the average cost per square foot for a two-story college classroom building across 10 U.S. cities.
Colleges and universities manage more than 6 billion square feet of campus space in 210,000 buildings nationwide, with a replacement value of $2 trillion and a backlog of urgent capital renewal needs exceeding $112 billion.
The state of campus facilities will define the financial future of higher ed institutions more than any other single factor. Data collected from a thorough assessment of campus conditions should be used to prioritize building portfolio needs and establish a strategic framework for linking today’s investment realities with future campus aspirations.
Readying campus facilities for future students can take the form of renovations, updates or wholesale replacement, with the driver of that decision based in the alignment of available resources with institutional programmatic priorities.
As North America’s leading construction cost database, Gordian’s RSMeans Data has been synonymous with reliability since the 1940s, so you can trust it when budgeting for projects that will transform your campus for students, alumni, professors and staff.
With localized square-foot costs on over 100 building models, Gordian’s RSMeans Data allows architects, engineers and other preconstruction professionals to quickly and accurately create conceptual estimates for future builds. This table shows the most recent costs per square foot for two-story college classrooms in select cities, with sustainable, “green” building considerations.
Visit rsmeans.com/bdandc for more information about Gordian’s RSMeans Data.
| Cost per Square Foot for Two-Story College Classrooms with Green Building Considerations | ||||
| City | 2020 | 2021 | 2022 | 2023 |
| National Average | $220.32 | $221.38 | $229.47 | $243.54 |
| Athens, GA | $178.55 | $175.75 | $182.06 | $188.76 |
| Austin, TX | $176.56 | $179.01 | $183.94 | $196.80 |
| Tuscaloosa, AL | $186.09 | $186.01 | $194.43 | $207.45 |
| Tempe, AR | $188.93 | $188.88 | $194.50 | $207.94 |
| Charlottesville, VA | $185.32 | $190.71 | $196.39 | $201.75 |
| Boulder, CO | $195.82 | $193.08 | $201.54 | $210.98 |
| Bloomington, IN | $199.80 | $199.26 | $206.05 | $216.72 |
| Ann Arbor, MI | $216.59 | $219.54 | $224.73 | $235.17 |
| Madison, WI | $216.75 | $224.27 | $227.99 | $242.15 |
| Berkeley, CA | $280.11 | $283.40 | $287.92 | $303.11 |
Please note: Square foot models are used for planning and budgeting and are not meant for detailed estimates.
Related Stories

University Buildings | Jun 28, 2024
The american university in cairo launches a 270,000-sf expansion of its campus in new cairo, egypt.
In New Cairo, Egypt, The American University in Cairo (AUC) has broken ground on a roughly 270,000-sf expansion of its campus. The project encompasses two new buildings intended to enhance the physical campus and support AUC’s mission to provide top-tier education and research.

University Buildings | Jun 18, 2024
Uc riverside’s new school of medicine building supports team-based learning, showcases passive design strategies.
The University of California, Riverside, School of Medicine has opened the 94,576-sf, five-floor Education Building II (EDII). Created by the design-build team of CO Architects and Hensel Phelps, the medical school’s new home supports team-based student learning, offers social spaces, and provides departmental offices for faculty and staff.

Headquarters | Jun 5, 2024
Several new projects are upgrading historic princeton, n.j..
Multifamily, cultural, and office additions are among the new construction.

Mass Timber | May 31, 2024
Mass timber a big part of western washington university’s net-zero ambitions.
Western Washington University, in Bellingham, Wash., 90 miles from Seattle, is in the process of expanding its ABET-accredited programs for electrical engineering, computer engineering and science, and energy science. As part of that process, the university is building Kaiser Borsari Hall, the 54,000-sf new home for those academic disciplines that will include teaching labs, research labs, classrooms, collaborative spaces, and administrative offices.

University Buildings | May 30, 2024
Washington university school of medicine opens one of the world’s largest neuroscience research buildings.
In St. Louis’ Cortex Innovation District, Washington University School of Medicine recently opened its new Jeffrey T. Fort Neuroscience Research Building. Designed by CannonDesign and Perkins&Will, the 11-story, 609,000-sf facility is one of the largest neuroscience buildings in the world.

University Buildings | May 10, 2024
Unc chapel hill’s new medical education building offers seminar rooms and midsize classrooms—and notably, no lecture halls.
The University of North Carolina at Chapel Hill has unveiled a new medical education building, Roper Hall. Designed by The S/L/A/M Collaborative (SLAM) and Flad Architects, the UNC School of Medicine’s new building intends to train new generations of physicians through dynamic and active modes of learning.

Mass Timber | Apr 25, 2024
Bjarke ingels group designs a mass timber cube structure for the university of kansas.
Bjarke Ingels Group (BIG) and executive architect BNIM have unveiled their design for a new mass timber cube structure called the Makers’ KUbe for the University of Kansas School of Architecture & Design. A six-story, 50,000-sf building for learning and collaboration, the light-filled KUbe will house studio and teaching space, 3D-printing and robotic labs, and a ground-level cafe, all organized around a central core.

Student Housing | Apr 17, 2024
Student housing partnership gives residents free mental health support.
Text-based mental health support app Counslr has partnered with Aptitude Development to provide free mental health support to residents of student housing locations.

Student Housing | Apr 12, 2024
Construction begins on auburn university’s new first-year residence hall.
The new first-year residence hall along Auburn University's Haley Concourse.

University Buildings | Apr 10, 2024
Columbia university to begin construction on new york city’s first all-electric academic research building.
Columbia University will soon begin construction on New York City’s first all-electric academic research building. Designed by Kohn Pedersen Fox (KPF), the 80,700-sf building for the university’s Vagelos College of Physicians and Surgeons will provide eight floors of biomedical research and lab facilities as well as symposium and community engagement spaces.
Top Articles
- University Buildings
Senior Living Design
The country’s largest retirement community expands with educational facilities, mfpro+ new projects, chicago’s long-vacant spire site will be home to a two-tower residential development, more in category, headquarters, mass timber, most popular content.
- BD+C University (CEUs)
- MultifamilyPro+
- Giants 400 Rankings
- Life of an Architect
Building Sector Reports
- Airport Terminals
- Data Centers
- Government Buildings
- Healthcare Facilities
- Hotel Facilities
- Industrial Facilities
- Justice Facilities
- K-12 Schools
Building Sector Continue
- Laboratories
- Military Construction
- Modular Building
- Multifamily Housing
- Office Building Design
- Performing Arts Centers
- Religious Facilities
- Retail Centers
- Senior Living Facilities
- Sports and Recreational Facilities
- Transportation & Parking Facilities
- Burns & McDonnell
- CallisonRTKL
- CannonDesign
- Clark Nexsen
- CO Architects
- Design Collaborative
- FXCollaborative
- Gresham Smith
Blogs Continue
- HMC Architects
- IA Interior Architects
- Kimley-Horn
- Legat Architects
- NAC Architecture
- Nadel Architecture & Planning
- Perkins and Will
- Perkins Eastman
- Rider Levett Bucknall
- Shepley Bulfinch
- Southland Industries
- SRG Partnership
- Ted Goldstein, Atlas Tube
- Vessel Architecture & Design
- Walter P. Moore
Building Team Reports
- Contractors
- Building Owners
- BD+C University
- Building Enclosures Series
- Case Studies
- Codes and Standards
- COVID-19 Reports
- Native Series
- Press Releases
- White Papers
BD+C Awards Programs
- 75 Top Products
- 40 Under 40
- Women in Design+Construction
- See all events

Magazine Subscription
Get our newsletters.
Each day, our editors assemble the latest breaking industry news, hottest trends, and most relevant research, delivered to your inbox.
Follow BD+C:
- Construction ›
- Building Construction
Industry-specific and extensively researched technical data (partially from exclusive partnerships). A paid subscription is required for full access.
- Construction costs for educational buildings in the U.S. 2024, by city
Average construction costs of educational buildings in the United States in 1st quarter of 2024, by city (in U.S. dollars per square foot)
| Characteristic | Elementary | High school | University |
|---|---|---|---|
| - | - | - | - |
| - | - | - | - |
| - | - | - | - |
| - | - | - | - |
| - | - | - | - |
| - | - | - | - |
| - | - | - | - |
| - | - | - | - |
| - | - | - | - |
| - | - | - | - |
| - | - | - | - |
| - | - | - | - |
To access all Premium Statistics, you need a paid Statista Account
- Immediate access to all statistics
- Incl. source references
- Download as PDF, XLS, PNG and PPT
Additional Information
Show sources information Show publisher information Use Ask Statista Research Service
United States
1st quarter of 2024
The figures provided are averages, calculated from the low and high costs found in the respective market.
Hard construction costs per square foot of gross floor area.
Other statistics on the topic Public construction
Politics & Government
- U.S. government - budget by agency for 2025
Construction
- The 50 biggest construction companies in the U.S. based on revenue 2022
- Largest electrical contractors in the U.S. based on revenue 2014-2022
- U.S. construction spending in public and private sectors 1993-2022

To download this statistic in XLS format you need a Statista Account
To download this statistic in PNG format you need a Statista Account
To download this statistic in PDF format you need a Statista Account
To download this statistic in PPT format you need a Statista Account
As a Premium user you get access to the detailed source references and background information about this statistic.
As a Premium user you get access to background information and details about the release of this statistic.
As soon as this statistic is updated, you will immediately be notified via e-mail.
… to incorporate the statistic into your presentation at any time.
You need at least a Starter Account to use this feature.
- Immediate access to statistics, forecasts & reports
- Usage and publication rights
- Download in various formats
* For commercial use only
Basic Account
- Free Statistics
Starter Account
- Premium Statistics
The statistic on this page is a Premium Statistic and is included in this account.
Professional Account
- Free + Premium Statistics
- Market Insights
1 All prices do not include sales tax. The account requires an annual contract and will renew after one year to the regular list price.
Statistics on " Public construction in the United States "
- U.S. real value added to GDP 1990-2022, by sector
- Value of new federal construction in the U.S. 1999-2023
- Value of new state and local construction in the U.S. 2009-2022
- Value of public residential construction spending in the U.S. 2002-2022
- Public non-residential construction spending in the U.S. 2002-2022
- Public highway and street construction spending in the U.S. 2008-2022
- U.S. sewage and waste disposal projects construction spending 2009-2022
- U.S. public construction spending on water supply projects 2009-2019
- U.S. public construction spending on power projects 2009-2019
- Local and state government construction value: education 2005-2019
- Revenue share of the largest construction design firms in the U.S. 2022, by sector
- Largest construction contractors in the U.S. 2022, based on new contracts
- Leading construction companies in the U.S. 2022, based on revenue
- Leading construction design firms in the U.S. 2020-2021, by revenue
- Largest specialty contractors in the U.S. 2018-2021
Other statistics that may interest you Public construction in the United States
Construction value
- Premium Statistic U.S. real value added to GDP 1990-2022, by sector
- Premium Statistic U.S. construction spending in public and private sectors 1993-2022
- Premium Statistic U.S. government - budget by agency for 2025
- Premium Statistic Value of new federal construction in the U.S. 1999-2023
- Basic Statistic Value of new state and local construction in the U.S. 2009-2022
Public construction
- Premium Statistic Value of public residential construction spending in the U.S. 2002-2022
- Premium Statistic Public non-residential construction spending in the U.S. 2002-2022
- Premium Statistic Public highway and street construction spending in the U.S. 2008-2022
- Premium Statistic U.S. sewage and waste disposal projects construction spending 2009-2022
- Premium Statistic U.S. public construction spending on water supply projects 2009-2019
- Premium Statistic U.S. public construction spending on power projects 2009-2019
- Premium Statistic Construction costs for educational buildings in the U.S. 2024, by city
- Basic Statistic Local and state government construction value: education 2005-2019
Leading contractors
- Premium Statistic Revenue share of the largest construction design firms in the U.S. 2022, by sector
- Premium Statistic The 50 biggest construction companies in the U.S. based on revenue 2022
- Premium Statistic Largest construction contractors in the U.S. 2022, based on new contracts
- Premium Statistic Leading construction companies in the U.S. 2022, based on revenue
- Premium Statistic Leading construction design firms in the U.S. 2020-2021, by revenue
- Premium Statistic Largest specialty contractors in the U.S. 2018-2021
- Premium Statistic Largest electrical contractors in the U.S. based on revenue 2014-2022
Further related statistics
- Basic Statistic Share of Americans who would further their education if it was free in 2011
- Premium Statistic Construction costs of industrial buildings in selected European cities 2023, by type
- Premium Statistic General hospital construction costs in the U.S. Q1 2024, by city
- Premium Statistic Industrial warehouse construction costs in the U.S. in Q1 2024, by city
- Premium Statistic Average costs per square meter for building retail spaces in UK 2023
- Premium Statistic Average parking construction costs in the U.S. Q3 2023, by city
- Premium Statistic Construction value of U.S. education planning projects 2017
- Premium Statistic Global educational building costs by select city 2021
- Premium Statistic Annual revenue of Linköping University 2013-2019
- Premium Statistic Value of building consents for education facilities New Zealand 2017-2023
- Premium Statistic Number of students at Linköping University 2015-2021
- Premium Statistic U.S. single family home construction cost breakdown 2019
- Premium Statistic U.S. school construction completed by type 2015
- Premium Statistic Cuba: number of higher education institutions 2014-2022
- Premium Statistic Students in Technical and Vocational Education Training (TVET) in Kenya 2013-2022
Further Content: You might find this interesting as well
- Share of Americans who would further their education if it was free in 2011
- Construction costs of industrial buildings in selected European cities 2023, by type
- General hospital construction costs in the U.S. Q1 2024, by city
- Industrial warehouse construction costs in the U.S. in Q1 2024, by city
- Average costs per square meter for building retail spaces in UK 2023
- Average parking construction costs in the U.S. Q3 2023, by city
- Construction value of U.S. education planning projects 2017
- Global educational building costs by select city 2021
- Annual revenue of Linköping University 2013-2019
- Value of building consents for education facilities New Zealand 2017-2023
- Number of students at Linköping University 2015-2021
- U.S. single family home construction cost breakdown 2019
- U.S. school construction completed by type 2015
- Cuba: number of higher education institutions 2014-2022
- Students in Technical and Vocational Education Training (TVET) in Kenya 2013-2022
- How We're Funded
- Staff Directory
- Board of Directors
Cost Analysis for Education Projects: Resources and Reflections
Recommended.

You’ve got an education program, and you’re confident that it’s having an impact. But is it worth the cost? How can you know, and how can you compare it to other education programs? Cost-effectiveness analysis tells you how much you pay for a given increase in student learning or student school participation, but most evaluations don’t include it (for various reasons ).
If you want to do cost analysis, here are a few resources (depending on what you want) and a few of my own reflections. (There are many more resources out there; if you have favorites, share them in the comments!)
If you want a quick introduction (10 pages or less):
- The Abdul Latif Jameel Poverty Action Lab (J-PAL) has a helpful brief , including suggestions on what to do if you can’t completely break down the costs into different components.
- A brief from the IRC and the World Bank provides a simple 5-step process for gathering cost data.
- USAID has a 2-pager to motivate how you can use cost data and the kinds of questions you can use it to answer, and how to get started with cost analysis.
If you want templates to help you capture the costs:
- J-PAL has a detailed Excel template that will spit out an estimate of cost-effectiveness for you in the final tab.
- Hey, that seems too complicated! Is there a simpler template? More detailed cost data will get you better estimates, but J-PAL also provides a much simpler template to get you a general sense of the cost of the program.
- USAID has templates as well ; they’re a little less automated.
If you want more detail on how to get cost analysis right:
- As a basic introduction, you can’t beat Patrick McEwan’s 20-page primer on “ Cost-effectiveness analysis of education and health interventions in developing countries .”
- USAID has a cost analysis guide (100+ pages) for education projects that explains all the methods and then a guide to doing this in practice.
- Dhaliwal and others walk readers through many of the decisions you have to make in cost analysis and their implications.
Reflections
First, remember that just like estimates of the impact of a program, cost-effectiveness estimates also come with errors. Popova and I showed that taking those errors into account can dramatically re-order lists of which programs are most cost effective. As a result, I wouldn’t put much stock in small differences in cost-effectiveness.
Second, if you’re using cost-effectiveness analysis from one place to decide whether to implement a program from one place in another place, remember that costs can vary dramatically from place to place. Working with data from a large NGO, Tulloch showed that “costs for the same intervention can vary as much as twenty times when scale or context is changed”! Imagine you’re implementing a program that involves driving to visit schools. Popova and I showed that the transportation cost per school was 27 times higher in rural Kenya than in urban India. So if you want to transport cost-effectiveness from one place to another, make sure you update the costs based on local prices. (And don’t forget that the size of the program’s impact—the “effectiveness” in cost-effectiveness—can change a lot from context to context as well!)
Third, remember that cost-effectiveness won’t be (and shouldn’t be) the only factor in deciding which programs to focus investments on. A program with small impacts that is very cheap may be highly cost effective. It’s great to do that program, but maybe not if it distracts teams with limited operational capacity from programs that will deliver big impacts.
Even with these caveats, just as I’d never make a major purchase without looking at the price tag, I’d never recommend that an education system implement a new policy or program without trying to estimate the cost and thinking through the benefits that come with those costs.
-----------------------------------------
A few other miscellaneous resources for the curious
- The Systematic Cost Analysis Consortium distributes a tool called Dioptra, which actually plugs into programs’ accounting data to facilitate cost analysis and make it maximally comparable across programs. Learn more here !
- With others, I’ve done some analysis on How to Improve Education Outcomes Most Efficiently? using cost-effectiveness.
If you want someone else’s take on the best resources for cost-effectiveness analysis (not limited to education), Glandon and others provide their “ten best resources” for cost-effectiveness analysis in impact evaluations .
CGD blog posts reflect the views of the authors, drawing on prior research and experience in their areas of expertise. CGD is a nonpartisan, independent organization and does not take institutional positions.
View the discussion thread.
More Reading

POLICY PAPERS
Ideas to action: independent research for global prosperity
© 2024 Center for Global Development | Privacy Notice and Cookie Policy
Sign up to get weekly development updates:
- Resources by Topic
- View Resources by State
- Trending Topics
- Data Systems
- Early Care and Education
- Postsecondary Affordability
- School Choice
- School Readiness
- Student Health and Wellness
- Student Learning
- Teaching Profession
- Workforce Development
- State Education Policy Tracking
- State Education Policy Watchlist
- Governors' State of the State Addresses: Education-Related Proposals
- The Commission
- Chair’s Initiative
- Newsletters
- Request Information
Education Commission of the States is the trusted source for comprehensive knowledge and unbiased resources on education policy issues ranging from early learning through postsecondary education.
Subscribe to our publications and stay informed.
Request Assistance
Need more information? Contact one of our policy experts.
50-State Comparison: K-12 School Construction Funding
Elementary and secondary school construction — referred to here as capital school construction — is the nation's second-largest capital investment for state and local governments. It is surpassed only by road construction. This funding's main objective is to ensure students have access to modern, updated facilities that facilitate learning and development. While local governments are responsible for most school construction costs, state governments have played a significant role in financing the construction of school buildings.
State governments provide financial support for school capital construction through direct appropriations and financing support. Securing adequate funding for school infrastructure is crucial for schools to maintain and enhance their facilities. However, during periods of budgetary constraints, school construction funding may face challenges and not be prioritized. So, funding may be reduced or delayed, adversely affecting schools' capacity to provide safe and modern learning environments for students.
In this review, capital school construction is defined as major facility projects that involve the construction of new structures or major renovations. This may involve planning, design, site acquisition or the retrofit and replacement of buildings. These expenses are typically funded through the capital budget and often financed with bonds. Not discussed here is funding for maintenance and operations projects that involve regular, routine facility work, such as cleaning, grounds keeping, minor repairs, utilities and building security.
Financial Assistance
- 90% of states ( 45 states and the District of Columbia ) offer financial assistance to school districts for school construction costs.
- 28 states provide both appropriations and financing options, while 10 states solely offer appropriations, and 7 states along with the District of Columbia provide financing options.
- At least 19 states have established dedicated revenue sources for school construction funding. This includes sales and use taxes, excise taxes, lottery revenue, and proceeds from the sale and use of state lands.
- Appropriations
- 38 states provide aid to school districts for upfront planning or construction costs through appropriations. Five states have programs established in law that are not currently active.
- 28 states incorporate an equity component within their appropriation policy. This means they prioritize or provide more funding for projects for school districts with lower levels of property wealth.
- Payments take the form of direct grant aid to defray the costs incurred by projects or to reimburse locally issued debt, without requiring school districts to repay the state.
- 35 states and the District of Columbia employ various financing mechanisms, such as bond issuance, to fund school construction costs. One state has a program established in law that is not currently active.
- This support includes state issued bonds, support for locally issued bonds and state funded loan programs, allowing schools to obtain loans for their construction needs.
- Oversight and Prioritization
- School districts seeking state appropriations or financing support typically require approval from the state or designated authority. The resource highlights the entity overseeing school construction funding requests in each state.
- In many cases, voter approval is necessary at the state and/or local level to issue debt for financing school construction projects. Our research shows that 35 states require some level of voter approval for such debt issuance.
Explore the 50-state comparisons below to see how states provide funding through appropriations and financing support, while exercising authority through oversight and prioritization. View a specific state’s approach by going to the state profiles page.
50-State Comparisons
- Financial Assistance and Revenue
Click here to see all data points for all states
Related Resources
- 50-State Comparison: K-12 and Special Education Funding
- Student Counts in K-12 Funding Models
- Innovative State Strategies for Using ESSER Funds
Education Level:
Adrienne Fischer , Chris Duncombe , Eric Syverson
Resource Type:
50-State Comparison
Copyright 2024 / Education Commission of the States. All rights reserved.

Cost Estimating for K-12 School Projects: An Invaluable Tool for Budget Management
As school districts nationwide plan for long-term maintenance and construction costs, they share a number of common concerns. Districts ask, “How much is a typical monthly maintenance bill, and what does it include? How much does it cost to bring a school up to ‘21 st century learning’ standards? How much would it cost to build new? What’s the monthly maintenance cost difference between a renovated building and a new facility? What is the up-front cost difference between renovation and new construction?” Understandably, clients want to be able to track costs at every stage of a project, and cost estimates (current and life cycle) are valuable planning and design tools.
Big Picture Budget
To assist our education clients in informed decision making, we use a detailed preliminary cost estimate which reflects the total project cost. The total project cost includes both “hard” and “soft” costs. “Hard” costs are any costs related to construction – the materials, labor, and work to complete the building. “Soft” costs are project costs in addition to the construction of the building which can include land; furniture, fixtures, and equipment ( FF & E) costs; surveys; testing; design fees; escalation; owner contingencies; and other elements. Budgets for public work are typically all inclusive, so the total project cost has to stay within the set budget. Tracking total project costs throughout each design phase provides a much clearer picture than construction costs alone.
A line-item spreadsheet for hard and soft costs is an important decision-making tool throughout the design process, helping clients to prioritize spending. For example, buying new land for $1 million means $1 million less spent on building square footage or technology, while reusing technology, equipment, and furniture from another facility may allow a school system to build more classrooms. The project timeline is a critical factor in cost estimating; typically, the longer the schedule, the more construction costs are likely to escalate over time. As of early 2023, contractors are generally estimating for 1-1.5% escalation per month for labor and materials, though unforeseen disasters such as hurricanes can significantly impact the cost of labor and materials and make costs challenging to predict over the long term.
Programming and Analysis
Whether the project is a renovation or new construction, cost control begins at the earliest project stages. Simultaneous programming and cost estimating helps districts visualize in real time how each program space impacts the budget, helping to keep design goals and budget aligned. The design team works closely with stakeholders to create a programming document based on the district’s goals, needs, vision, and typical space requirements for each program requirement. This document is the basis for a preliminary construction cost estimate with line-item hard and soft project costs.
At this stage, the team will also analyze life cycle costs for major systems such as HVAC and lighting. This Life Cycle Assessment (LCA) helps clients understand both first costs and long-term costs, and is a powerful tool for making decisions about mechanical and electrical systems. Often, up-front investments in high-performance systems can offset long-term maintenance and operational costs, saving money over the life of the system.
Refining the Process
By the end of the design development phase, the district will have a clearer picture of building size, construction type, finish materials, quantities, mechanical systems, and site utilities which will be factored into a refined cost estimate. With this additional level of detail, a cost estimator or GC estimating group can provide a more accurate estimate of construction costs based on market and regional trends. This estimate may inform adjustments to the design to help align the program and budget.
Innovative design and construction strategies may help to complete the project on time, in budget, and at the highest level of quality. For example, an early grading or site package is often used to accelerate construction (and thus potentially reduce costs) while the rest of the building package is still in design development. Furthermore, after the project is complete, documentation of operational costs and building performance over time can provide essential metrics for estimating future projects (both for the district and for the designers).
Transparency Is Key
Ideally, every project would start with a clear and realistic cost estimate that can be monitored and updated from start to finish. Communication and transparency are always critical to a successful project, most especially in ongoing project cost discussions. Districts and designers can set the team up for success by creating a plan for programming and cost estimating at the outset with the goal of aligning expectations, managing uncertainty, and avoiding “scope creep.”
Cost estimates must be as realistic as possible to be useful planning tools. If cost estimates are accurate and are updated at each stage of the design, they can be invaluable in helping stakeholders visualize the “domino effect” impacts and trade-offs of each program space and support wise decisions throughout the process.
About Ginny
Ginny Magrath, AIA, is a member of LS3P’s K-12 studio. Ginny earned a Bachelor of Arts in Architecture from Clemson University and a Master of Architecture from UNC Charlotte, and first joined LS3P as a student intern in 2012. Since joining the firm full-time in 2015, Ginny has developed significant experience in the education sector including public, private, and higher education projects. She was recognized as a firm Associate in 2017.

Use the search box to find the product you are looking for.
Don't miss tomorrow's construction industry news
Let Construction Dive's free newsletter keep you informed, straight from your inbox.
- Daily Dive M-F
- Tech Weekly Every Wednesday
- Infrastructure Weekly Every Tuesday
- Labor & Safety Weekly Every Thursday
Making the grade: Why school construction costs are climbing and projects are stalling
A roll call of some important education contractors finds that labor and material prices and complex design, health and technology needs are putting pressure on the delivery of school builds.
When California-based C.W. Driver Cos. began work on the new 94,000-square-foot K-8 Cadence Park School campus in Irvine in 2016, the overall construction costs came in at $475 per square foot.
But in 2019, as the firm started mapping out the construction of Heritage Fields School No. 3, another K-8 campus for the Irvine Unified School District, costs had surged to $598 a square foot.
That’s a jump of 26% in just three years, and it echoes a trend experienced around the country.
Basic algebra: Costs are adding up
“Over the last few years, the cost increase per square foot has been abnormally high,” said Jonathan Keene, senior project manager at C.W. Driver, which specializes in K-12 and higher education construction. “We’ve seen abnormally high increases in labor costs as well as huge increases in material costs like structural steel.”
School construction costs aren't just rising in high-priced locales like California. From Maryland to Washington State, school and university construction projects are seeing cost increases that are forcing school boards and university trustees to reconsider their original plans or go back to the drawing board altogether.
In an extreme example at St. Paul (Minnesota) Public Schools, cost estimates on 18 projects grew by more than 60% between 2016 and 2019, according to the Twin Cities Pioneer Press newspaper .
“In some of the bigger districts, where they thought they could do 30 schools, they’re now saying we can only do 18,” said Mary Filardo, executive director of the Washington, D.C.-based 21 st Century School Fund, a nonprofit that supports and advocates for improved school infrastructure nationally. “They’re definitely feeling it.”
On a national basis, school construction costs now range from a low of $230 per square foot for a high school in Nashville, to a high of $558 in New York, according to construction cost consultant Cumming . Dan Pomfrett, Cumming’s chief forecaster, said costs in the sector are up around 15% over the last three years. While that’s in line with other sectors of commercial construction, schools’ unique designs can lead to higher overall price tags.
“Add in a gym, science building or magnet school, and it goes up from there,” Pomfrett told Construction Dive. “There’s a lot of sticker shock.”
Higher construction costs are being amplified at the university level, too, especially as institutions compete for a shrinking number of enrolled students .
“We're really seeing an arms race in higher education right now,” said Ripley Bickerstaff , director of business development at Birmingham, Ala.-based Hoar Construction, which specializes in university projects. He points to two-story recreation centers with hanging, inclined running tracks and 360-degree motion-capture systems in health sciences departments.
“Whatever it's going to take to recruit students and get their enrollment numbers up, that’s what they want," he said.
A course load of causes
Like other sectors in commercial construction, labor and material costs are playing an increasingly larger role in development costs. School boards’ appetite for technology has also contributed, as has the length of the current economic expansion. Schools’ longer lifespans, robust structural specifications and more specialized indoor air quality requirements all come into play as well.
For example, at Fairfax County Public Schools, the largest school district in Virginia, assistant superintendent Jeff Platenberg said that HVAC and mechanical systems at schools are more expensive because of changing perspectives of children’s unique physical needs.
“Air inflow and the conditioning of air have more stringent requirements, because you're dealing with children, and children breathe at a more rapid rate than adults,” said Platenberg. He also noted that stormwater management requirements, due to schools’ large tracts of playing fields, recreation courts and expansive roofs, also drive up costs.
Given the length of the current economic expansion, schools are now building during the upside of the cycle, whereas traditionally, educational institutions tended to build when the market was down and costs were more favorable, said Tony Schmitz, an architect at Kansas City-based Hoefer Wysocki Architecture, whose portfolio includes more than 1.9 million square feet of education facilities. “But we've been in an up economy for so long now, they are building in an up cycle, which leads to an uptick in construction costs," he said.
In addition, there’s the ballooning amount of technology and automation that’s going into today’s schools to make sure they will provide students with the tools they need well into the future.
“With the increased focus on technology, science and the overall student experience, the projects we build today look much different than the ones we did a decade ago,” said Tony Church, executive vice president of operations, at St. Louis-based McCarthy Building Cos. “Some of our K-12 projects are more complex and costly than the higher-ed projects we’ve completed recently.”
Security is also driving up costs, with electronic access control becoming more common. Defensive design elements, such as wing walls for students to hide behind in case of a lockdown, also contribute, Filardo said.
Stay in school: Where's the labor?
Against that backdrop, schools are dealing with the same labor issues as other sectors of commercial construction.
“You literally have a workforce that will walk off the job in the middle of the day to go down the street where somebody’s paying 25 cents more an hour,” said Schmitz. “The labor force bounces around daily.”
It’s also increasingly hard to get subs to bid on jobs, Bickerstaff said.
“We used to have six mechanical guys looking at a job, and now you'll be lucky to get two or three,” he told Construction Dive. “They're booked. And for that reason, you've basically got two guys competing over this job, so you’re going to see a 10% increase right there, just because there's nobody else to do it.”
That’s a factor that impacting all facets of construction. Construction managers are being realistic about what it costs to fill these positions, and as a result, customers are seeing higher bid prices, said Michael Regan, project management practice leader at Middletown, N.J.-based engineering firm T&M Associates.
“At any given time, there are three times as many jobs on the street as there were ten years ago,” he said. “We are in a bidder’s market."
Economics 101
To deal with the rising costs, contractors and their subs are turning to various strategies, including writing cost escalation clauses into contracts.
“Contractors need to do a lot more today to protect themselves from rising costs, including building in cost escalators or fuel surcharges to their contracts,” according to Ian Shapiro, a CPA and co-leader of the real estate and construction practice in the Miami office of tax and accounting consultancy BDO.
When costs do escalate beyond expectations, value engineering becomes a contractor’s best friend. At the Performing Arts Complex of Woodbridge High School in Irvine, California , C.W. Driver shaved $2 million off the numbers by only using shot-blast concrete block on the exteriors, instead of throughout the building, while re-drawing window and door openings to line up with the factory measurements of whole blocks to reduce the cutting needed in the field.
But while material prices can be tied to commodity indices, labor costs are still an "X factor," the proverbial moving target that contractors need to set a bead on early. Key to that is having a binding, detailed bid schedule up front, as is holding subs to it for the scheduled duration of the project, said Sean Edwards, Chief Operating Officer of the education arm at Boston-based Suffolk Construction, which is currently working on projects at Northeastern and Boston University.
“We have a plan and control process to bring trade partners on as early as the preconstruction phase,” he said. “That way, we can all work on the same design alongside the architects and owners to better predict constructability issues that can drive up costs — before they happen.”
Key to the process are detailed check-ins with the whole team every two weeks, he added.
Others hone in on the labor issue by making sure they’re the contractor of choice for their subs. “Companies are getting creative to pay subcontractors a lot quicker, to help build loyalty with their subs,” Shapiro said. “Sometimes, for that prompt payment, they may even get a little cost reduction.”
At Fairfax County Public Schools, Platenberg strives to be a client of choice, too. “We pay on time to keep the blood flowing in the arteries,” Platenberg says. “That keeps people focused.”
Construction Dive news delivered to your inbox
Get the free daily newsletter read by industry experts
- Select Newsletter: Daily Dive M-F
- Select Newsletter: Tech Weekly Every Wednesday
- Select Newsletter: Infrastructure Weekly Every Tuesday
- Select Newsletter: Labor & Safety Weekly Every Thursday
- Select user consent: By signing up to receive our newsletter, you agree to our Terms of Use and Privacy Policy . You can unsubscribe at anytime.

Editors' picks
Upping the luxury quotient: How stadium construction is evolving
From kids’ teams to pro franchises, sports fans and athletes have higher expectations for stadium design, according to an architect.
The top 10 residential builders of 2024
Even with high interest rates, most of the country’s top home builders have held steady or improved their closing numbers, according to Builder magazine’s annual ranking.
Keep up with the story. Subscribe to the Construction Dive free daily newsletter
Company Announcements
- Chicago DOB still needs to fix broken inspection process: report By Matthew Thibault
- June 2024 wins: Contractors tout their latest awards By Construction Dive Staff
- Entegris to get $75M in CHIPS funding for Colorado plant By Joelle Anselmo
- Florida contractor brings Pride to construction By Julie Strupp
hello from header.njk!!
An official website of the United States government
Here’s how you know
Official websites use .gov A .gov website belongs to an official government organization in the United States.
Secure .gov websites use HTTPS A lock ( Lock Locked padlock icon ) or https:// means you’ve safely connected to the .gov website. Share sensitive information only on official, secure websites.
hello from incl-embed-site-alert.njk
hello from incl-embed-local-nav.njk
Education and Workforce Development Cost-Benefit Analysis Guidance
June 30, 2023
View as PDF
Sarah M. Bishop & Peter Glick, MCC
Acronyms and abbreviations
- CA – Constraints Analysis
- CBA – Cost Benefit Analysis
- CEA – Cost-Effectiveness Analysis
- EA – Economic Analysis
- EIF – Entry into Force
- EMIS – Education Management Information System
- ERR – Economic Rate of Return
- GDP – Gross Domestic Product
- IMC – Investment Management Committee
- LSMS – Living Standards Measurement Study
- MCA – Millennium Challenge Account
- MCA – Multi-Criteria Analysis
- MCC – Millennium Challenge Corporation
- M&E – Monitoring and Evaluation
- NPV – Net Present Value
- O&M – Operations and Maintenance
- PIR – Policy and Institutional Reform
- PV – Present Value
- TVET – Technical and Vocational Education and Training
- RBF – Results Based Financing
- RCA – Root Cause Analysis
- SD – Standard Deviation, of test scores
- SCDPs – Sector Consistent Design Patterns documents
- UA – Uncertainty Assessment
- USD – United States Dollars
- VA – Value Added
- WTP – Willingness to Pay
I. INTRODUCTION
A. motivation.
Between 2005 and late 2022, MCC invested over $628 million in education and workforce development interventions at almost every level of education (from primary through tertiary and adult continuing education), formal and non-formal, and in education that results in both academic and technical credentials. 1 As with all MCC investments, those in education and workforce development aim to support the agency’s mission to reduce poverty through economic growth. Theory and evidence points to the importance of human capital —and especially the knowledge and skills attained through education, training, and work experience— as a key determinant of economic growth. 2 In particular, greater levels of human capital facilitate the adoption of new technologies, and can increase efficiency and productivity, and thus enhance economic growth. 3 At the firm level, the supply of skills is one of the criteria that businesses consider when deciding whether to invest, expand, upgrade technology, and hire more workers.
From the perspective of individuals, one of the most robust associations in research on economic development is that between earnings and level of education, bearing out the prediction from human capital theory that more educated people are, on average, more productive and therefore have higher incomes. Reviewing this relationship across countries and across time, Psacharopoulos and Patrinos (2018) find a global average of private (individual) returns to an additional year of schooling to be about 9 percent – a result that has remained stable across decades. Furthermore, disaggregated data show that women continue to experience higher average returns to schooling, and that returns to all are also higher in low-income countries. These findings highlight that targeted education and training investments can have strong implications for income distribution, poverty reduction and inclusion, given that education can equip less advantaged citizens with the means to better access income generating and welfare improving opportunities.
Despite a widespread understanding that education can provide significant benefits to individuals and to economies, notable market failures lead to underinvestment in human capital by private actors (both households and firms) and thus implies a role for public policy. A key market failure is the inability of poor families to borrow to finance their children’s schooling, despite the high potential benefits. In the absence of credit, opportunity costs loom large for poor families (and youth), since children’s work on farms or domestic work is often needed to sustain household consumption, while older children may need to be employed to support themselves or their families. Parents may also lack information about, or not fully value, these benefits. As a consequence, the benefits are not fully taken into account in their decisions regarding investment in their children’s education, implying an underinvestment from a social perspective. On the part of firms, while they would clearly benefit from having a more educated and highly skilled workforce, they do not have an incentive to invest heavily in education (or training) as they generally will be unable to capture these benefits, since those who receive the education are free to work for any firm, not just the one providing the education—i.e, there is an externality. For industry specific skills, firms often do provide on the job-training, though this tends to be less than socially optimal, for the same reason. Related to this externality is a collective action problem. For example, firms in a given industry could collectively provide relevant training and thus meet their skills needs, but enforcing this cooperation can be difficult.
These market failures imply an important role for the public sector to fund, and usually to directly provide, education services. Governments indeed devote substantial resources to education. In 2014 the global average indicated that countries spent about 5% of their GDP on education (World Bank DataBank), 4 and many countries have experienced an increase in private sector provision at all levels of education, as well as a mix of public and private institutions. In many countries, private education provided by religious organizations, for example through Koranic and Catholic schools, is significant. Rising education expenditures have led to a dramatic increase in access to education over the past five decades in developing countries, leading to significant improvements in the quantity of schooling attained. Nevertheless, achieving universal secondary enrollment and completion remains an elusive goal, and the quality of education and learning has also lagged and is often extremely poor, which some recent research suggests explains the lack of association of education and growth at the country level. 5 In significant part this is because governments lack the resources to further expand access to education and improve its quality. Other factors, including poor management of the education sector, are also important. Donor agencies such as MCC can play an important role by infusing resources as well as providing technical assistance for reforms in education, assisting with changes targeting the system/sector, school, teacher, and student levels.
While much of the foregoing has emphasized constraints on increasing the supply of human capital or skills, it should be obvious that this is not the whole picture as the skills provided to individuals need to be demanded in the labor market for there to be significant welfare improving, income and economic growth impacts. 6 In a broad sense, this consideration motivates MCC’s starting point in the compact process, which is usually stated as the identification of binding constraints to private investment and economic growth--private investment being the main source of the demand for labor and for labor with specific skills. Within the scope of the present SCDP, labor market demand considerations play a crucial role in problem diagnosis and program design in education and training, particularly for technical and vocational education and training (TVET), which is—or should be—tightly linked with the labor market and the needs of employers.
B. MCC Experience
Across countries, one can recognize similar patterns and causes of poor education and training outcomes, yet the details of the problems and their potential solutions remain country specific. Evidence-based policy and data analysis are foundational to MCC’s model, a process that begins as soon as a country is selected as an eligible partner. MCC and country counterparts begin collaborating on the Constraints Analysis (CA) to identify the most significant and binding constraints to that country’s economic growth. Since MCC conducted its first CA in late 2007, by 2022, 41 analyses have been completed with MCC partner countries, of which 11 found inadequate education and skills to be one of the binding constraints. Building on the CA findings, the next step in the process is to conduct a root cause analysis (RCA) on prioritized binding constraints. The RCA is intended to drill down to the crux of why specific underlying problems exist. This leads the way to identify where public policy--and MCC as an international development funder--can serve to improve market outcomes and pave the way to greater economic growth and poverty reduction.
To address the country-specific challenges related to education and workforce development, MCC has dedicated its resources to a variety of investment categories including infrastructure and equipment, policy and institutional reforms, technical assistance, curriculum development and training of teachers and others employed within the education system. Interventions have targeted all levels of the education system, from the national government or education ministries to schools and training centers, to educators, to students and their households, and even to strengthening linkages between education and the labor market. Spanning 10 countries in Central America, Africa, Asia, and Eastern Europe, the interventions to date have also typically included efforts to improve education equity and inclusion of marginalized populations.
As project teams move from problem diagnosis to project identification, project logics are developed, and MCC economists carry out a cost-benefit analysis (CBA) of the projects. MCC’s CBA practice is a reflection of the Agency’s strong commitment to the use of rigorous evidence to inform investment decisions and is a requirement for all MCC compact investments. 7 The CBA methodology requires the analyst to quantify all anticipated costs and benefits (private and social) of a potential investment, 8 and then express those costs and benefits in monetary terms to estimate an economic rate of return (ERR) on the investment. This summary metric allows for comparison to other potential projects as well as to some minimum required rate of return. For MCC projects the typical ERR threshold that projects are expected to meet is 10%. The analysis is conducted at several points in time over the life of a compact investment. The most important is the CBA that informs the initial investment decision. During program implementation, a revised CBA may be needed to guide decision making when changes occur to the originally designed project. Additionally, MCC economists produce a ‘closeout’ CBA model within about a year after a compact’s closure, which will fully capture changes to project cost and scope. Finally, an independent entity is typically engaged to conduct an impact evaluation of the project, the findings from which are increasingly being utilized to conduct ‘evaluation-based’ CBAs. Note that for this final stage, the CBA uses actual information on realized project benefits from the evaluation, in contrast to predicted benefits in earlier versions of the CBA.
The closeout CBA and evaluation-based CBA are often linked to the last step in a project’s lifecycle: assessing the success of its implementation and its ability to achieve the intended objective. Evaluation is integral to MCC’s commitment to accountability, learning, transparency, and evidence-based decision making. MCC published its first general education evaluation findings in 2011. The Insights from General Education Evaluations Brief reviews and synthesizes MCC’s findings from its independent evaluations in general education, covering investments in both primary and secondary education. The evaluation results are supplemented with lessons learned developed by MCC staff. MCC plans to conduct a deeper analysis of lessons learned for general education, which will be published in a forthcoming Principles into Practice paper. The 2020 Principles into Practice: Training Service Delivery for Jobs and Productivity reviewed MCC’s lessons in technical and vocational education and training.
Lastly, it should be noted that CBA is not the only approach to assessing education projects. For example, cost-effectiveness analysis (CEA) is often used to compare education-related investments based on the costs to achieve a specific educational outcome, such as higher test scores or grade attainment, that is quantified but not assigned a monetary value. CEA could be more broadly considered at MCC, and particularly for education when multiple intervention options are on the table to support improvements in a specific educational outcome. Further, MCC’s own Beneficiary Analysis, discussed briefly in this paper, assesses projects on how well they target specific populations of interest, including the poor and women.
C. Purpose and Organization of the Guidance
This Sector Consistent Design Pattern (SCDP) guidance in Education follows similar guidance documents for other key sectors, namely Water Supply and Sanitation (Osborne, 2019), Land (Bowen and Ngeleza, 2019), Transport (Carter, 2020), Power (Epley, Mulangu, and Bowen, 2021), 9 and Agriculture (Szott and Motamed, 2023). There is also a forthcoming SCDP in Health (Myers, Osborne, and Payaam, 2023). Each SCDP is built upon MCC’s general Guidelines for Economic and Beneficiary Analysis, 10 which provides the overall principles that should be applied to projects in all sectors. The SCDPs are intended to serve as “living” resources that will be updated as necessary, as evidence and methods evolve and MCC’s approach shifts to reflect the latest findings in the sector.
The main purpose of this document is to provide guidance for MCC’s economic analysis of interventions in education. It will support analysts and economists who will conduct or review this work. These individuals will include MCC analysts, consultants to MCC, peer reviewers and counterparts in our partner countries. To reach this objective, this guidance seeks to provide a way of thinking about costs, benefits, uncertainty, and other topics, noting the strengths and weakness of different methodological approaches. It does not provide specific tools or spreadsheets that could serve as a paint-by-numbers approach to doing CBA in education. In fact, a main takeaway from the paper should be that the specifications of each model will be highly dependent on the location, context, problems being addressed, and detailed objectives of the proposed interventions.
This documentation of MCC practices and experience can also support several other purposes such as to improve consistency in MCC’s own work in education CBAs as carried out by different economists; facilitate peer reviews; and increase the transparency and accountability related to this work. By fostering dialogue on the strengths and limitations of CBA for different types of education interventions, this guide can help to advance the fields of education, monitoring and evaluation, and economic analysis.
This guidance is based on the broad field of education and training research but is grounded in MCC’s experience and the interventions that the Agency normally supports. Reflecting MCC’s investment portfolio, we focus on general education at the primary and secondary levels, with some reference to tertiary. Not covered here are pre-school/pre-kindergarten level interventions. While such early interventions have been shown to have significant long-term impacts, MCC has not yet invested in this space, so we do not consider such projects. 11 In addition to general education, the paper also considers technical and vocational education and training (TVET) programs, which are intended to provide skills for the world of work, thus encompassing (in a broad definition) any education and training which provides knowledge and skills to enhance productivity and success at work, whether provided through formal or non-formal approaches and in school or work-based settings. Clearly, TVET is part of education in a broad sense (and the reverse, since all schooling ultimately prepares young people for the world of work in addition to other objectives), but given its particularly tight linkages to livelihoods, it is also distinct and therefore is given separate treatment in the paper.
Note should also be made of two topics tightly related to education and training that are touched upon frequently within this guidance: labor markets and health. With regard to the former, as mentioned above, the impacts of the education system play out most significantly in the labor market. Thus, labor market characteristics and conditions influence the returns to education and training investments, potentially reducing the expected impacts. MCC has occasionally made investments aimed to improve the operation of labor markets. Such interventions are not covered by this CBA guidance, but the discussion below will refer to labor market factors, especially when considering TVET programs. With regard to health, an individual’s health, not just education or skills, is encompassed within the concept of human capital. 12 This will be further discussed below, but as with labor market interventions, this guide does not address CBA of health interventions, as a separate forthcoming guidance paper will be dedicated to economic analysis of MCC’s health and nutrition programs.
Organization of the Guidance
With this framing in mind, the remainder of this education and workforce development CBA guidance is organized into two main sections. Section II is focused on providing key background and programmatic information that is essential for designing a strong CBA model that captures the characteristics and objectives of the education investment. This section includes the following three components: the identification of problems; a typology of interventions or ‘projects’ to address those problems; and the use of these components to develop the project’s logic to get from inputs to outputs to outcomes and the longer-term impacts. Through Section II the reader should have a better understanding of the education sector and be more equipped to dive into the technical aspects of the economic analysis, which is the subject of Section III.
Section III begins by introducing the economic logic, which uses a well-defined counterfactual (i.e., a without project scenario) to capture the program logic’s outputs and outcomes as the CBA model’s intended benefit streams, with note on how these change across time. Section III. A, provides considerations for how to develop the counterfactual, time horizon, and discount rate for education and training projects. Section III. B follows with a focus on the work to identify, quantify, and monetize benefit streams. Three interventions based on MCC experience are included to provide concrete examples of applying these concepts to education and training projects. The discussion shifts in Section III. C to outline key cost considerations and MCC practices in defining and measuring all social costs require to reach the intervention’s intended benefits. All the topics in Section III are brought together in subsection D to determine the CBA results, with a description of useful sensitivity analysis that can inform the CBA metrics reported, as well as distributional analysis that can highlight results by important groups. Finally, Section III. E concludes by acknowledging the limitations of this guidance and provides recommendations on areas for further examination or coverage in a future version the SCDP in education and training.
II. EDUCATION AND TRAINING SECTOR: SETTING THE STAGE FOR CBA
A. what’s the problem.
The field of education is complex, and interventions can be motivated by the desire to address numerous problems. This guidance does not attempt to go into detail on every type of problem that might be encountered in the education sphere, but rather to describe the problem diagnosis approach at MCC and highlight aspects specific to education and training. In particular, the section outlines three core problems identified in the literature and through MCC’s experience in education and training: – (1) inadequate quantity of education (encompassing low enrollment and completion rates), (2) poor quality of the education received, and (3) low relevance of skills obtained in the labor market (also referred to somewhat more narrowly as a skills mismatch). 13 This section also provides insights into the potential root causes of these core problems—the next step in the process of designing interventions to address well-defined problems – and explores the linkages between education-related problems with other related topics, namely social and gender inclusion, labor markets and health.
For any sector, correctly identifying the problem, who is affected by it and how, is critical for the design and success of an investment in achieving the desired outcomes. Well-defined problems support the development of appropriate interventions to address those identified problems, as well as the proper selection and measurement of the related benefit streams, and ultimately the development of a more cost-effective project overall. Within the MCC context, after a country is selected as an eligible partner, joint work by MCC and the partner country team begins on the problem diagnosis through a Constraints Analysis (CA) to identify the greatest constraints to that country’s economic growth. Within the MCC team, the economist leads this work, which is built upon the foundations outlined in the Growth Diagnostic work by Hausmann, Rodrik, and Velasco (2005). Since MCC conducted its first CA in late 2007, 41 such analyses have been completed with MCC partner countries, of which 11 found human capital, particularly in education, to be one of the binding constraints to their economic growth (Annex I).
Given that human capital, broadly defined, is a key input into production, it is not surprising that constraints analysis for developing countries may find that inadequate human capital is constraining a country’s economic growth and its opportunities to reduce poverty through economic growth. Human capital can be a constraint either through low productivity due to poor current health or developmental deficiencies stemming from poor nutrition in childhood (as covered in the forthcoming health SCDP), or—the more commonly analyzed pathway and our focus here-- through a deficient supply of skills for productive work. From the perspective of private firms, the availability or cost of human capital will affect decisions about investment, choice of technology, and exporting, thus strongly influencing productivity and economic growth. An education or skills-related human capital constraint occurs when the supply of skills does not meet the actual or potential demand of employers that would allow them to effectively manage, operate, and/or expand businesses overall or at a competitive cost. This is distinct from labor market problems on the demand or policy side that do not directly involve a human capital shortfall. For example, excessive labor regulations can make it difficult or costly to hire individuals with the right skills, or to dismiss those without the necessary skills. Finally, private investment and the associated demand for labor may be constrained by various factors, such as a poor macroeconomic policy environment, that lie outside the labor market (as well as the education sector) itself.
It is important to highlight as well that human capital constraints have especially strong implications for income distribution and poverty reduction, given that education can equip citizens with the means to access income generating and welfare improving opportunities. Targeted investments to tackle such constraints among marginalized subsets of the population can thus support greater inclusion and income distribution.
After the binding constraints to growth are identified, the next step in the process requires MCC country teams to conduct a root cause analysis (RCA) on each constraint. The RCA asks why a constraint exists. For example, root causes of low quantity of education might be found to be one or a combination of a lack of physical access to schools, high private costs of education (combined with lack of access to credit), or a belief that there are no or few benefits of schooling or schooling beyond some level ( especially for girls), or a perception that schools or teachers, hence the education provided, are of poor quality. This is detailed further below with additional examples of root causes for education and training constraints.
Annex II lists the 13 MCC country programs to date with education investments, noting whether a CA was conducted and, if so, then whether it found education as a constraint, or as a root cause to a different binding constraint. This provides a more complete picture of the connection between the CA, RCA and where MCC has invested in education. In summary, of the 13 country programs with education investments, 7 of them were from the period before CAs became an MCC practice. Of the remaining 6 that were based on CAs, in all but one case education was identified as a binding constraint. The remaining case was the CA for El Salvador’s second compact, for which education was found to be between a binding constraint and a root cause--The analysis framed the main constraint as low productivity in exports, with one of the three main barriers to this constraint found to be human capital deficiencies related to education. 14 There are also 5 additional countries where education was found to be one of several binding constraints, but due to other MCC decision factors these did not result in education-related investments.
The shift from speaking about constraints to problems occurs when MCC begins to assess what aspects of the constraint could be addressed by an MCC-supported intervention – i.e., taking into consideration the other MCC decision criteria. 15 The defined ‘core problem’ will be closely related to a constraint but is often narrower, and will become the focus for the RCA, which will be directed at identifying root causes of MCC-actionable problems. This process to further define the problem will result in a specific problem statement that can be used to inform project identification, project logic, and the economic logic that underpins the CBA. For the remainder of this subsection, the term ‘core problem’ is used, but as noted these are often similar to the identified constraints.
During the last 15 years of conducting CAs, three main education-related constraints, referred to simply as problems here, have emerged. 16 Table 1 summarizes these problems, which are by no means mutually exclusive. The second column of the table indicates what kind of evidence would lead to identification of that problem, and the third column points to possible underlying causes of that problem that may emerge in the RCA. 17
In no particular order, the first problem is described as an inadequate quantity of education. In this situation, it would be difficult for employers to find enough workers with the requisite level of education to meet their needs. In some countries there could be a lack of graduates from primary or lower secondary school, resulting in low literacy and numeracy among those in the labor market. Note that ‘quantity’ could be indicated by graduation rates for different levels of schooling, by grade attainment, or simply enrollment overall or at different levels.
Second is the low quality of the education. When education quality is a problem, employers may observe adequate numbers of graduates at different levels of education (i.e., quantity of schooling), and in the right fields, but their skills are poorly developed. One might observe that many students graduate from secondary school without obtaining adequate skills, for example. For the analyst, assessing whether skills are up to a certain level may be easiest for general education in areas such as basic numeracy and literacy, where national, regional, or international exams may assess students’ competency against pre-defined standards for a given level of education. Note that the low education quality problem is distinct from, but potentially related to quantity of schooling. One can imagine a situation where low quality of education and resulting poor learning outcomes for students reduces the expected productivity and earnings benefit of additional years of schooling, which lead parents or students to choose not to proceed beyond some relatively low level of years of schooling.
The third problem is a skills mismatch, or more broadly, a lack of labor market ‘relevance’ of schooling obtained. In this situation, there may be plenty of graduates but not in key fields of study, or with the types of skills, needed by employers. The mismatch problem may be most relevant to TVET and higher education, where students tend to select a particular course of study and may select fields that do not match the specific needs of employers. However, it should be noted that the notion of skills mismatch is a broad one. Perhaps most obviously, it encompasses a lack of individuals with specific skills for particular industries, such as food processing technicians or aerospace engineers. Yet it could also refer to a lack of more general technical skills that can be used in many sectors, such as IT skills, accounting, or engineering. Even more broadly, it could describe a situation where students, with an eye toward ‘safe’ public sector jobs, tend to select a range of fields of study like law or humanities rather than STEM fields. The latter may be more valued by the private sector, but the jobs offered by the private sector may be viewed as less secure or having fewer benefits and thus be considered less desirable than employment in the public sector (a pattern observed in many developing economies). Clearly, the broader definitions of ‘mismatch’ may start to look more like ‘general skills deficit’ than a highly specific ‘skills mismatch’. Whatever the terminology applied, it is important to be clear about the type of mismatch or relevance problem that exists in a given situation, as the root cause of the problem and indicated interventions may differ. For example, the first case noted above could imply the need for industry specific TVET, while the third and likely also the second could imply that changes are needed in general education coursework or in incentives to entice students to enter or complete their studies for in-demand fields.
As just noted, TVET investments are typically thought of as a solution to the third problem, a skills mismatch. Defined more broadly, however, TVET also encompasses interventions to address aspects of both the first and second problems. This is particularly relevant for training programs that focus on general and remedial skill building, such as literacy training or soft skills training for individuals who are no longer in formal schooling, and who are currently unemployed or economically inactive, i.e., out of the labor force. This and other types of TVET interventions will be defined in the next section of the paper.
| Problem | Potential Evidence of the Problem | Potential areas to examine during Root Cause Analysis |
|---|---|---|
| There are not enough graduates to satisfy market demand. It could be that there are not enough graduates at all levels of education or at only certain levels. | If there are not enough graduates, questions for the RCA would include: |
| Problem | Potential Evidence of the Problem | Potential areas to examine during Root Cause Analysis |
|---|---|---|
| There may be enough graduates at the different levels of education, and they may be graduating in the right fields, but their skills are poorly developed. | During the RCA the team will try to understand if this problem is due to: |
| Problem | Potential Evidence of the Problem | Potential areas to examine during Root Cause Analysis |
|---|---|---|
| If there are plenty of graduates (e.g., of secondary school), but they have not acquired skills that the labor market demands then this could be an example of a “skills mismatch,” which may be most relevant to the TVET and higher education arenas. | and probably high levels of unemployment. However, high levels of unemployment may also signal other problems, such as labor market regulations or higher reservation wages than what is being offered on the market. | The RCA may question whether there are problems with the quality of instruction, quality or relevance of curricula, not enough programs provided in the market at the right level or in the right fields, market distortions, or other mismatched incentives/preferences (e.g., prejudice against technical vocational training). |
Examining Separate, but Related Problems: Considering their implications for education-related interventions
Thus far, we have focused on education and training-related problems, but there are considerations that require more attention to obtain a holistic perspective of the constraints and their root causes. This is particularly important as we move from problems to interventions that aim to address those problems. Here we briefly note the relationship between the key problems identified above, and three other factors, which are typically examined separately in the CA: inclusion and equity, labor markets, and health. Their relationship to education should be assessed, and as relevant, incorporated into the intervention’s logic and design, as well as the CBA model. The analyst should determine the potential for these factors to influence the education-related intervention’s costs and benefits overall and their distribution among subsets of the population. The specifics and significance of these issues will depend on the country context.
- Equity and Inclusion : For any of the three key problems outlined above, the questions asked during the CA and RCA consider how the problem may affect citizens differently based on income level, gender, location, ethnicity, native language, etc. If education or training opportunities are not available or accessible to certain groups, the ability of these groups to enjoy improved incomes and welfare will be hindered, and overall economic growth itself may be restricted. 20 The context should be considered for each country to determine how the lack of access to education or training limits inclusion (and/or is caused by a lack of inclusion). Identifying disparities and related challenges during the problem diagnosis phase will support teams in designing programs that address these issues more wholistically and that integrate these aspects into the project’s design. For example, interventions to improve quality via curriculum changes may require special support for less advantaged groups for them to also benefit. Obviously, analyzing these issues requires information disaggregated by gender, income level, and other relevant categories.
On the labor supply side, labor market policies, laws or regulations can incentivize or disincentivize investments in a given type or level of skills. For example, as noted earlier, governments may incentive training for careers in the public sector through generous benefits and job security that are not offered in most private sector jobs.
- Health : Poor health or nutrition may contribute to the first two education problems (low quantity and quality) outlined above. Children who experience poor nutrition or poor overall health are more likely to miss days of school, repeat grades, or dropout. Even when these students attend school, their health condition impacts their ability to learn, with the literature showing that malnourished children have difficulty concentrating and retaining information. Therefore, both education quantity (e.g., attainment) and ‘quality’ (defined here as individual ability to learn, not objective quality of teaching or infrastructure) are negatively affected. Further, there are important linkages in the other direction, from education to improved health and nutrition; in particular, a large literature shows the positive impacts of mother’s education (controlling for household resources) on children’s nutrition. Further, higher incomes as a result of having more education enables individuals and families to better afford food and health care. The education-health nexus is also related to equity and inclusion, given that access to sufficient, nutritious food or necessary medical care is disproportionately a problem for poorer households or certain subsets of the population. Health is examined separately in the CA and a future SCDP will be dedicated to this topic, as well as an MCC produced guidance and toolkit on how to appropriately examine nutrition. 24 However, as health issues can clearly impinge upon education success, it is important for teams to be able to identify problems in both areas where they are relevant, and in turn develop appropriate solutions to address the root causes of those problems. 25
B. How MCC Country Programs tackle identified Problems
The previous section described MCC’s problem diagnosis process, moving from the Constraints Analysis to the Root Cause Analysis in order to develop detailed problem statements and from that to focused interventions. As noted, the problem statements inform the eventual project’s logic as well as the economic logic that underpins the CBA. This section describes education-related interventions, focusing on the potential inputs and outputs that they can produce. A broad set of potential interventions is outlined below with indications on where MCC has had experience. The sections that follow will dive into the overall project logics and economic logics for key interventions implemented by MCC and continue by detailing those interventions’ expected outcomes and benefit streams.
Donors and governments support a wide range of investments in education and training, yet a unified sector-level taxonomy has not been widely adopted. In an effort to organize the myriad of potential investments, this document separates interventions into the following four categories, based on the level at which the intervention’s implementation is intended to directly impact: the overall education system; the school or training center; the educator teacher; and the student or household. 26 The first three focus on supply-side interventions, meaning that they aim to support improvements in the provision of education, whereas the fourth aims to increase demand for education by focusing on households and students. These categories are not necessarily mutually exclusive and indeed are often combined to holistically tackle complex problems. It should be noted that the level at which an intervention is implemented is not necessarily the level at which decisions about that interventions are made. Most importantly, changes in curricula, teacher training, school hours, etc., will often or even typically be determined at the system or ministry level, which has overall decision making and budgetary authority. 27
Further, within each level, interventions may be further distinguished by the focus or elements of the intervention, which may include policy and institutional reform (PIR), ‘hard investments’ like infrastructure and equipment, or non-infrastructure (‘soft’) investments such as training, technical assistance, and curriculum development. A further, distinct, element consists of measures to improve equity and inclusion of marginalized populations, which may feature as part of interventions at any of the levels.
The four categories of intervention levels are described in the bullets that follow, and Table 2 provides an illustrative list of potential investments for each level, and mentions as examples related MCC programs (note these do not comprise an exhaustive list of MCC education investments).
- System : At the highest level, these supply-side interventions are designed to impact the system that governs education service delivery, at a national or regional level. They often involve but are not limited to PIR (and PIR can be implemented at lower levels as well). For example, several projects noted below involve instituting systematic data collection about schools and students to facilitate data-driven decision making when allocating limited education resources. Such an intervention requires hard investments in computing hardware and software, as well as expertise to design a data collection system that can ultimately support PIR that can shift practices in using data to inform decision making. Interventions at this level could also include an overhaul or initial development of a national curriculum for a certain level of education or specific subjects, or a system for the operation and maintenance of schools or the use of public-private partnerships, particularly for TVET. At this level, decisions and implementation would both be expected to center around the system level.
- School/Training Facility : These supply-side interventions may include new, expanded, or rehabilitated buildings, new equipment, or improved teaching materials. They may also encompass school-level adjustments in practices, such as increasing the length of a school day, changes in class size, or adopting a school-based management approach. While these interventions are implemented at the school level, system-level decision making would likely play a role in defining school-level policies or determining the amount of funding available for a given purpose.
- Educators (teachers, principals, other school staff) : Educators—above all the teachers--are a critical input to the education system. Interventions at this level employ various mechanisms to increase the quantity and/or improve the quality of teachers or other staff (existing and new), and potentially their supervisors as well. Teacher training is a common intervention that can include a variety of approaches such as pre-service training for those entering the profession, in-service training for existing teachers, and trainings themselves can differ by total hours, the mix between pedagogical and subject-matter instruction, mentoring, professional peer groups, etc. Additionally, teacher-level interventions will often require altering incentives and expectations of teachers, which may be categorized as PIR or coupled with larger system-level or school-level efforts. PIR-related activities at this level may also include, among other measures, a salary scheme based on qualifications and performance, or early retirement incentives that entice underqualified teachers to leave the system.
- Students/Households : These interventions seek primarily to stimulate the demand for or access to education, often focused on certain groups that may be considered disadvantaged or excluded from participating due to various reasons. Interventions targeting students or households may also be designed to impact the quality of learning, e.g., via school-based nutrition programming. Funding for such programs often comes from system-level decision making but could stem from grassroots or community-based efforts.
In addition to categorization by the level at which an intervention is implemented, investments are distinguished by whether they are in general education or TVET, and at what level of education – i.e., pre-school or early childhood education, primary, lower secondary, upper secondary, tertiary, and continuing education. The interventions outlined in the table are generally applicable to all education levels and types of schooling or training, but these further distinctions by school type or level will come into play during detailed project design and appraisal. This is particularly true for TVET investments, which in addition to basic elements such as infrastructure or teacher training, also have features reflecting orientation to and linkages with the labor market and employers. This leads to interventions that extend beyond the education system proper. The table below thus includes two additional categories to capture key activities within the labor market and with employers, which are often incorporated into TVET interventions.
Continuing briefly with the focus on TVET, several different forms of TVET can be noted, each reflecting specific objectives directed at specific beneficiary populations defined by their status in the labor market. The following three-way categorization is useful (Almeida, et al., 2012), though as noted below programs may combine elements of more than one type: 28
- Pre-employment training : Training in specific fields, usually as part of the formal education system and for youth who are still in school (i.e., who have not yet entered the labor market) or those who are looking to change careers.
- Training-related active labor market programs : Skills training – technical and industry focused or general and remedial, e.g., literacy training or soft skills training — for individuals who are no longer in formal schooling, and who are currently unemployed or out of the labor market. Typical participants include, but are not limited to, those who have dropped out of school, disadvantaged youth, and women who are not in the labor force.
- On-the-job or Continuous (or ‘In-Service’) training : This includes occupation-specific training for employed individuals, which may be provided by their employers privately or in cooperation with the public sector or a TVET center.
| Intervention’s Focus | Types of Potential Interventions (not exhaustive) | Examples: MCC Investment Experience |
|---|---|---|
| [typically, at national or regional level] | and setting learning objectives by grade is often determined at a national level, and linked with pre-service and in-service teacher training, development of required materials, national student assessments, etc. to monitor and track schools, teachers, students, etc. within one system to better understand the demand and use of resources, improve data-driven decision making, report on performance across time, etc. This could include developing a new system or improving/expanding an existing system or its use. are often conducted at the national level to determine performance on set learning objectives across the country. The government may also choose to participate in regional or international exams to understand their performance relative to those outside the country. State-level, school-level and classroom-level assessments may be performed on a regular basis as well. For TVET, are used to track graduates’ employment outcomes. : Each year governments must decide how to allocate limited resources across the many demands of an education system. Interventions may support data-driven decision making, improve process for , introduce (O&M) programs to reduce long run costs of schooling, etc. : Education service delivery includes different types of schools, with great variation in availability and cost by country, and potential for government subsidies to some students to attend non-public schools, or other programs to create more equity or other objectives among the options available. Public-private partnerships have become common practice for TVET programs. established or improved upon, is important both for general education and especially for TVET and higher education systems. | Secondary Education: Support to complete two rounds of three international assessments, six national assessments, and tools for school-level evaluations. : Develop occupational standards, accreditation, and curriculum with industry input. General Education: Developed, planned, and implemented rigorous international and national assessments of student learning, using data to inform decision making. Provided technical assistant to develop a new approach to routine and periodic maintenance of school infrastructure and equipment, defining actor roles and responsibilities and formed new private sector partnerships.: Policy reform to strengthen involvement of private sector in governance and management of TVET system at all levels, to clearly define roles and responsibilities of different actors, and establish performance evaluation mechanisms for funding. |
| [all education service delivery facilities, including training centers] | to build new schools, rehabilitate existing schools, or expand existing schools to include additional classrooms, create specific-use spaces (e.g., libraries, playgrounds, sports fields), provide canteens, potable water, electricity, heating or cooling systems, gender-specific bathrooms, etc. that ranges from the basics (e.g., desks, chairs, etc.) to computers or training-specific machinery – particularly for TVET. , such as textbooks, guides, workbooks, writing materials, chalkboards, etc. typically shifts some portion of decision-making authority from central government to schools, perhaps with a community-based element like a parent-teacher association. This may also be linked to school-level performance management. , such as lengthening the school day, reducing class sizes, introducing specific-skills programs, etc. | : Within new school improvement model, rehabilitated 89 lower and upper secondary schools in 3 regions, provided computer and didactic equipment to support learning, and developed greater school management. : Used a private sector-driven TVET grant facility to establish 15 PPP centers (new, expanded existing PPP centers, or transform public centers to PPPs); Rehabilitated 91 schools outside capital, focused on grades 7-12: upgraded heating, lighting, sanitation systems and installation of science labs. : Developed, expanded, or improved over 50 TVET accredited, in-demand degree programs at 10 public and private education institutions throughout country. : Rehabilitate, constructed and equipped science and engineering labs and classrooms, supported 20-year partnership with San Diego State University. Constructed 62 primary level, girl-friendly schools with 3 classrooms, teacher lodging, separate latrines, and boreholes. Provided textbooks and materials for all schools and created school management committees. Rehabilitation or construction of 221 schools teaching kindergarten, primary and/or junior high school. : built 132 primary schools with classrooms for grades 1 through 6, furnished with desks and blackboards, and linked to 132 preschools, separate latrines for girls and boys, housing for teachers, and water pumps. |
| [Teachers, principals, other staff] | aimed to improve teacher quality; can include pedagogical and/or subject-matter training. aimed to improve the quality of new teachers entering the education system, would include both pedagogical and subject-matter training. interventions could be included within any of the other activities mentioned at this level. to increase the supply and performance of teachers within the system, such as provision of housing or bonuses for teachers in rural areas, professional development scheme that associates qualifications, years of service and performance with a clear salary trajectory, or an early retirement bonus for teachers that typically have less education and are less willing to adopt new teaching practices. | Within new school improvement model, developed and implemented activities to support a student-centered pedagogy, including teacher training. Trained all 2085 public school principals, at least one professional development facilitator per school, and all 18,750 secondary school STEM, geography, and English teachers in the country. Provided teacher lodging at each school constructed, and train and support teachers in new method of early grade reading instruction. Provided teacher housing at newly built schools, capacity building to school officials. |
| [& Households] | can provide some students with access to a next level of education, or higher quality institutions, or incentivize students (and the household decision makers) to remain in their existing school and may provide an opportunity to focus more on school if this reduces the need to engage in other income-earning activities during the school year. to provide a lower cost, safer, and/or more reliable option for students to get to and from school, particularly for those who are located further from schools or would have to incur high costs or risks to their safety/wellbeing to use other transportation modes. interventions could include provision of food rations or school meals, female sanitary products, or access to simple testing and treatments (e.g., deworming), which could increase the benefits to schooling in the eyes of parents and improve learning. that aim to change household perceptions of education to increase demand for education – e.g., publishing data on quality of education, returns to education, inclusion of women/girls, etc. | offer daily meals for students, monthly food rations for strong attendance, mentor girls, adult literacy and numeracy training, mobilization campaign for girls’ education. Supported community engagement, developed a mentoring program and student leadership activities. |
| Related Interventions, Outside of the Education System (Particularly Relevant for TVET) | ||
| : (1) Strengthen national Labor Market Observatory to improve policy coordination and promote joint activities among relevant Government agencies for labor market analysis; develop and rollout a related information dissemination platform. (2) Use results-based financing mechanism to replicate and expand proven programs providing integrated job placement services that targeted women and at-risk urban and peri-urban youth that were unemployed or outside the labor market. | ||
| [public or private] | Industry input has been provided in several countries such as Morocco II, Georgia II, Mongolia and Côte d’Ivoire to select the fields and levels of training, develop curriculum, provide trainers and in-kind donations of old machinery and equipment or land, etc. | |
MCC Experience
The far-right column in Table 2 provides examples of MCC education investments for each level of intervention described above, starting with the system level. Each entry provides the country name, years of the program, and key outputs that were completed or are in progress, depending on the stage of implementation. This is not an exhaustive list, but it does demonstrate where MCC’s efforts have been focused and where they may be headed. For example, earlier programs focused heavily on building new and rehabilitating existing school infrastructure. The recently published MCC assessment “Insights from General Education Evaluations” (September 2022) summarizes the agency’s earlier approach as follows:
Many of the early education projects for which MCC has evaluation results, tended to focus primarily on school infrastructure and textbooks as opposed to issues such as governance and policy reforms necessary to improve the learning curve. Additionally, MCC invested in wide ranging programs that tried to tackle numerous problems within the education system in a partner country, which spread limited resources over too many activities and made them difficult to implement.
Newer programs may still include ‘traditional’ investments like school infrastructure but typically will also have PIR components closely tied to the investments in infrastructure, with the aim of supporting sustainability. MCC continues to work towards finding the right balance between a significant investment that addresses identified constraints in order to initiate change or provide a demonstration effect, while also being implementable within five-years, cost-effective, evaluable, and having significant country ownership. MCC priorities also include designing interventions that support inclusion, climate change, and strengthen private sector engagement. These aspects and learning from our existing programs will continue to shape future MCC investments in education.
Experience with TVET
Between 2008 and 2014, MCC invested over $148 million in TVET programs. In the earlier ‘First Generation’ MCC TVET investments, such as El Salvador I, Namibia, and Morocco I, there was a predominant focus on programs to provide skills for out of school youth or disadvantaged populations, that is, the second of the three TVET types described above. However, this was not an exclusive focus, as some in-school TVET and in-service training were also included in these earlier compacts. As detailed in the ‘Principles into Practice’ report on MCC’s TVET experience, 29 independent evaluations from El Salvador I, Morocco I, and Namibia revealed that the programs achieved many output targets but failed to achieve the intended labor market outcomes. In this respect, MCC’s results were similar to broader experiences with TVET. Weak TVET service provider accountability, especially to firms, and curricula that did not meet the needs of the private sector were identified as key factors behind the disappointing labor market outcomes. This also was in line with broader experience: thinking in the field was coalescing around the idea that failure to design programs that meet employer needs--and to work closely with employers to identify these needs and design appropriate curricula--lay behind the weak performance of TVET.
“Second Generation” MCC TVET investments have tried to address these shortcomings, by enhancing efforts to ensure provider accountability and tighter linkages to employers and the private sector — in other words, a model of TVET that is industry- or demand-driven. Compacts in Georgia, Morocco, and El Salvador (all second compacts) and Côte d’Ivoire include mechanisms to continuously involve the private sector or employers in TVET design and operation, internships or apprenticeships with employers to supplement classroom training, and various activities targeting TVET sector management, governance, or accountability. Given this industry focus, the newer programs tend to be more oriented to in-school, pre-labor force entry TVET programming (TVET Type 1) or to continuous training for current employees in targeted sectors or fields (Type 3), rather than remedial or general skills programs for say, low income out of school youth. 30 Actually, the new programs tend to combine elements of the first and third TVET models, with the common ingredient being the strong employer or demand led orientation and employer participation. Thus, for Georgia II the selected centers are in STEM related fields and were designed for individuals with significant schooling (they were level IV or V out of V). Most participants have at least several years of work experience, so the interventions are not designed (only) for individuals who are in the pre-labor force entry phase. On the other hand, the employed participants may either be in the targeted fields or may enter from a different field, so the scope is broader than standard in service training provided by a firm to its employees.
Despite this new focus, some recent compacts do still feature Type 2 TVET interventions. For example, Morocco II’s Results‐based Financing (RBF) for Inclusive Employment sub-Activity aim to replicate and expand proven programs to provide integrated job placement services targeted at women, at-risk urban and peri-urban youth that are unemployed or not in the labor force.
Grant funding mechanism : Also reflecting a greater focus on private sector and industry demands, several recent MCC compacts—including Côte d’Ivoire, Georgia II, and Morocco II, and somewhat earlier, Namibia—have employed a competitive grants program to select who receives funding and technical assistance to support existing and/or new TVET centers. Explicit industry participation (e.g., sector committees/associations, consortium) is a requirement for potential grantees in these schemes, usually requiring them to provide a minimum financial contribution and include some form of a public private partnership (PPP) agreement. The grants are variably used for pre-labor force entry training for youth, training for those switching careers, or for in-service training for individuals already employed in the industry. This funding mechanism has several advantages, such as flexibility, responsiveness to industry demand, and a strong private sector stake as the industry shares the costs and can directly benefit from having a better skilled labor force. However, MCC has also experienced challenges during implementation, particularly where sector associations are weaker, and in conducting the requisite CBA. Estimating the TVET activity level ERR involves conducting separate CBAs for each of the awarded projects, and then appropriately aggregating. This requires cost and expected benefit data for various centers (and typically covers a variety of economic sectors), and timing of awards have not met MCC’s typical compact investment decision timelines. The latter would also be true for results-based financing or other innovative funding methods, but MCC has had limited experience with RBF to date (see Morocco II RBF example in Table 2). The issue of CBA for programs with grants facilities is discussed further below in Section III.
C. Project Logics
A common practice in project design, at MCC and elsewhere, is to develop a project’s logic or a theory of change that summarizes the problem(s) intending to be addressed, the targeted population(s), and the proposed logic chain of how project inputs will lead to outputs, then outcomes – often with a distinction between short-term and medium-term outcomes, and ultimately, final impacts. Underlying the project logic (if not always explicitly noted) is the overarching aim of designing an investment that ultimately supports poverty reduction through economic growth – i.e., MCC’s mission.
This work on developing project logics is typically completed through a collaborative project team effort, often involving key stakeholders (e.g., implementers, donors, target population) and producing a simplified summary diagram that aims to highlight how the project’s implementation will lead to the intended impacts. The project logic authors would also specify the assumptions and risks along each causal chain, specifically where outcomes depend on a change in behavior, co-funding, PIR, or buy-in from certain groups. Identifying these early on can mitigate risks by incorporating activities that ensure these requirements are met, or if not, support learning about them by clearly specifying testable assumptions about necessary complementary factors.
Overall, the exercise to jointly produce a project logic helps to ensure strong project management, the design of appropriate monitoring strategies that keep the project on track to meeting the objectives, allow for adjusting the design as needed during implementation, and provides information for accountability and learning. At MCC, monitoring and evaluation (M&E) are required for all projects, 31 and the economists work closely with M&E leads to develop CBA models that are aligned with, and do not contradict, the project logic. As noted earlier, the economists are responsible for the economic analysis (CBA) at various points within project design, as well as during and after implementation.
Figure 1 provides a high-level or general project logic for education and training projects. The intention here is to give a sense for the structure and key components of an education or training project logic. It is not intended as a template for a given project, as logics are unique for each intervention and, therefore, tailored to capture the detailed characteristics of that intervention. The first two steps in the project logic – specification of the problem and of the potential interventions to address it—have already been described in detail above in Sections II.A and II.B and comprise the first two columns of the figure.
Subsequent steps in the project logic include the expected outcomes, distinguishing between those that are anticipated to occur in the short, medium and longer term, with the latter often referred to as the eventual impacts or even the potential benefits. 32 These components, highlighted in bold text in the figure, will be discussed in more detail in the next section, where we link outcomes in the logic with quantified and monetized benefit streams for the CBA.
As the figure indicates, there may be interdependencies between the outcomes of a project. In particular, higher quality of schooling as a result of an intervention is also expected to induce greater enrollment and attainment. This of course just mirrors the linkages of the key problems noted earlier, with low education quality having the potential to lead to low quantity (enrollment or attainment).
Finally, the bottom of the figure (below the dotted line, boxes colored in light grey) depicts education system focused interventions (introduction of management information systems, international student assessments, improvements in planning, etc.). These interventions are listed as addressing the problem of overall weaknesses in the education system, though it may be more appropriate to view this as a root cause to one or more of the other core problems listed in the first column and described in Table 1, Section II.A. The aim of these interventions is to create a more efficient education system, which could occur through cost savings that would make possible an increase in overall investments in needed education interventions, in using data to support a better allocation of limited resources where greater outcomes can be realized, etc. In many cases, the improvements would result in the provision of more education inputs like those listed under the column of example interventions (inputs/outputs).
Figure 1: High-Level/General Project Logic for an Education or Training Program

III. ECONOMIC ANALYSIS OF EDUCATION AND TRAINING INTERVENTIONS
Cost benefit analysis (CBA), sometimes referred to as benefit-cost analysis, is a type of economic analysis that is conducted to determine if an investment is socially efficient, and with the purpose of being used to inform decision making. The overarching methodology is straightforward, but notable challenges exist in the exercise of estimating costs and benefits, and bringing all the necessary elements together to determine the resulting key metrics of interest. Before getting into the details of CBA for education and training interventions, this section’s introduction serves to summarize foundational aspects of CBA to support its application to the sector. 33
There are several types of analysis that aim to consider the use of scarce resources, and the opportunity cost of investing in a particular intervention. A brief description follows to frame the role of CBA and its linkages to related types of analysis, but the comparative strengths and weaknesses of each type is not elaborated here. To start, an initial step in project design is often to complete a cost-feasibility analysis to compare an intervention’s initial cost estimates against the available budget envelope (typically a range). This will support a project team in focusing their intervention design efforts – i.e., develop a project logic and potentially conduct a CBA– on the set of feasible alternatives. The cost analysis carried out as part of this exercise can also inform initial versions of a project’s CBA and cost-effectiveness analysis (CEA). As noted earlier, CEA is a related type of analysis that estimates the cost of obtaining an educational result that is quantified (e.g., learning, or graduation rates), but not monetized.
Both CBA and CEA are used ex ante to inform project design and decision making, but can also be done during implementation, and after project completion. These two types of analysis rely on relevant literature to determine an appropriate ex ante effectiveness estimate for an intervention and both could update the ex post value based on results from a specific intervention’s evaluation. However, the CBA would not stop there as its overall goal is to determine whether the project was a socially efficient use of funding. Therefore, the metrics reported from these analyses provide distinct information that can be brought together to tell a more complete story about the expected results of an investment. At MCC, the focus has been on cost-feasibility, CBA, and independent project evaluations, but not on CEA. While these and other types of analysis can work together, it is important to understand and capture the strengths, weaknesses, and limitations of each when using them to inform decision making.
What do we mean by the phrase ‘socially efficient’? Simply, that the costs of a given intervention are justified by the benefits generated. The question then arises, benefits for whom? As discussed earlier in the paper, understanding the population of interest is an important first step in appropriately framing the perspective of the analysis. This effort determines who has ‘standing’ within the CBA model, and this should be explicitly stated and justified. As CBA seeks to support decisions that maximize overall social welfare, the default in CBA is to consider society overall as the perspective of interest. For MCC’s analysis, society overall refers to the population of the county; benefits outside of the country, if there are any, are normally not included. Therefore, the metrics from CBA represent an analysis that has considered the full social costs and social benefits of an intervention to the country. Even when this is the case, it is useful to examine costs and benefits at the level of private individuals – both project participants and the general public, 34 government, and then aggregated for the society overall. Furthermore, this work helps to inform the selection of groups for which to examine their costs and benefits separately to better understand the proposed project’s distributional impacts—e.g., the impacts by household income, gender, regions, etc.
When conducting a CBA, the analyst should take an organized approach to ensure all key steps are completed. This SCDP highlights 5 somewhat simplified steps to guide the discussion that follows.
- Develop a program logic that outlines the problem an intervention aims to address, and the relationship between the intervention’s intended inputs, outputs, and outcomes to achieve the stated objective of the investment. This was the focus of the previous section of the paper.
- Develop an economic logic to underpin the CBA model, ensuring this reflects the program’s logic . In simple terms, the economic logic is a summary of the CBA model’s framework. An economic logic uses a well-defined counterfactual to capture the program logic’s outputs and outcomes as the CBA model’s intended benefit streams, with note on how these change across time – considering when benefits may begin to fade out, length that they will persist, etc. It aims to summarize the key decisions within the CBA model’s framework by acknowledging who has standing, the counterfactual, time horizon, discount rate, and notable assumptions and risks that could influence the project in meeting its objective and that cause uncertainty in the CBA results. While costs are not depicted in the program logic, the economic logic would typically outline the key cost categories required to obtain the intended benefit streams. Therefore, while the program logic and economic logic should not contradict one another, they serve different roles in the project design process. At MCC, CBA should be conducted at the lowest possible level of disaggregation, in accordance with the program logic, and when it is feasible and cost effective (for MCC), considering when project components may make sense to group together based on their level of complementarity or joint necessity – another aspect of the economic logic to highlight.
- Identify, quantify, and monetize all project-related social benefits, adjusting to reflect estimates as present values . In these steps, the analysis moves beyond the outcomes listed in the program logic to define them as potential benefit streams, determining how to measure and monetize (if possible) them for inclusion in the CBA model.
- Identify, quantify, and monetize all project-related social costs, adjusting to reflect estimates as present values . All costs required to obtain the intended benefit streams would be included in the CBA model, regardless of who provides the funding, and following the same expected time horizon laid out in the economic logic.
- Calculate metrics that summarize the results of the CBA, conduct sensitivity analysis to test the robustness of the results, and carry out distributional analysis to inform decision making . The key statistic summarizing the benefits relative to costs of an intervention over the project lifetime is the economic rate of return (ERR), use of which enables comparison of different projects as well as with the ‘hurdle rate’ or MCC’s required 10% ERR threshold. 35 Sensitivity analysis captures the robustness of this result to uncertainty about key parameter assumptions, while distributional analysis moves beyond the economy-wide or aggregate result to assess how benefits are distributed across different groups in the population (capturing among other outcomes the potential for poverty reduction impacts).
With these general steps to conducting a CBA in mind, the paper shifts to focus on the application of the methodology for education and training projects, with a particular emphasis on the MCC experience. To simplify the remainder of the paper, the focus is on three main interventions that have comprised the bulk of MCC funding in education and training, the first two are specific to general education and the last to TVET, which encompasses a wide range of investments: (1) School Infrastructure; (2) Teacher Training and (3) TVET. While this appears to omit many other types of interventions mentioned in the previous section, there are broader insights provided through the three examples. And, even with this narrowed focus, it will not be possible to go into significant detail on all aspects of CBA covered in this section. The aim will be to incorporate additional intervention examples as well as references to specific CBA models that are forthcoming on MCC’s external website in a future version of the guidance – as outlined in the final component of this section.
Section III.A provides a brief description of key elements within the economic logic and therefore the typical framework of CBA models in education and training. Section III.B focusses on the work of identifying, quantifying and monetizing benefit streams. The following Section III.C outlines the main cost considerations to ensure that inclusion of all social costs required to achieve the previously outlined benefits. Section III.D brings together the work of the previous sub-sections (i.e., framework, benefits, and costs) to determine the CBA results, with consideration of sensitivity analysis that can help to inform the CBA metrics reported, and distributional analysis that can highlight results by important project beneficiary groups. Finally, Section III.E concludes by summarizing the thematic areas that MCC can expand upon in future versions of the SCDP in education and training.
A. Economic Logic and CBA Framework of Education and Training Projects
Building off the program logic, the analyst is responsible for taking an economic lens to determine how the paths to reaching intended outcomes will be represented as costs and benefit streams within the CBA model. The overarching work to develop the CBA framework is the focus of this subsection, which is organized around defining and discussing the important considerations for 3 key elements: counterfactual, time horizon, and discount rate. This supports framing the later discussions on benefits and costs (Section III. A and B, respectively), which are also part of the economic logic, and bringing all these components together to report on the CBA results.
Counterfactual
A critical step to CBA is to define an appropriate and justifiable counterfactual: what would have happened in the absence of such an investment. Both project costs and benefits are measuring against the counterfactual, which is not static – that is, it requires consideration of changes across time. Often, the counterfactual may be thought of as comparing the MCC-supported investment scenario to a “business as usual” scenario, where the items or inputs provided under the project would not otherwise be provided. Defining the counterfactual requires the analyst to have a strong understanding of the context for the country, sector, general trends, market or government failures, existing or planned efforts to resolve the problem at hand, etc. Helping with this is the fact that much is learned during the CA and RCA phases of compact development, as well as through partnerships with our country counterparts and key stakeholders. In fact, MCC’s model facilitates collaboration across team members with technical expertise in certain sectors, countries, and methodological areas to ensure that the analyst is making informed decisions throughout the CBA process.
For projects in education and training, useful information could include that on demographics, years of schooling completed, annual rates of schooling (i.e., enrollment, promotion, repetition, and dropout), literacy rates, results of national, regional, or international exams, labor force statistics, and spending on education. As programs are defined more narrowly, the data obtained will also need to become more specific to the intervention. The analyst would begin by examining indicators at a national level and then, where possible or applicable, disaggregate by relevant groups such as geographic region (e.g., state/county, urban/rural), household income (e.g., quartiles or quintiles), male/female, age groups, ethnicities, native language, etc. or even by different levels of education. The time component is also important to consider. With respect to establishing trends, the analyst seeks to obtain the most recent data available, as well as any historical data, and hold discussions with informed stakeholders to understand future investment planning that could impact indicators of interest. It should be clear, but worth saying, that the data quality should also be assessed as the analyst defines the counterfactual.
Table 3 below outlines potential types of data that can be used to inform the counterfactual for education and training interventions. In most cases, this is also helpful for defining the with-project scenario, as it supports reasonable expectations of benefits based on the current situation and trends. This Table intends to provide a sense for how data could be used but does not capture the complexity of defining a specific intervention’s counterfactual. As noted above, the counterfactual is the basis for measuring both the benefits and costs, so further considerations for defining an appropriate counterfactual will be discussed in the next two subsections (Section III.B and III.C), particularly through the three example interventions provided when discussing benefits.
Table 3: Data for Defining Counterfactuals for Education and Training Interventions
| Indicators | Description of Indicators | Potential Uses for Defining a Counterfactual |
|---|---|---|
| Birth rates, fertility rates, life expectancy, mortality, migration patterns, population, etc. | ||
| Average years of schooling, or annual completion rates | ||
| Enrollment, promotion, repetition, graduation, and dropout rates provided on an annual basis reported by grades and education levels | ||
| Percent of population aged 15 years and older who can read and write; Examining by age provides a sense for how obtaining literacy skills has changed across time. | ||
| Results of standardized math and language exams (national, regional, or international assessments); Results of focused subject matter exams | ||
| Labor force participation, employment, and unemployment rates; Composition of workers across economic sectors or fields of studies; wages and salaries | ||
| Total education spending in terms of percent of GDP, percent of total government spending, and total values in real terms, allocation of funding within education – at point in time and across time |
The description above has given a sense for the complexity in defining and justifying a counterfactual, particularly given that we cannot see into the future and data is often limited in availability and quality. As such, it is important to document counterfactual-related decisions for transparency. This can also support future updates to the existing counterfactual or applying lessons learned from that experience to improve defining counterfactuals for similar projects in the future. The subsections that follow will incorporate counterfactual considerations when discussing the benefits and costs.
Time Horizon
Another key aspect of the CBA framework is to determine the appropriate time horizon. The default time horizon for MCC investments is 20 years, after the investment is completed and the output is ready for use. For example, the clock would begin after a school is built and teachers can begin instructing students there, and the school building would have a 20-year life expectancy, if properly maintained. Regardless of the time horizon chosen, the decision should be informed by expectations of the investment’s sustainability, considering the likelihood that it is properly maintained, the projected time from investment completion to when benefits begin to be realized, and how those benefits are anticipated to behave across time (e.g., Will they decrease after a certain period? Will they tend towards zero or what other steady state value?), incorporating any associated costs required to reach the included benefits.
MCC has generally adopted the default time horizon for education and training investments, but with one important caveat: CBA models include all student cohorts that would complete their education or training within those 20 years (e.g., during the expected life of a newly built school), 38 but it also follows each of those cohorts for at least 20 years after their training is completed. Therefore, the total years included within an education and training CBA model will typically appear as a total of 40 years. This practice has been adopted to more accurately capture the long-term benefits associated with the provision of education and realized during an individual’s working lifetime. While theory and empirical evidence suggest that this concept is generally agreed upon, the length and strength of these benefits across time can vary significantly by intervention, so these assumptions should be adjusted based on available literature.
As mentioned above, the analyst has flexibility to adjust the time horizon based on the specific investment. There are two noteworthy considerations for education and training projects. First, on the topic just discussed, is the determination of how long one should track each cohort. An analyst could make a reasonable argument to extend the tracking of cohorts from 20 years, even up to the number of years until the student cohort reaches retirement age. This would capture the benefit streams for their entire working lifetime. Analysts can make this decision for the CBA model or incorporate this within their sensitivity analysis. However, following each cohort for 20 years has been selected for simplicity, remaining close to the default at MCC, and because benefits far into the future will be more heavily discounted and, therefore, less likely to impact the results of the CBA.
The second consideration for time horizon adjustments is for typically considered for infrastructure investments, but applies to other interventions as well, such as teacher training. When the likelihood of investment maintenance appears to be low, the analyst could adjust the CBA model in a few different ways (which are not mutually exclusive): (1) use a time horizon of less than 20 years, say 10 years as an example; (2) keep the time horizon at 20 years but incorporate a reduction in benefits for cohorts that enter past year 10 (as an example), due to the deterioration of the asset and therefore the resulting benefits; or (3) keep the time horizon at 20 years but use the other two scenarios in the sensitivity analysis to demonstrate the potential differences in efficiency under such circumstances. Consultations with MCC infrastructure experts and local building engineers can help determine the appropriate assumptions regarding likely maintenance behavior and asset life under different scenarios.
Discount Rate 39
Another decision closely related to time horizon is the selection of an appropriate discount rate. This rate, similar to a weight, is applied to all costs and benefits to put them into equal terms across time, allowing for aggregation to estimate the present value of net benefits. The discount rate, as the name implies, assigns a lower weight to costs and benefits occurring further in the future. There are two rationales for using a discount rate: (1) to reflect the opportunity cost of investment resources on a given project rather than investing them elsewhere (the cost of capital perspective) and (2) to reflect the time preference of individuals (or society in general) to consume today rather than wait to consume in the future, resulting in a reduction in the value of consumption the further it occurs in the future.
While the use of discounting is uncontested among cost-benefit analysis practitioners, there continues to be debate on the specific discount rate to apply when assessing a project’s efficiency. In practice, discount rates have ranged between the range of 0% - 12% are often cited as being appropriate for CBA of projects in general, with lower average rates of around 3% often used for social investments in education and health, particularly in the United States, and there has been a general trend, across countries, to revise rates downward to a range of 3% - 7%, on average or for use in sensitivity analysis. 40 MCC’s focus on the ERR as the main CBA metric of interest to inform decision making avoids a heavy reliance on discount rate selection, as compared to those that rely on the NPV. At the same time, the current use of the 10% ERR as a threshold to inform decision making, implies the use of a constant discount rate across projects of all sizes, sectors, countries, etc. The agency has reviewed this aspect of the CBA framework against the latest research and evidence and continues to monitor the situation to inform their future discounting practices.
As discussed, discounting places a higher value on nearer term benefits, and is typically a constant ratio from year to year. The use of a higher rate, like the implicit 10% used at MCC, would (mathematically) require projects with significantly delayed (long-term) benefits to produce far greater total benefits than projects with more near-term benefits. If these results strongly influence initial decision making, then this could have important consequences for investments in education and training. Early childhood education, primary school, and perhaps even lower secondary school level education and training could have large long-term benefits, but these occur well after an initial investment so they will be heavily discounted. As an example, the intervention may occur when a child is 5 years old, while the bulk of the benefits may not be realized until 15 years later when they enter the labor market, and other benefits that happen earlier may be difficult to quantify or monetize. On the other hand, TVET investments may be focused on older youth and adults, with shorter education and training programs that can provide benefits more quickly, and therefore such investments may be perceived as more favorable, all else equal. Additionally, benefits that will occur sooner after an investment is completed are more likely to be realized than those that are expected far in the future, due to the potential for confounding or external factors to play a role in disturbing the anticipated benefit stream trajectory. Therefore, the risks to achieving benefits from the shorter-term investments may seem more enticing for those reasons as well. For such reasons, MCC has designed its investment criteria to include other important aspects that align with Agency priorities – e.g., gender and social inclusion, climate change, poverty reduction.
B. Benefits
This subsection aims to outline the work to identify, quantify and monetize potential benefit streams for inclusion within the CBA of an education and training project. The narrative highlights challenges associated with each step of the process and seeks to provide useful practices to support the development of a comprehensive, evidence-based CBA model. After introducing the key elements of the work to identify, quantify, and monetize benefit streams, three investment examples, drawing heavily from MCC experience, are provided to speak about these concepts and the counterfactual in more concrete terms. The illustrative interventions will include two for general education – school construction and teacher training, and TVET overall but with a focus on employer-driven programs.
The analyst should begin with an open mind, considering the world of potential benefit streams tied to the intervention’s design, the intended outcomes outlined in the program logic, and even those that may be unintended (externalities). This exercise can be facilitated by specifying the groups of individuals that could be directly or indirectly affected by the intervention, ensuring that their perspectives are considered. Insights can also be acquired thorough conversations with sector experts and a review of relevant literature to improve the analyst’s understanding of the core theoretical relationships along the logic chain and obtain empirical evidence on the results of similar projects. Some of this work may already have been carried out as part of the efforts to develop the project logic, but it is likely that full attention was not given to the economic factors needed to inform the CBA.
The high-level, general program logic introduced in Section II.C depicts the logic chain from problems to interventions to outcomes. Figure 2 pulls information from that image to focus on the three main medium-term outcomes that have typically become benefit streams in MCC CBA models, when they are expected as a result of the particular intervention. If these medium-term outcomes were realized, then one would expect the longer-term, labor-related outcomes to follow, defined as both improved employment – higher rates of employment and of the quality of the employment – and higher wages/salaries. Within the CBA model, all these outcomes are measured relative to a well-defined counterfactual. 41 The three medium-term outcomes and the longer-term outcome of improved employment would need to be quantified before being monetized, so they will be covered in the quantify subsection that follows. As wages are already in monetary terms, this will be defined further in the monetization subsection , along with discussing how to monetize the potential benefits quantified within the subsection that precedes it.
Figure 2: Converting Project Logic Outcomes into Benefit Streams

As noted, a major benefit in both the theoretical and empirical literature is that additional years, better quality, and/or more relevant education and training would lead to higher earnings, on average. However, there are other positive impacts to education and training projects that should be considered, and if relevant and feasible, included in the CBA. In the early stages of the CBA process the list of potential benefits should remain broad regardless of whether they naturally lend themselves to being quantified and/or monetized. This ensures acknowledgement of a wide range of potential benefits that will be assessed in the following steps to determine whether evidence exists to justify their inclusion in the final CBA model. If not, then the best that an analyst can do is to explicitly state the expected benefits that could not be incorporated.
A few examples of non-earnings based potential benefit streams:
- An education or training intervention that targets at-risk youth could reduce their participation in crime, with associate reductions in social costs.
- School rehabilitation to replace woodstoves with central heating in schools located in colder climates could improve the air quality, resulting in respiratory health benefits for students and staff.
- Programs focused on increasing girls’ overall access to education could change their life trajectories, e.g., by delaying marriage and childbearing, and increasing their likelihood to enter the labor market. If these women become mothers, then they would be more educated and there could be intergenerational benefits associated with the improved nutrition and schooling outcomes for their children.
The analyst should review the range of potential benefits to ensure that their inclusion in the CBA model would not result in double counting or incorporate transfers. With regard to double counting , before adding all the benefits together, the analyst must make sure that all benefits are separate from one another, and any overlaps are identified and removed. Overlap can happen in practice when the analyst follows the project logic too closely, attempting to capture every element, so that an earlier outcome and later outcome may appear as separate steps along the logic chain, but for the purposes of the CBA, the later outcome would capture both elements. Including both outcomes in the CBA model as separate benefit streams would result in double counting, i.e., overstating the true benefits. 42 Regarding transfers , these are items that would be a cost to one part of society and a benefit to another, such that the net impact is zero. A common example given is tax revenue, which is a cost to the individual but an equivalent benefit to the government. All transfers should be identified and not included in the CBA model, as either costs or benefits.
Using the identified list of potential benefit streams (including externalities), the next step in the process is to determine which aspects can be measured in quantitative terms. In the face of limited time and resources, the analyst must strategize how to focus efforts to quantify and monetize the list of potential benefits. This can often involve prioritizing the largest anticipated benefit streams, and potentially those most valued by the decision makers. When making the decision of where to focus efforts, recall that for education and workforce development projects many important benefit streams are realized farther in the future and, despite discounting, these may remain the largest benefits to an intervention.
During this process there are likely to be three categories of potential benefits: (1) those that can be removed from further consideration relatively quickly, given that they may be intangible, difficult to quantify, or are associated with a well-known gap in the evidence literature; (2) those that could be measured, but the evidence seems sparse or of questionable quality; and (3) those that are typically measured and, as such, there is strong evidence to draw upon, even if there are uncertainties in how to apply it to the specific intervention’s context. For those that are eliminated from further consideration, the recommendation under double counting was to note these explicitly with supporting documentation used to inform decision making. This practice is particularly important for sectors or types of projects that theoretically have notable benefits (e.g., policy and institutional reforms), but for which the empirical evidence does not exist, or the details of the project are limited such that the analyst cannot produce a reliable estimate, or even a range that can be used for sensitivity analysis. Some potential benefits may be quantifiable but are removed later when it becomes apparent that they cannot be monetized, as will be discussed after the quantification of benefit streams.
The remainder of this subsection examines each one of the three medium-term benefits and the longer-term improved employment outcome separately – those introduced in the identify subsection . The description of each outcome begins with examples of interventions that are often expected to achieve that outcome, an explanation of how to measure the outcome, including potential data sources, and insights on how to use the available data within the CBA model. As noted throughout the paper, the analyst must use the project’s design and the counterfactual in the given context to further define and justify the parameter decisions for inclusion in the CBA model. The example interventions included after the monetization subsection will draw upon specific literature and provide insights on plausible parameter estimates to quantify the benefits.
Quantifying Quantity of Schooling Increases (Medium-term Outcome)
Change in the quantity of schooling is the first of the three medium-term outcomes to explore as a potential benefit stream. Gains in years of schooling or additional levels of schooling are most often associated with building new learning centers that are closer to students, often offering a new level of education or fields of training that were previously unavailable or the new learning center reduces the total costs incurred by individuals to reach similar, existing facilities. 43 On the demand-side for education, interventions that provide scholarships, stipends, transportation, or even food rations for attending local schools could be sufficient to offset opportunity costs that families experience when their children attend school. These types of interventions, and perhaps information campaigns in communities to promote the value of education, could result in higher enrollment rates, lower dropout rates, and potentially higher completion or graduation rates.
When interventions, like those mentioned above, are targeted to impact certain groups such as low-income or rural areas, or to increase the participation of at-risk youth or women, there could be greater impacts in reducing poverty and/or inequality. This summary has not provided an exhaustive list of interventions that could result in additional years of schooling, but it gives a sense for when this benefit stream may be a reasonable expectation. The determination of whether the expected change is a year or years of additional schooling, or a higher completed school level, will depend on the design of the intervention. This is important to clarify as this would impact the quantification and monetization of this potential benefit stream, which will be discussed more below.
Regarding data on these outcomes, years of schooling can most easily be measured by examining school administrative data contained in a country’s educational management and information system (EMIS). national governments often support schools in collecting annual information on the number of students that enroll, dropout, repeat, complete, graduate, and are promoted. Together, this information can indicate students’ or cohorts’ status within the general education school system, and tracking across multiple years can inform trends in obtaining additional years and levels of education.
As many low-income countries do not have EMIS or their existing EMIS are limited by the availability or quality of the data to reflect the reality throughout the country, other sources of data may be required to obtain indicators related to years of schooling. 44 Even when EMIS data exist, a country may not assign a unique identifier to students, meaning that they cannot be tracked through the system to learn about educational pathways, particularly when students move from one school to another. Due to these challenges, MCC has in some countries collected information related to quantity of education through independent project evaluations. This would be based on an evaluation design focused on learning about the outcomes specific to the target population, and the comparison group (if relevant). Depending on the strategy, this could involve data collection at multiple points in time to inform the related baseline, midline, and/or the endline study.
While EMIS would provide data on general education, other sources would be required to inform the CBA of interventions in preschool, TVET, or higher/tertiary education. For TVET, individual centers or national coordination across centers may operate to develop tracer systems that would similarly track students that enroll, dropout, and graduate from TVET programs. Typically, these systems also include data on trainees collected shortly after their training is completed to better understand their labor market outcomes – a key component that is missing from general education EMIS datasets but may be picked up in national household surveys, another data source to consider. There will be differences by country on the systems available to obtain comprehensive data on preschool and higher education, so the analyst may need to work with education providers to compile similar data.
As mentioned just above, insights on years of schooling can also be drawn from representative national surveys, typically labor force surveys or household surveys (e.g., using LSMS – living standards measurement study methodology). Their related data collection tools would ask all individuals within a household their age, whether they are currently enrolled in school, the year/level of study that is ongoing or the highest year/level that they have completed, and perhaps why they stopped their education. While many surveys ask respondents for both the years of schooling completed and the highest level, others record only the level. If only level data are available, this would limit the analysis that can be done for the CBA model. Additionally, while the administrative education data would provide indicators for a census of students in a given year and across years, a national survey would typically be conducted at most only every five years, limiting the ability to measure trends. The design and sample size may also not may not be such as to generate representative data in rural regions or for specific groups which may be the focus of the intervention.
With these data sources in mind, how is the information used for the CBA? Essentially, for the counterfactual, information on levels and trends in the outcomes from the sources just noted are used to estimate the trajectories of these outcomes under the without-project scenario. This data can be supplemented with discussions with local experts, who can give insights into existing and forward-looking plans for programming and funding, which will help sharpen the counterfactual estimate. For example, information about major current or planned initiatives of the government in education may imply that future levels or trends in say, secondary enrollment, will diverge from past patterns, so that the counterfactual needs to be adjusted. Examining EMIS and tracer system data during compact implementation and, more notably, after compact closure can support updates to the counterfactual and the expected results for the with and without project scenarios, particularly when a strong comparison group has been established through the evaluation strategy.
There remains, of course, the need to estimate ex ante the with-project parameter estimates for the CBA: how will levels or trends in the outcomes change with the project? For this, the analyst must turn to literature relevant to the specific intervention’s design and the country context. Below, the subsection ‘In Practice: School Construction’ provides a concrete example by outlining and pulling together the concepts of the counterfactual, identifying, quantifying, and monetizing benefit streams, where the main benefit stream is expected to occur through additional years of schooling.
Quantifying Quality of Schooling Improvements (Medium-Term Outcome)
The second potential benefit stream highlighted within the document occurs through an improvement in the quality of schooling that students receive, or put another way, a change such that students learn more, on average, in the same number of years or when completing the same level of education or training. These benefits are often anticipated to result directly from interventions that develop or update school or TVET program curricula. This may involve bringing them up to a certain standard associated with becoming accredited or meeting an international certification, particularly in the case of TVET or higher education. Curriculum improvement interventions are often coupled with efforts to provide new or improved instructional materials, school supplies, and/or technical equipment (e.g., computers, white boards), as well as training of educators and school administrators in how to teach the new/revised curriculum. While combining interventions in this way could lead to greater quality improvements or even be necessary for any impact, in other contexts it could be effective to provide standalone interventions.
It is also worth mentioning more indirect interventions that could improve the quality of education. Scholarships and stipends could mean that students do not have to work while in school, leading to more hours dedicated to their studies or less school absence, or the funding could provide opportunities to attend higher quality schools. There are also types of health and nutrition interventions at the household or community level to improve early childhood development, leading to improved student learning outcomes. Of particular relevance to education are projects that reduce the prevalence of stunting, which can result in lifetime benefits associated with the significant gains in an individual’s cognitive abilities. Finally, there are PIR interventions that can improve quality or learning in a variety of ways. These may include changes in incentives and human resource policies that induce more effort from teachers or allow them to work more effectively (including class size reduction); changes in the overall efficiency in the education system such that there is more funding available to invest in quality improvement interventions; or the building of EMIS or the implementation of national assessments to obtain more information for decision making about the allocation of education resources. As with the years of schooling description, this summary has not provided an exhaustive list of all possible projects to improve the quality of education and training but should give the reader a better sense for potential interventions that could lead to this medium-term outcome.
How are quality improvements in education measured? Quality is assumed to impact learning outcomes, and these are typically measured through the results of standardized tests or other means to assess students on changes in knowledge and its application, as it relates to the level of education and the specific school subject. Exam results are typically converted to a standardized score that can facilitate comparing scores across individuals and even time, as relevant, speaking in terms of standard deviation (SD) improvements. As with the quantity of schooling, current levels or trends in these measures can be used to generate the counterfactual for learning outcomes, and relevant impact evaluation literature, can inform expected outcomes under the with-project scenario. Improvements in learning outcomes can differ greatly by interventions and even the education level of the same type of intervention, so caution must be taken when using studies to inform CBA parameter estimates. Below, the subsection ‘In Practice: Teacher Training’ provides a concrete example by illustrating the concepts of the counterfactual, identifying, quantifying, and monetizing benefit streams, where the main benefit stream is expected to occur through improved learning outcomes, leading ultimately to improved labor market outcomes.
It can be helpful to provide an example project that includes two activities that work together to the same outcome, say quality as measured by standardized tests (in standard deviations, SD). The literature may suggest that the new textbooks/didactic learning materials/computer-assisted learning being planned for the project could reasonably be expected to produce an impact of 0.2 SD improvements in test scores. This would be an excellent outcome. Say the project also includes a teacher training activity, for which the literature on interventions similar to that being designed suggests that a well-implemented project could also result in a 0.2 SD improvement in test scores. The analyst may be inclined to add the two SDs together and say that the project overall could lead to a total 0.4 SD, but it is not that simple. Few studies have found such a large impact from any intervention or coupling of interventions, suggesting that there is an upper limit—or at least, diminishing marginal returns—to combined interventions. This suggests the need to be conservative when assigning benefits in such cases to ensure the expectations accord reasonably with prior experience. Sensitivity analysis should also be deployed to provide more clarity on how the net benefits and ERRs would change based on movement in this critical outcome variable.
Quantifying Labor Market Relevance (Medium-Term Outcome)
The third main benefit stream is an improvement in the labor market relevance of the education and skills obtained – that is, greater alignment between skills obtained and those demanded by employers. As discussed earlier, this is a focus of TVET programs and higher education but is also obviously a key objective of general education in broader terms. A range of education and training program components are designed to ensure the provision of labor market relevant knowledge and skills and in the case of TVET, generally involve links with employers or the labor market. MCC’s most recent TVET investments include employer participation in various ways such as developing curriculum, having professionals serve as trainers, and supporting the requirement for trainees to obtain direct workplace experience (e.g., via internships) as a complement to classroom instruction. Some centers have also sought to develop programs that will offer occupational certifications that can be recognized nationally, regionally, and even internationally. At the system level, countries may also engage in initiatives to develop or improve upon a national labor observatory or labor market information system to inform the education path choices of students, and the program offerings of education and training centers.
Measuring ‘relevance’ of an individual’s education or training is not as straightforward as measuring the other medium-term outcomes, ‘quantity’ or ‘quality’, for which we have indicators such as years or levels of schooling or scores on standardized tests. Instead, relevance has to be defined with respect to something—namely, the needs of the labor market. If, through the constraints analysis or employer interviews or surveys, skills needs can be clearly identified then one could say (with a bit of circularity) that graduates of a program that provides those specific skills have ‘relevant’ skills. The increase in the outcome ‘relevance’ would be measured by the number of individuals obtaining the skills (and perhaps, being certified in them using international standards) and obtaining employment in their fields of study, relative to the counterfactual. The latter measure of employment is, together with earnings, the long term outcome defined above, so essentially TVET CBA focuses directly on the long term benefits : Are graduates obtaining employment—especially in the targeted occupation or industry, if the training has such a focus—and are their earnings higher? 45 This will be discussed directly below in quantifying employment outcomes , and then in monetizing wages, with more concrete programmatic examples included ‘In Practice: TVET’.
Quantifying Employment Outcomes (Longer-term Outcome) 46
The longer-term outcomes are those experienced in the labor market, including employment and earnings. Since ‘earnings’ is the key element of monetization, we leave that to the next section and focus here on employment – the final of the main components to quantify. Impacts on employment outcomes can occur through the three main medium-term outcomes but, as will be described below, literature and practice suggest a stronger connection with quantity increases in schooling and market relevance, than quality of schooling. Before diving into those details, it seems useful to define employment outcomes more completely and how to measure them, including data sources. To start, we review some basic concepts about employment categories that inform how the statistics may be used for the CBA. The three categories are described below to ensure an analyst understands how to appropriately estimate related parameters.
- Labor Force Participation/in the Labor force : All persons of working age who are either employed or unemployed. 47 The labor force participation rate is estimated as the labor force divided by the total working age population.
- Employed : Individuals of working age who are involved in paid employment or self-employment within a specified reference period. The employment rate is the total of employed individuals divided by the number of those in the labor force.
- Unemployed : Individuals of working age who were not in paid employment or self-employment during the reference period, but are currently available to work and seeking work. 48 The unemployment rate is calculated by dividing the total number of unemployed individuals by the number of those in the labor force.
With these high-level labor categories defined, the next step is to clarify what is specifically meant by ‘improved employment outcomes.’ Figure 2 states that beneficiaries experience improved employment outcomes, with a few notations in parentheses: higher labor force participation and employment rates, and more employment in formal sector or with benefits. The first two aspects reference the high-level labor categories introduced above. Higher rates of both labor force participation and employment would indicate that individuals are moving from a non-income earning category to an income-earning category. With respect to the counterfactual scenario, those that would have been outside of the labor force would enter, and those that would have been unemployed or have now entered the labor force would become employed. This would clearly not be a 100% shift, so the analyst would need to determine what percentage would be likely to shift from one group to another due to the intervention. As noted, this shift would have clear monetary gains to capture in the CBA model, as discussed in the subsection that follows.
The other aspects referenced within parentheses under improved employment outcomes in Figure 2 relate to what could be called ‘better quality employment’. There is a desire, particularly by education specialists, to move beyond simply indicating that individuals have entered the labor force or become employed, and further assess the quality of that employment. In many circumstances, the wages/salary an individual receives would reflect the higher quality of the employment. However, as stated earlier in this section, it is important to identify other potential aspects of the benefit stream that may not be captured in the simple estimations typically used. These better-quality aspects may range from more subjective attributes that are difficult to quantify to those that can be both quantified and monetized.
In developing countries, the distinction between formal and informal employment is often used as a rough proxy for considering the quality of employment. Individuals with formal employment would often be provided a contract or position that translates to greater employment stability – assurances against unlawfully being fired, predictable hours, more likely to provide a living wage, and the potential to provide benefits such as paid vacation and sick leave, medical insurance, etc. and potentially more opportunities to learn new skills and progress in a career, as employers seek to invest in their people. While some jobs are inherently riskier than others, the better-quality aspect would translate into being compensated for the tasks, considering the risks involved, and being provided appropriate training and equipment to reduce the risk and severity of negative impacts (e.g., injuries) on employees. There may also be aspects related to psychologically safe working conditions, such as protections against harassment or discrimination. While not all these benefits are guaranteed to those with formal employment, they would be more expected than for those with informal employment. This example of formal employment has sought to provide a sense for the realm of possible benefits related to better quality employment that could be further considered.
With the employment outcomes more clearly defined, we return our attention to the three medium-term outcomes described above —education quantity, quality, and relevance. This subsection proceeds by outlining when an intervention resulting in a certain medium-term outcome is expected to lead to the longer-term employment outcomes, and then shifts to considerations on how to measure to this outcome for the counterfactual and with-project scenarios.
For education quantity , additional years or levels of schooling could lead to an increase in rates of labor force participation and employment but would depend on the country context. While the relationship between years of schooling and earnings is quite clear from the literature, the relationship with employment outcomes is more nuanced. Generally speaking, highly-educated individuals in developing countries often report greater unemployment levels than those with lower education. This is thought to be due primarily to them having greater freedom in choosing whether to participate in the labor force, and then whether to accept a job. That is, greater levels of education tend to be associated with higher socioeconomic status; meaning that highly-educated people are more likely to be able to afford not working than people with lower socioeconomic status – i.e., enjoy a higher reservation wage. The level of education will therefore be important, but also by type of education. General education interventions do not typically include a focus on employment outcomes, so the intention to reach this objective would either need to part of the program logic or would occur only through a transition to a grade/level of education that is associated with higher employment outcomes, on average. In this situation there is no indication that there would be increases in ‘better quality employment’ to consider. TVET is clearly a different case, which will be summarized after discussing the three medium-term outcomes.
The second medium-term outcome is improvements in education and training quality. As discussed below within ‘In Practice: Teacher Training’, the best empirical evidence available demonstrates a clear relationship between education quality, as measured for general education by SD improvements, and increased wages or lifetime earnings (Chetty et al. 2014a and 2014b), but it does not specify a linkage with employment outcomes. While a positive effect on employment outcomes such as obtaining a formal sector job are quite plausible, the lack of direct evidence to support this linkage means that it is often omitted in CBA for these types of investments. Instead, it is more practical to draw on the available evidence to generate expected changes in earnings from quality improvements, which would implicitly incorporate any intermediate steps through employment outcomes.
The final medium-term outcome is increased relevance of the education or training. This is a particular objective of MCC’s demand-driven TVET programs, and here interventions are often directly geared toward specific employment outcomes, namely, obtaining work in a given field or occupation. Additionally, shifts may be expected in graduates obtaining better quality employment as well, but this would depend on the focus of the training centers. For example, if the center aims to support a sector that has high levels of informality, and there is extensive outreach to recruit individuals currently working in informal employment with the aim to train them for formal employment, then additional benefit streams should be considered. This practice has not been fully adopted by MCC but is being explored. TVET will be discussed more fully in the subsection ‘In Practice: TVET’ below.
The next step in the process is to determine the data available and how to measure employment outcomes, both in the with and without project scenarios. For general education interventions that aim to increase the quantity of schooling, national household or labor force survey data provide the most common way of generating expected employment status estimates. A national survey would typically have a module dedicated to understanding each household member’s (typically above the age of 14 or 16) role in the labor market, and this can be linked with the education and demographic or gender data to inform the counterfactual and obtain a sense for expected intervention outcomes for those with different characteristics. For example, if the project is expected to increase years of schooling on average by 3 years, or to improve secondary graduation rates by some percentage, the impacts on labor force participation or employment of a certain type may be obtained from econometric estimates of the determinants of these outcomes, typically using a probit model. The estimates from the model can be used to generate predicted probabilities of the outcome for individuals with the lower and higher levels of schooling or with and without a secondary diploma, controlling for other characteristics. For this analysis, one would need a recent survey and one that has the requisite education categories. While years of schooling are usually recorded sometimes only the highest level attained is recorded; or the surveys will have years of schooling, but not highest level competed. 49
It should also be stressed that these impacts will be both country and gender specific. For example, women typically have lower rates of labor force participation and employment in most low-income countries, which may mean that there are substantial impacts on labor force activity over their lifetime. However, country context is important here. While analysis going back decades (Psacharopoulos and Tzannatos 1989; Klasen 2020) shows a generally positive association of female education and labor force participation, there are many exceptions (see Psacharopoulos and Tzannatos 1989 and Heath and Jayachandran 2018). In countries where there are cultural, discriminatory or even legal barriers to women working, investments that raise female educational attainment may not result in higher rates of labor force participation of women.
As discussed, employment outcomes include both changes broad work status (participating, employed, unemployed) and more nuanced measures of the quality of employment. The quantification of better-quality employment would require additional work, and in some cases these benefits may be minimal if the bulk of the benefits are already captured by wage increases. 50 Household or labor force surveys may include information on job benefits such as health insurance and leave, which in principle can be monetized when the information is available. However, information on factors such as job security, work environment, and prospects for advancement are not typically collected in household surveys (some labor force surveys may do better in this regard), making it difficult to quantify and monetize these more subjective dimensions of employment quality, and therefore complicate efforts to incorporate into CBA. 51 Given these challenges, CBA practice at MCC and elsewhere generally does not consider these kind of job attributes as part of benefits, instead focusing on expected earnings modified by employment probabilities, as described below. But this is clearly not the whole picture, and an important area for future work is to develop approaches to gather information on and monetize a broader range of job outcomes. MCC is actively exploring and trying different techniques to consider inclusion of such benefits in some of our CBA models.
Lastly, for TVET investments, ascertaining the expected change in employment outcomes can be more challenging, primarily because existing survey data may not contain information or adequate sample size on training experience. Or (very likely) what is contained in the data does not correspond to the specific type of training program or level being considered – for either the counterfactual or with-project scenario. Another potential data source is TVET tracer studies. Such studies focus on tracking graduates of specific training centers. A key parameter of interest is referred to as the insertion rate, meaning insertion into the labor market. This can be thought of as a short-term employment rate, as it considers all graduates (akin to the working age population), whether they enter the labor market, and then whether they obtain employment. Data is typically collected within the first 12-18 months after program completion and may include several data collection efforts with a frequency of every 3-6 months. Eventually, the CBA model would shift from talking about insertion rates to employment rates, but evidence remains limited to inform assumptions about how long the employment-related benefits of the training would continue, i.e., whether it truly changes their lifetime earning trajectory. These tracer surveys may also ask questions to understand if graduates obtain better quality employment, whether they are working in the field of their studies, and their wages. The extent of the survey will determine the ease in capturing the expected total benefits to TVET graduates. Information for existing centers, and their past performance, could be useful to serve as the counterfactual, while evidence on intervention outcomes could potentially come from other country experiences. More discussion of the TVET case is provided below under ‘In Practice: TVET.
With potential benefit streams quantified, the next step in the process is to put them into income terms – i.e., to monetize them. As shown in the project logic of the previous section, an increase in wages is seen as a principal long-term outcome resulting from the three highlighted medium-term outcomes: additional years of schooling, improved quality in the education received, and greater relevance of skills obtained. The overall benefits for earnings and income will also work through changes in the other longer-term outcome, employment: most simply, a higher probability of gaining employment means higher expected overall income. This subsection focuses on methods for estimating wage benefits, which are clearly already monetized, and then briefly notes approaches to estimate shadow prices for other potential benefit streams that have been quantified but do not have a clear market value that can be easily assigned to the outcome of interest. 52
As described in the introduction of this document, an overall aim of education investments is to increase future earnings. One of the most robust associations in research on economic development is that between earnings and level of education, bearing out the prediction from human capital theory that more educated people are, on average, more productive and therefore have higher incomes. Across countries research has shown a global average of private (individual) returns to an additional year of schooling to be about 9 percent – a result that has remained stable across decades (Psacharopoulos and Patrinos, 2018). This is motiving, but clearly remains at a higher-level than what can be used for estimating the benefits of a particular education or training intervention.
For the purposes of the CBA, the analyst must develop a lifetime earnings profile for intervention participants in the with and without project scenarios. This typically starts with estimating the effect of changes in schooling on annual (or some other unit) earnings using nationally representative household or labor force survey. With such data in hand, the most widely used analysis is to employ the Mincer earnings function to estimate the returns to a particular year or level of schooling. 53
The most simple model takes the following form: ln ( y i )= rS i + β 2 X i + β 3 X i 2 + μ 1,i , where ln( y ) is the is the natural log of monthly income from labor earnings (e.g., salary and wages), S is a variable for years of schooling, r is the returns to schooling, X is potential work experience, equal to Age – Education – 5, 54 and μ 1 is the error term. When graphed with age on the x-axis and income on the y-axis, this depicts an upward-sloping and concave curve to represent the age-earning profile. This trend makes sense as there is more potential to increase earnings in youth, but the rate of growth in earnings would slow down over time, as one gets older.
This human capital model is simplified, but a useful starting point. Annex III provides a table that includes several Mincer regression specifications that the analyst can explore to inform the decision on the specific parameters to estimate for a CBA model. This analysis should be done alongside examining the labor market outcomes (discussed just above) and examining wage increases found in similar interventions that have conducted rigorous evaluations. Together, these sources of information can help determine the base case value for the main CBA model, and then the ranges or alternative with project scenarios to consider.
The estimates from Mincer earnings functions will provide a snapshot of the situation at a given time, but the CBA requires the development of an individual’s lifetime earning profile. For this, it could be helpful to simply look at the distribution of wages and employment probabilities by age groups and levels of education to better understand how these may shift across time, and see the current experience of recent graduates with limited experience – the most relevant group for a general education intervention and many TVET interventions. If possible, examining various data points across time could indicate how a certain ‘cohort’ in society is tracking across time. However, in many developing countries the education and career pathways expected now are not the same that were expected, or even possible, say 20 years ago, due to improvements in infrastructure, presence or resolution of conflict, improvements in economic inclusion for women or minorities, and other factors. These possibilities should be considered when developing both the counterfactual and with-the-intervention estimates. One exercise used in Georgia II was to estimate the average increases in real wages across time using national data available. These estimates were used to project future expected wage increases that were incorporated into the with and without project scenarios of the CBA model.
These recommendations have been general to education, but there are notable challenges for estimating wage benefits from TVET. One is sample size. Household and labor force surveys in many developing countries have few observations for those that have completed any level of TVET. This is likely due to the general lack of existing programs and/or their popularity for those that meet the education prerequisites. This is further complicated by the fact that there is great variation in TVET levels of certification, making it necessary to disaggregate further. For example, for the purposes of estimating earnings impacts, it would not be appropriate to combine individuals who completed post-lower secondary TVET training and those who have attained the highest level of technical training and are qualified to serve as a senior technician or engineer. The sample sizes are typically too small when examining by diploma level obtained to even use for informing sensitivity analysis. This is true for both earnings and employment data. In addition, the quality of training obtained by individuals in the survey may be below that expected for the proposed TVET program, which may be designed precisely to remedy shortcomings in existing programs. For these reasons, as elaborated below in the section on TVET, the analyst usually must rely on other data sources, such as tracer studies, rigorous evaluations, or focused employer surveys.
With the basics of estimating wages discussed, we return to the three medium-term outcomes to determine what this may mean for a particular type of intervention. This work is most straightforward for interventions directed at the first medium-term outcome, an increase in the years or level of schooling. Imagine that a given intervention would build new schools to facilitate transition from lower secondary school (middle school) to upper secondary school (high school) in an area with currently limited access to the higher level of schooling, and provide complementary activities to support that transition. For the percentage of students that would be expected to continue onto and complete upper secondary schooling (this would need to be determined above in the quantifying process), the lifetime incremental gains in earnings from the expected increase in educational attainment could be derived in straightforward fashion using Mincer regressions and the approach just described.
The second medium-term outcome is an increase in student learning from an intervention that would improve the quality of schooling for a given year. The literature remains much more limited on the relationship between learning (measured by test scores) and wages. This may be in part because improvements in test scores are also associated with additional years of schooling, so it may be difficult to disentangle the two. Regardless, several researchers have attempted to estimate the returns in the labor market to these learning improvements. Earlier MCC CBA models based the value of this parameter on the findings from the Hanushek (2010) paper. 55 This is still considered one of the strongest papers on the topic, but two new companion papers by Chetty et al. (2014a and 2014b) also employ rigorous methodologies and micro data to estimate the relationship of earnings to test performance. Bacher-Hicks (2014) supports the strength of the methodology used in both Chetty’s papers and the Hanushek (2010) paper, which is further supported by Murnane (2000), Mulligan (1999) and Lazear (2003). Overall, these 6 papers find results that around a 10% - 15% increase in annual income for a 1 SD improvement in learning. The latter would represent a significant increase in test scores but help to standardize the findings across papers in this literature. Based on these findings, CBA models at MCC typically use a parameter estimate of a 12% or 13% increase in annual income for a 1 SD improvement in learning.
The third medium-term outcome is greater alignment between skills obtained and those demanded by employers. While the overall approach is the same as in the preceding cases, the analysis has additional complexities because of the variation in types of TVET and the need to consider a range of employment outcomes. Therefore, we leave that discussion to the more detailed section on TVET CBA below.
In Practice: General Education – School Construction
This section provides a hypothetical lower secondary school construction project to illustrate the concepts introduced earlier in this document. The example begins by summarizing the program’s logic, the core problems the project aims to address, and then identifies the main benefit stream, relevant counterfactuals, and considerations for quantifying and monetizing the benefit. This example is intended to provide overall insights to the approach rather than specific details that would be provided in the documentation of a complete CBA model.
The CBA model is based on the program logic that constructing new lower secondary schools will increase access to education in two peri-urban and rural regions of the country, leading to improved transition rates from primary to lower secondary school, and ultimately more years of schooling, which will result in higher lifetime incomes for the students in these schools who complete additional years of schooling.
In these two regions, the enrollment and graduation rates for lower secondary school are among the lowest in the country, particularly for girls. In the root cause analysis, a main reason for this was found to be a low density of lower secondary schools, meaning that many school-aged students in the target regions cannot feasibly travel to the schools to attend. However, questions also remain about the household demand for education in the target areas, so a complementary intervention on community development is envisioned to enhance understanding of the wide array of potential barriers to attending school and to determine how to reduce those barriers through targeted activities, including social and behavior change initiatives.
The main benefit stream is expected to be the increase in (incremental) lifetime earnings for students who obtain additional years of schooling. These additional years of schooling would result in more learning, but as the schools are anticipated to be of equivalent quality to existing schools, in all aspects, the gains are expected from years of schooling alone; that is, there is no anticipated change in education quality or learning for a given grade attainment. Therefore, the key drivers for the CBA metrics are the average annual earnings of graduates of lower secondary schools, and this estimate relative to the annual earnings of primary school graduates. The community engagement component is intended to support reaching these benefits, as are national level policy and institutional reforms to develop a national scheme for school operations and maintenance (to increase the lifetime of the infrastructure investment), and a strategy to recruit qualified teachers to serve in these more rural areas.
In constructing the counterfactual (i.e., without project scenario) the analyst must account for two main possibilities. The first is that without a lower secondary school nearby, the students would have finished their schooling with completion of primary school, which is particularly likely for girls. A second possibility is that some students would have transitioned to a distant lower secondary school but incurred additional costs (time, fees, transport costs, risk of safety, etc.) to attend this school, and would have potentially dropped out of school earlier due to these costs. For those who fall into the second category, there may be no difference in lifetime earnings (as would be the case for the first counterfactual possibility), but a small benefit stream should be included to capture these cost savings, relative to the counterfactual. 56 For the CBA it will be necessary to define an informed assumption about the relative shares of primary graduates in the targeted region who terminate after primary and who continue on to lower secondary. This could be based on information from recent EMIS or household survey data, or discussions with the communities to record current and recent schooling behavior in the relevant age groups.
Turning to the with-project outcomes, as noted, the main benefit stream identified is additional years of schooling. The next step is to quantify the potential increase. Project feasibility studies and initial design work was conducted to determine the best location for the lower secondary schools, based on the location of existing primary schools (to determine which schools would feed into the new lower secondary schools), and lower secondary schools (ensuring that the new schools were not too close), and census data that indicated the density of houses and estimated the potential flow of school age children. These efforts were further supported by initial conversations with local governments and communities to ensure there would be buy-in on the new locations, and those that did not get them understood why they did not. Together these efforts support developing a stronger project to reaching the intended objectives and can inform the potential estimates to use in the CBA model.
The analyst would hope to draw upon the literature to determine reasonable parameter estimates for schooling impacts; however, rigorous evidence on the impacts of building lower secondary schools, particularly in developing countries appears to be quite sparse. 57 Additionally, although schools had been recently built in other parts of the country, including more rural areas, there had been no monitoring or evaluation data to consider for the CBA. The next best option would be to examine the literature on similar impacts at the primary school level in developing countries. However, only three rigorous studies were found, and they seem to suggest that the two levels are quite distinct, particularly as their country contexts also appear very different from that of the country where this intervention will take place. Therefore, caution is needed in using these findings to inform the CBA estimates. In this situation, the quantifying would prove more difficult than the monetizing.
Based on the three studies, 58 and what is known about the country context where the project would occur, the greatest influence on additional years of schooling would be expected to occur from increases in enrollment in the first year of lower secondary. This enrollment rate would be determined by considering the project’s potential impact on primary school completion, as that would be a requisite for advancing to this level of schooling, and transition rates from primary school to lower secondary school. This information would inform the expected flow of students, outside of the first few years when older students may transfer to this closer school or reenroll after previously dropping out. If data were available, perhaps through an EMIS or household survey, on primary school completion, lower secondary enrollment and transition rates between the two for other areas where schools are equally accessible to the population, then these could be a useful benchmark.
However, transitioning to and enrolling in lower secondary alone would not result in attaining additional years of schooling. Students who enroll would need to remain in school for at least a year, and hopefully go on to complete the lower secondary level (typically 3-4 years). To quantify this parameter with and without the project, the best indicators would be estimates for dropout and completion rates by grades and the lower secondary school level. The current trends or estimates for the targeted regions should be used to inform the counterfactual, with perhaps national averages or those from areas more advanced, in terms of the infrastructure accessibility provided, used to inform the with-project estimates. EMIS data would be best, but household data may provide sufficient information to support estimating these parameters. If there was sufficient evidence to suggest that the community engagement component could effectively address barriers to staying in school, then perhaps this could result in incremental improvements beyond those currently experienced elsewhere, with similar infrastructure and physical access to lower secondary schools as what would be expected from the project. If justified, then this could be factored into calculating a slightly higher parameter estimate for additional years of schooling.
Once the analyst has taken all these aspects into consideration to determine the various schooling-related rates, these would be applied to the number of students in each cohort to convert them into the number of potential beneficiaries. As shown, this requires using probabilities for the two potential counterfactual scenarios, and then forming a narrative on expected school pathways with the average rates of enrollment, transitions, dropouts and completions. The assumptions on schooling after lower secondary would follow national averages or of similar communities, as this intervention makes no attempt to support transition to upper secondary, TVET programs, or beyond. More school-aged students would have that potential to advance their schooling, given they had finished lower secondary school, and that would be reflected, but not that they are more likely than any other graduate of lower secondary school in the country to transition to upper secondary school. Similarly, the project does not have an aim to directly impact labor market outcomes related to participation, employment or unemployment. As with further education, these would be expected to be similar to the current trends of those that graduate lower secondary school, or wherever their education path ends.
Finally, these ultimate increases in schooling would be monetized using a household or labor force survey dataset as described in the previous section – determining the wage differential between students that would leave with say primary schooling and lower secondary schooling, adjusting based on the expectation for the project determined in the quantification exercise. The average gains expected for each student would be aggregated for a given cohort in the first year after they graduate (adjust for where learning paths may end), and tracked for 20 years, as described in the time horizon discussion above. Assuming the national scheme for operations and maintenance is successful, the investment would be expected to last 20 years, and therefore include 20 cohorts. Each year of benefits is put into present value terms so that these can be combined across cohorts and across time to calculate the key CBA metrics. As one can see, this becomes complicated rather quickly, so MCC has developed ‘cascade’ spreadsheets to help facilitate analysts in producing these calculations – i.e., not starting from scratch and adjusting on the margins to reflect the project-specific situation.
In Practice: General Education – Teacher Training
The second intervention example for general education focuses on a hypothetical, nationwide in-service training program for secondary school teachers and directors. Following a similar structure to the previous example, we begin by summarizing the core problems the project aims to address, the program logic, and then identify the main benefit stream, relevant counterfactuals, and considerations for quantifying and monetizing the benefit. This example is intended to provide overall insights to the approach rather than specific details that would be provided in the documentation of a complete CBA model.
As referenced earlier in the paper, developing countries have experienced significant increases in access to education over the past five decades, leading to significant improvements in the quantity of schooling attained. However, education quality and learning has lagged and is often poor. This is the case for the country where the example intervention takes place. Detailed problem analysis determined that secondary school teachers lacked the necessary pedagogical skills and subject-matter knowledge to support students in achieving grade-level learning targets, as seen by scores on standardized national and international exams – particularly for math and science.
The main component of the intervention was to provide over 100 hours of face-to-face training to existing secondary school teachers, providing separate modules to cover pedagogy and subject matter content. The training was complemented by creating networks of teachers, based on location, to support discussions of the training materials, with continued exchanges and collaboration planned for after the training concluded. At the same time, the intervention supported the national government to establish a continuous professional development scheme for secondary school teachers that provided salary increases and other incentives to improve teacher quality, and even a financial bonus to encourage voluntary retirement for those close to retirement age and uninterested in continuing their professional development. Lastly, a separate training curriculum and discussion group components were designed for school directors to ensure that teachers had strong educational leadership to further support teacher development and students in achieving improved learning outcomes.
The CBA model is based on a program logic in which increased knowledge of subject matter and pedagogy among secondary school teachers leads to improved student learning results. The mechanism through which this happens is that the trained teachers learn new information, retain it, apply it in the classroom, and this improves the experience and learning for their students. The national level intervention schemes and improved school management further supports achieving these results.
The main benefit stream from this teacher training investment occurs through increased student learning outcomes. The intervention does not directly aim to increase the years of schooling obtained. There is a possibility that students that enjoy school more and perform better so are more interested in continuing their education—or that parents recognize the benefits and decide to keep their children in school longer--but this potential benefit is not considered in the CBA model. If future literature demonstrates this secondary impact, then this should be examined more closely to consider its potential inclusion. In some circumstances, it could make sense to incorporate a reduction in repetition rates as an additional benefit stream, as improvements in learning can be expected to increase students’ chances of passing each grade. However, in the country of the intervention, the repetition rates are already quite low for all levels of education, so this benefit stream was not considered further for inclusion. Pulling these aspects together, the counterfactual is simply that students would have remained in the schooling system and been taught by lower quality teachers, resulting in less learning, and therefore lower scores on standardized exams.
To quantify this benefit stream, it is helpful to start by examining the literature. In 2019, MCC carried out a more extensive literature review 59 on the topics related to this hypothetical intervention. The summary starts by outlining 12 key factors describing the context and potential components of teacher training programs that should be examined to determine the effectiveness of proposed training programs. The literature reviewed was examined by these factors and compared against the design plans for a similar program, considering the relevance of the county context in comparison to where other evaluated programs were implemented. There are potentially other factors of external validity to consider but overall, this is quite comprehensive in its examination and uses for this purpose. These key factors are highlighted in Table 4, each informed by the literature.
The focus of the intervention is on secondary school students – middle and high school. However, the bulk of the literature, such as the 226 studies review by Evans and Popova (2015), 60 evaluate training of primary school level teachers. This could be indicative, but evidence suggests that it becomes more difficult to impact learning outcomes the later the grade of education (see Factor 1), so caution would need to be taken in directly applying these estimates to the level of our hypothetical intervention. Additionally, this intervention is nationwide, whereas most impact evaluations have been focused on a smaller group of teachers or targeted to specific regions of a country (see Factor 6 below). For example, the average number of teachers trained in the evaluations reviewed by Popova et al. (2016) was 609. 61 The general limits to the literature on secondary education teacher training is summarized in a 2017 Mathematica review. 62
Based on the review of the literature using the 12 outlined factors, the hypothetical intervention is expected to improve test scores, relative to the counterfactual, by 0.20 SD. This is therefore the value of the parameter used in the CBA model. This is within the range of the Evans (2015) paper, which cites 0.12 – 0.25 based on their work. The sensitivity analysis may decide to use a range of 0.17 – 0.23 for this parameter, with close to a normal distribution, or draw upon the range just cited from the 2015 systematic review. This would be based on the specific context and should be justified by the analyst.
The last step in the process is to monetize this benefit stream. Improved learning outcomes are expected to result in increased future earnings. Based on an MCC 2019 updated literature review (described above in the subsection Monetize ), the parameter point estimate is assumed to be a 13% increase in annual income for a 1 SD improvement in learning. 63 Pulling together the quantification and the monetization results, the average predicted impact for a given student would be 0.2 SD x 13% = 2.6% increase in annual salary. This salary increase would be on top of the predicted annual salary for a graduate of X grade/level, based on standard Mincer estimates from household survey data. This would then be multiplied by the number of students within a given cohort that go on to obtain employment – i.e., factoring in the labor market outcomes discussed above, participation, employment, and unemployment.
| # | Factor | Description |
|---|---|---|
| 1 | Schooling Level | It may not be reasonable to expect similar learning results as those found in primary school teacher interventions, but the relationship between level and learning is unclear and may be highly reliant on the quality of the program design to meet the needs to of the students. |
| 2 | Region of the World | The country or regional context should be considered when reviewing the literature, as historical, language, religious, rural/urban, etc. features may warrant further attention. Some of this would come through in other key factors listed but should be weighed when choosing a parameter estimate/range. |
| 3 | Starting point of student learning | |
| 4 | Starting point of teacher’s training and education | |
| 5 | Training Exposure Period | This is defined as the number of hours that teachers are trained and within what period of time. This would include all components of the training program, although it is understood that not all methods should likely be treated equally. Assuming that the quality of teacher training is equal across X programs, then the assumed relationship here is that with more hours of training the teachers would learn more, be more capable of applying their learning in the classroom, and this would lead to greater impacts on education outcomes for their students. However, at some point more hours would not be better. The literature does not appear to provide clear guidance on the number of hours, and this would likely be related to factor #4 just described. |
| 6 | Training’s Reach: Number of Teachers Trained | There are two key aspects worth mentioning: first, the success of implementation and second, that widespread training could support desired behavior changes. Programs that train fewer teachers are likely easier to implement, but overall success of implementation would influence the results of all types of programs. With respect to results, it may also be difficult to compare those that are nationwide with a smaller focus. When all peers and supervisors are trained there is more likely to be shifts towards desired behavior changes. These would likely stem from having training-related topics discussed more frequently, more pressure from social norms and expectations, support from others to implement new methods, etc. |
| 7 | Training’s Reach: Only Teachers or inclusion of School Directors/Principals? | Related to factor 6, it would seem reasonable to assume that if teachers and their supervisors are trained then there is likely to be greater adoption of the approaches and material introduced. The inclusion on School Directors or Principals within the training scheme, in some capacity, would seem to be an advantage of a program – particularly if they are not currently being trained. |
| 8 | Training content: mix of pedagogical and subject matter training | The mix of training content should be driven by the problem that the training is trying to address within the specific population. However, within the developing country context, the level of education and training among teachers typically necessitates that both pedagogical and subject matter training be provided (see factor 4 described above), particularly for secondary school teachers. Pedagogical training is clearly key, but if the teacher does not know the material that they are expected to teach then that training alone may be of low value. Likewise, having a teacher with a master’s degree in X subject does not necessitate that they will be a good teacher, and in that case pedagogical training would be a priority. |
| 9 | Training method (e.g., in-class, in-the-classroom, study groups, teacher networks, etc.) | The preference seems to be a mix of methods, rather than a focus on one particular method. Given different learning styles and the need to quickly apply the learning within the classroom, mixed methods are more likely to ensure learning and adoption of new practices. However, that specific mix does not seem to be known within the literature. There is likely a larger set of literature on the training of trainers that would support this – although not explored here as it is a bit outside of the scope of this literature review. |
| 10 | Teacher Incentives | There are various types of incentives, such as linking a teacher’s career opportunities (improved status, promotion, or salary), that have been used in teacher training programs to encourage attendance, completion and/or implementation of the training materials within their classrooms. In principle this makes sense, but the incentives need to be properly aligned to get the desired results. There are some specific studies that have found an impact from aligned incentives in education interventions but overall, the literature is limited. |
| 11 | Time for benefits to kick in | The literature does not suggest any specific lag between when training is delivered and when student achievement is improved, but there is some suggestive evidence based on the timing of endline evaluations that this lag is about one year. |
| 12 | Sustainability of impacts on student learning | For the purposes of CBA, it is important to understand how long the benefits of a given teacher training program are expected to impact student learning. If looking at the general literature of professional training, then it stands to reason that continuous follow-up, opportunities to learn, practice and improve upon newly learned skills should be built into a teacher’s job and performance expectations. There does not appear to be any longitudinal studies on teacher training programs to inform how these potential impacts may diminish across time, particularly if continuous training is not provided. |
In Practice: TVET
Section II.B noted that there are three main categories of TVET: (1) pre-employment, usually occupation or industry-specific, training, (2) training-related active labor market programs, typically for the unemployed, and (3) on-the-job or continuous training for those already working. The evolution of MCC’s TVET investments was also briefly discussed, noting in particular a shift to more employer or demand-driven programs that should more closely meet the needs of the labor market. Thus, the focus has been more on addressing needs for specific (often fairly advanced) skills to enhance growth than on programming directly targeting the poor or addressing high unemployment among low-income youth. Reflecting this, MCC programs tend to be more oriented to the first and third types of TVET, rather than Type 2 TVET that typically provides skills to disadvantaged groups. For example, the TVET centers funded under the Georgia II Compact are generally oriented to individuals with some workforce experience who are currently employed. Participants are 25 years old on average and have about 6 years of work experience. Some are upgrading their skills within an occupation, while others are switching fields. Levels of schooling tends to be high, e.g., completed secondary. Despite this change in focus, the second TVET category does still feature as part of some recent programs, for example, the Morocco II Compact’s Results‐based Financing (RBF) for Inclusive Employment sub-Activity, which targets women, at-risk urban and peri-urban youth that are unemployed or not in the labor force. Therefore, approaches to CBA must be flexible enough to be able to deal with the range of TVET types.
Annex IV provides detail on the year of compact signing and program type for MCC’s TVET investments and shows, among other things, the preponderance of on-the-job experience components in recent TVET investments. Program components are described in more detail in Annex V. It is obvious that the range of potential program components is wide, encompassing not just the ‘usual’ education components such as construction, equipment, curriculum development, training of instructors and overall sector management, but also development of occupational qualification standards and certifications, mechanisms for employer or labor market feedback, and job placement assistance.
The wide range of program components—on top of the differences in TVET types—makes CBA of TVET challenging, since the analysis in principle should account for the impacts of each significant part of the program on the outcomes of interest, which as discussed, generally consist of improved employment outcomes and increased earnings for beneficiaries. Further, the existing evaluation literature is limited in terms of how much it can help to generate parameter estimates for these impacts. For one thing, recent rigorous impact evaluations have mostly focused on Type 2 TVET, or active labor market program activities providing basic skills for specific disadvantaged populations (usually low income or unemployed youth). These evaluations are likely to have limited relevance to the industry-centered TVET featured in newer MCC compacts. Other research, including evaluations surveyed by Tripney et al. (2013), does capture a broader range of TVET types, but most of these studies are not as reliable methodologically. Second, unlike for general education, there is little systematic evidence that disentangles the effects of specific components of TVET interventions such as infrastructure improvement or educator training. 65 One can draw on evidence on these impacts from general education studies, but it may be difficult to generate predictions of impacts for TVET in which one can be reasonably confident. At the very least, this calls for extensive sensitivity analysis of the hypothesized parameters.
Benefit streams for TVET investments
Following most CBA of training interventions, MCC practice has focused on benefits accruing to the trainees themselves, via the two pathways of improvements in employment outcomes and increases in earnings conditional on employment. These pathways are elaborated on below. First, however, it should be noted that this standard approach omits other potential benefits of training, namely those to firms. Employers of course benefit from better trained, more productive employees. However, even if workers are paid a wage equal to their marginal product, which cannot necessarily be assumed in many developing country contexts, firms may enjoy an increase in their consumer surplus (as demanders of labor) which translates into higher profits. In some cases, firms’ need for (and their benefit from) specific skills is acute. For example, if critical equipment lay unused because no one can operate it or repair it, then there could be a loss of profit occurring in the counterfactual scenario. With more access to trained graduates, there would be less and shorter gaps in stalled production, resulting in higher profits. Employers could also benefit from lower turnover and savings on recruitment costs, particularly if in the absence of domestic trained staff, they normally must recruit some skilled workers from abroad. Hence it is important to keep in mind the potential limitations of the current CBA model, particularly for demand-driven TVET.
One reason these firm benefits are typically omitted in CBA of training interventions is that it is usually harder to measure them from survey data that are typically available. In contrast, as discussed, there are usually readily accessible data sources that can be used to predict employment and wage outcomes for trainees, namely household or labor force surveys or direct interviews of employers. That said, the incorporation of employer benefits into TVET CBA remains a topic of investigation and future versions of this document will provide guidance on this topic.
Below we discuss approaches to generate expected changes to employment and earnings outcomes for participants in TVET programs, followed by a discussion of data sources for these approaches.
What is the counterfactual?
The analyst first needs to carefully specify the counterfactual, i.e., the without-program scenario, in order to estimate program impacts on employment and earnings. For TVET interventions, this can be quite complicated. Consider for example, the range of possible training and employment outcomes that might occur in the absence of an intervention to provide training for a specific field or industry. The possibilities under the counterfactual are that the individual would:
- Attend TVET in the same field as the proposed program but at the current, lower quality. The quality improvement could result from supplementing classroom instruction with work experience, updating the curriculum, or other changes.
- Attend TVET in the same field but achieve a lower-level certificate or length of training. This is especially relevant if there is an upgrade to TVET in an industry that involves additional or more in-depth training, e.g., qualifying trainees as senior technicians rather than technicians.
- Attend TVET in a different field (at the same or different level as the proposed program).
- Not attend TVET at all, stopping their schooling at the previous level, which could be lower secondary, upper secondary, or university.
For employment outcomes in the without project scenario, the individual might:
- Find employment in the same field.
- Find employment in a different field.
- Not enter the labor market or not find employment (is unemployed).
These possibilities are particularly relevant to pre-employment (Type 1) TVET programs or to those that, like recent programs in Morocco, Georgia, and Côte d’Ivoire, combine elements of pre-employment and continuous training TVET. Clearly, the possible without-project training and employment outcomes together lead to a large number of potential counterfactual possibilities. Each implies a different earnings profile, hence a different net impact of the project, since the TVET project’s outcomes are compared to what would have happened if there was no project. The challenge is finding reliable information on what earnings would be for individuals in each of these counterfactual categories. And of course, one also must come up with assumptions about how the participants would have been distributed across each of those categories (e.g., the share of participants who would or would not have attended TVET in the field, who would have gotten a job in the field or some other type of work, etc.).
It should be noted that the counterfactual is generally simpler for training programs providing basic skills like literacy, IT, or soft skills for unemployed individuals—TVET interventions of the second type. Here the analyst generally would only consider the expected increment to earnings of these basic skills in the labor market, and the probability of any employment, or possibly, formal or ‘high quality’ employment, in the with and without project scenarios. 66 The counterfactual would also be relatively straightforward for standard interventions of the third type of TVET, on-the-job or ‘in-service’ (or continuous) training. Here it may be reasonable to assume that the individual, who is already in a particular industry or occupation, would remain so in the absence of the training, but at their current skill level and earnings (or, rather, earnings trajectory over time).
Returning to the thornier example laid out above, obviously simplifications must be made. Current work for the MCC Côte d’Ivoire Compact’s TVET Activity suggests an approach. The counterfactual cases above were simplified by assuming that all students would otherwise have been enrolled in an existing TVET program, reducing the counterfactual for training to two scenarios: (1) enrollment in an existing TVET center that does not provide the specific training at same level as the intervention, so they would have finished their schooling at a level below (e.g., as a technician rather than a senior technician), mostly likely in the same field or a similar field; or (2) enrollment in an existing TVET center that provides this training at the same level but of a lower quality than the intervention will provide. Note that these scenarios are similar to the basic distinction discussed for general education, with the first case implying an additional level of training obtained under the program, and the second case indicating a quality improvement, i.e., learning more within the same years/level. Both counterfactual scenarios would be expected to result in lower rates of employment, particularly in their field of study, and lower wages, relative to participating in the intervention. 67
With just these two counterfactual possibilities defined, the required information (or assumptions) reduces to: earnings trajectories for those who have completed TVET in the same or similar fields but at a lower level and for those who have completed TVET in the same field, at the same level but at the existing, lower quality; the likelihood of being in each of these two without-project scenario groups; and the probability of each of these groups gaining employment. This establishes the counterfactual. For the with-project scenario, one would need to estimate the earnings and employment probabilities for those participating in the new TVET intervention or equivalently, the expected incremental outcomes under the new TVET intervention.
Generating estimates of expected benefits
For earnings benefits, there are several potential sources of information. The choice will depend on data availability (and the possibility of new data collection) as well as the nature of the TVET intervention being considered. Ideally the data or estimates will be disaggregated by gender; certainly, this should be done for any new data collection.
Household or labor force surveys: When there is a recent survey containing information on employment and earnings, this can be used to generated expected earnings benefits. Several approaches are possible, depending on the nature of the TVET. Perhaps the most obvious—but potentially problematic—approach is to obtain an estimate of the impact of having vocational or technical training on earnings from a Mincer regression (household or labor force surveys will usually have information on training degrees as well as general education). As discussed earlier, one problem with this method is that sample sizes in most surveys may yield too few observations with TVET—or the relevant TVET—to permit reliable estimation of earnings impacts. Further, the intervention may be designed to provide new forms of TVET not captured in existing surveys, or to improve the quality or relevance of existing training, for example by increasing its linkages to employers via on-the-job experience. Either situation would mean that estimates of returns based on earlier or current forms of TVET will be more reflective of the counterfactual and likely too low, all things equal, so would at best be considered a lower bound estimate for the with-project scenario.
An alternative, especially for industry or occupation specific training, is to estimate how the training will change the occupational categorization or level of the trainees. For example, for Georgia II, completing the TVET program was expected to be equivalent to changing one’s job grade at entry from “plant and machine operators and assemblers with an elementary vocational school education” to “plant and machine operators and assemblers with higher education”. An estimate of the difference in pay between these grades was taken from the household survey. Similarly, for new TVET centers under the Morocco II compact, graduates are expected to become qualified for more advanced occupation levels within the industry. This approach can be informed by discussion with TVET administrators and employers. Note that it requires that the survey has detailed occupational classifications (though direct information from employers on pay by level, discussed below, can substitute for surveys).
In some cases, it may be reasonable to employ earnings regressions by assuming that the training provides an increase in skills comparable to increasing years of schooling or school level by some amount—for which the implications for earnings are more easily obtained with survey data. For the Morocco I Compact, for literacy training for individuals involved in handicrafts, fishing, and arboriculture, earnings returns were assumed equal to the impact of basic education as estimated in Mincer regressions. For a residential vocational training for artisan in the same compact, the earning effects was assumed equivalent to the 2nd yr. of secondary, again derived from Mincer results. A similar approach was taken for the El Salvador I Formal Technical Education subactivity. This approach is probably best suited for TVET involving training in basic skills (including literacy) as these are most comparable to what would be obtain in general schooling. Of course, to use the Mincer regression results it is still necessary to ascertain which level (or gain in) of general schooling would be equivalent to what the training will provide. While this is bound to be somewhat arbitrary, discussions with employers could help move toward a plausible assumption.
Interviews/surveys of employers: Particularly for industry-focused TVET programs, interviews with or surveys of potential employers in targeted industries may provide more accurate estimates of likely wage gains from training interventions. Typically, the employers would be asked what they currently pay new hires with standard skills (which could be entrants with the current TVET, or none at all, depending on the context) and what they would pay new hires with the higher skills to be provided by the new program. Clearly, the former would aim to reflect the counterfactual and the latter the with-project scenario. Getting the latter case right is crucial, but also much harder. In the case of MCC’s Mongolia TVET investment, it was assumed that the skills of graduates were equivalent to those of new international hires. In a variant of this method, for Georgia II a sample of employers was presented with two hypothetical candidate CVs, one for a graduate of the best current Georgian engineering program and the other a graduate of a good US engineering program, and asked the salary offer that would be made to each. Note that the assumption that the new TVET center or program would be of the same quality as a good international program may be a strong one. 68
External evidence: The analyst can also explore whether evidence from other countries can be brought to bear. This may be in the form of impact evaluation findings from a (hopefully) similar TVET program in a comparable country context, or from a meta-analysis or literature surveys drawing from multiple such studies. Ideally these studies would be randomized controlled evaluations or evaluations using good quasi-experimental techniques. Examples of such meta-analyses or literature reviews are Tripney (2013) and McKenzie (2017). The difficulty here is finding a study or group of studies for which the characteristics of the intervention are similar to those for the program under consideration, and similarly for the country context. As already noted, there appear to be relatively few prior rigorous evaluations of the kinds of industry-focused, pre-employment TVET programs MCC is currently focusing on.
The preceding discussion on information on earnings benefits has been focused on the field of study, or the occupation or industry on which the TVET is focused (e.g., interviews with employers in the industry). But some training participants may not be able to secure a job, and some may find employment but not in the field of study. Estimating employment probabilities is discussed in the next subsection, but it is useful to note briefly how this relates to earnings. For those who end up employed in other fields, an assumption needs to be made about whether the skills obtained in training have value (and raise earnings) in those fields. If there are no such impacts, those who do not enter the field get no benefit from the training, though of course they enter on the cost side. However, this is likely too strong an assumption. Skills obtained from the training may often be transferrable to other fields or attaining a certificate/diploma could signal to employers an individual’s general skills or willingness to learn, leading to higher employment probabilities and earnings offers overall. The Georgia II TVET evaluation results indicate earning benefits for such individuals. 69 The expectation of gains in earnings, even if employed in other fields, is built into the later Côte d’Ivoire and Morocco CBAs. 70
Employment probabilities
As noted, the earnings or productivity benefits to TVET will be conditional on getting a job--and one for which the skills obtained are relevant. A well-designed TVET program should improve the chances of employment, particularly in the relevant field. In theory this should be strongly helped by the inclusion of workplace experience in the TVET program, as this provides participants with relevant work experience as well as direct contact with a potential employer. The analysis requires determining appropriate employment probabilities, otherwise known as insertion rates, under both the without and with project scenarios. For industry or occupation-specific TVET, estimates of employment probabilities in the targeted field or occupation and elsewhere are needed for a complete accounting of potential benefits, since as noted above, impacts on earnings will likely differ for the two cases.
There are several possible approaches for coming up with an appropriate estimate for (changes in) employment probabilities, mostly using the same sources as for earnings above. As with earnings, efforts should be made to develop estimates separately by sex. One source would be household or labor force surveys, which could provide econometric estimates of probabilities of employment in a given sector or occupation as a function of TVET training, controlling for other factors. However, this approach has (by now familiar) limitations related to small sample sizes and that any regression estimates capturing the impacts of existing (or past) TVET programs would likely be more reflective of a counterfactual, as the intervention is expected to improve TVET relative to the counterfactuals defined above. These estimates could inform with-project estimates when TVET is being expanded without significant changes in content or quality. 71
For most cases, a better source of information would be impact evaluation findings from a (ideally) similar TVET program in a comparable country context, or a more comprehensive meta-analysis or literature surveys drawing from multiple such studies. For example, for the CBA of Morocco II’s industry-specific TVET, MCC economists used Tripney et al. (2013) meta‐analysis estimates of the improvement in employment probabilities for TVET programs with on‐the‐job training relative to TVET with theoretical training only. 72 Additionally for Morocco, another donor had recently created a TVET center under the same demand-driven principals as the MCC investment being designed, and the initial insertion rate data of graduates was used to inform potential insertion rates that the MCC-supported centers could achieve relative to that for the existing centers that were less demand driven.
An additional source of information on employment rates is tracer studies, which are essentially follow-up data collection efforts with trainees at various points after graduation to assess their success in finding employment. If such a study has been done for the country for earlier TVET graduates, as was the case for the Georgia II TVET analysis, this may provide more precise information about employment outcomes for a specific type of TVET than standard household surveys. They do normally suffer from similar disadvantages, however, including only capturing impacts of existing, hence potentially different or lower quality, programs than envisaged under the intervention. Tracer studies could inform the counterfactual, but they only follow program graduates, not others.
CBA for TVET Grant Facilities
As noted earlier, reflecting the effort to orient TVET more strongly to private sector and industry needs, recent MCC compacts—including in Côte d’Ivoire, Georgia II, and Morocco II, and somewhat earlier, Namibia— have employed a competitive grants program to allocate funds to assist with existing and/or new TVET programs. Organizations (e.g., industry associations) applying for the grants must also supply resources of their own, i.e., have a real stake, further ensuring the tie to the needs of private sector employers. The characteristics of the grant mechanisms vary, with implications for the CBA:
Georgia II put limits on where the investments would be focused--the TVET programs were supposed to be in STEM related fields and at higher education levels (levels IV and V). In practice, this restriction was not always strictly adhered to, but it did allow some focus for the initial economic analysis.
Morocco II in contrast did not have a particular focus but grant amounts differed depending on whether the application was for (1) an existing center converting to the new model of private public partnership with some rehabilitation or extension; (2) a completely new center constructed with the new private sector integration.
Côte d’Ivoire was limited to 3-4 centers, with one center in the public works sector classified as pre-qualified for support before compact signing. This decision was based on their response to a call for ideas and the connection with the other MCC compact investment in the Abidjan Transport Project. The request for concept notes was not limited to economic sectors or levels of training. At the time of the preparation of this paper selection is still in progress.
The main challenge for the economic analysis is that at the time of the original—and most decisional—CBA (that is, when the Investment Memo for the compact is submitted for approval to MCC’s Investment Management Committee), the TVET centers or programs will not yet have been selected. Instead, the analyst must assess the entire grant facility based on limited information. This results in a provisional economic analysis based on expectations about the type of centers, i.e., in what fields and at what levels, that will be funded. Where the number and type of eligible TVET centers is relatively circumscribed (for example, in a handful of industries) the task will be easier. Still there inevitably will be more uncertainty about potential employment and earnings benefits, as well as other factors such as cohort size, than in a more standard (single and known) TVET project. This uncertainty needs to be emphasized in the documentation of the CBA. A further difference from a single-sector or pre-selected TVET center would be that the grant facility mechanism includes additional costs to administer and manage the grants, which must be added to TVET project costs. In practice, these costs are not added to each individual center, but instead considered as a project-level cost to include when the individual CBAs are aggregated to estimate the project-level CBA. For the original CBA, individual centers are held to a higher threshold ERR to consider these additional grants management costs, typically 12% instead of the normal 10% - this is used for grants overall at MCC and not just for TVET.
Once the grant facility mechanism is set up, a first step would be a call for ideas or concept notes that would serve as the first round of competitive selection of potential grantees. Those selected would be asked to prepare a detailed proposal that would be used for final selection. The MCC and MCA county teams would work together to assess these proposals, a process that involves conducting a CBA on each of the proposed centers. Initially, the Georgia II compact call for concept notes provided applicants with a simplified CBA template and requested applicants to submit their own CBA with their proposals. This was not ideal as applicants lacked the necessary skills to do the analysis, and it was relatively easy to manipulate the expected benefits or costs to ensure an ERR above the threshold. Based on that lesson learned, MCC decided to conduct the analysis either on their own, with support from a consultant or with the MCA to calculate an ERR for each proposal (a non-trivial task) for Côte d’Ivoire, Morocco, and later steps in the process for Georgia. Once grantee selection is complete, the individual center results are used to provide a more accurate, updated ERR for the overall grant project.
The essential principal behind the costs side of CBA is that costs of all inputs required to produce the project benefits must be included, in monetized form. This includes costs borne by MCC as well as contributions of other actors, including other donors, the government, and private firms and households. The contributions can take the form of cash, in kind contributions, time costs, and use of or depletion of any assets used to deliver the benefits. Administration costs associated with compact implementation are also accounted for, including those incurred by the Millennium Challenge Account (MCAs). 73 It is irrelevant from a CBA perspective if the burden is borne, or the funds come from, outside the compact country: all are included.
Examples from education of non-cash contributions might include: the time of community members volunteering in the construction or maintenance of a new school; inputs such as building materials donated by local residents or businesses; public land provided by the partner country government to build education and training centers; equipment or machinery donated by businesses to a TVET center; and instruction time volunteered by professionals in an industry to such a center. In each case the project is not purchasing the inputs, but they would be included in costs and valued at market rates (which for donated time would be the appropriate market wage of the individuals involved). Also potentially significant are the time costs of students while they attend school, i.e., their opportunity cost. This will be especially relevant for higher levels of schooling and TVET, since students here are older hence more likely to have the possibility of working (TVET considerations are discussed below). However, as noted in the general education examples above, those under the legal working age may be employed within or outside of their household, so that should be examined and considered in the CBA model, as relevant.
Project cost accounting distinguishes between initial or fixed costs, including capital costs, and recurrent or ongoing costs of administration and operation, including among other items the salaries of teachers, management, and support staff and maintenance of buildings and equipment. Note that fixed costs, in addition to school or training center construction, includes a range of other up-front expenditures, e.g., development of new curricula and training of educators. Operating costs in contrast are incurred over the life of the project (20 years or longer, to align with how benefits are specified), and could be higher in the with-project scenario if, for example, an infrastructure improvement investment now results in incremental utilities costs like heating, cooling, and electricity. For both types of costs, as indicated, it is necessary to account for (and monetize) any in-kind or donated inputs. 74 Finally, any MCC-funded project would include additional, indirect costs related to the overall compact, namely MCA administrative costs (e.g., staff salaries, building operations) and M&E-related costs including data collection and analysis. These costs are typically prorated to the project at hand based on its overall share of the compact’s total project expenditures. These MCC-specific costs are only incurred during the 5 years of the compact’s implementation.
A more fine-grained, activity-based categorization for use in costing education and training projects are the ‘standard reporting categories’ used by USAID and described in a recent guide. 75 These categories are listed below, and align with the various elements of interventions mentioned previously in this paper:
- General operations, management, and reporting
- Assessments and evaluations
- Higher education/Pre-service teacher-training
- In-service teacher training
- Teaching and learning materials
- System strengthening
- Private sector engagement
- Parents/community engagement
- Safe schools and infrastructure
- Grants, scholarships, and cash transfers to individuals/families
- Grants to organizations
It should be noted that the infrastructure category would include potential resettlement costs and environmental and social impact costs. MCC has specialists in environmental and social performance on each country team lead related work to ensure that practice conforms to International Finance Corporation (IFC) performance standards. ‘System strengthening’ would cover a range of measures including PIR in the sector. There is no need to follow these categorizations (or their labels) exactly, though they form a useful starting point for thinking about the costs of education and training projects. Each of these categories would potentially consist both of fixed and recurrent costs and would include a standard list of inputs such as labor, materials, rent, utilities such as electricity, and other expenditures.
As with benefits, costs over the life of the project are to be represented in real terms using an estimated rate of inflation. CBA is conducted in real terms—that is, future costs and benefits are all expressed in current units of the currency (usually the compact country currency, in some cases USD, using the same base year for both). Both the IMF and the World Bank provide forecasts for inflation of most countries . 76 And as with benefits, discounting is used to obtain the present value for aggregating costs across time.
Dealing with uncertainty
As with project benefits, costs cannot be known with certainty (though it is probably easier to predict and measure costs than benefits), and this uncertainty is greater the farther into the future one goes. A fair amount of research has investigated this issue for general construction costs that can be applied to the education and training sector. As noted in the recent MCC guidance document, “Vertical Structures Development and Implementation Guidelines’ (July 2021), 77 research shows that that project cost estimates for buildings and facilities systematically underestimate actual costs. In the past, underestimating construction costs has led to MCC project ERRs being significantly revised downward from their original decisional estimates and required MCC to modify project designs. Therefore, current MCC practice for construction projects is to build in a generous 30% contingency to these costs, at least when the actual design details are mostly unknown. As the project design progresses to become more defined and as construction approaches completion, a better picture of the actual costs emerges, and this contingency is gradually reduced to zero as a percent of construction costs. This practice will be applied to cost estimates of construction components of education and training projects hence will be reflected in the CBA model and ERR calculations, adjusting over time for the reduction in cost uncertainties. For the various other inputs into education and training projects, there is less firm guidance, but at the very least, the analyst should conduct sensitivity analysis for major cost components of the project.
Maintenance
For any project involving infrastructure, assumptions about maintenance are crucial. Maintenance is needed to retain, to the extent possible, the efficiency of productive assets. While the importance of maintenance is perhaps most obvious for infrastructure such as roads and power facilities, it is also essential for schools and training centers. Unless adequate maintenance expenditures are made, the life of the asset (e.g., a school building) will be shortened and/or will experience declining efficiency in terms of producing the intended outcome such as learning or grade attainment.
The issue is not resolved by simply building in the costs of some appropriate level of maintenance expenditures over the 20-year (or longer) period. It may be completely unrealistic to expect that the government will make these expenditures, if traditionally it has failed to do so on existing school facilities. A more appropriate approach may be to assume a future pattern of “business as usual” with regard to maintenance on a new facility, so that the with- and without- project scenario with regard to maintenance would be the same. Where business as usual implies inadequate levels of maintenance, there are two options for the CBA, as noted earlier. One is to assume a shorter useful life of the asset, say 10 rather than 20 years. The other is to keep the time horizon at 20 (or higher) years but incorporate a reduction in benefits for later cohorts to account for the reduced productivity of the asset.
In some cases, the project design will take the problem of poor maintenance head on. In Morocco II Compact’s Secondary Education Activity, MCC has incorporated a complementary investment to improve the operations and maintenance (O&M) process and system for similar outputs of the education intervention. The country’s performance in implementing the new O&M scheme will inform the assumptions regarding maintenance and hence future benefit streams and ERRs as the project proceeds. . Ultimately, the approach used should be based on a realistic appraisal of the past performance of the relevant government authority and the likely commitment to future maintenance needs under the project.
Additional considerations for TVET
While the above discussion is fully general and applies to TVET programs as well as general education, we should note a few areas where emphasis may differ substantially between the two. First, TVET that is strongly demand or industry driven, which is now a typical feature of the programs that MCC supports, tends to have significant involvement of the private sector. For projects funded through a grant facility, applicant organizations (which will usually be private industry groups or community organizations or consortiums of relevant actors) are expected to come up with a share of the funding. In addition, these organizations or firms may donate equipment, space for centers, individuals’ time in teaching or curriculum development, and supervision of students during on site experience. As emphasized above, all these private costs need to be accounted for in the CBA.
Second, the opportunity cost of time of TVET participants is usually more of a factor than for general education students, as the former are older hence more likely to have income generating work as an alternative use of their time. First, however, the analyst should assess whether trainees in fact are unable to work while in the TVET program. Some continuous learning TVET programs may accommodate working students by scheduling the training in the evenings, and some employers may continue to pay worker’s salaries while they train, especially if the training is very industry specific. For TVET of the first type, however, in which the individual is effectively extending their schooling instead of entering the labor market, opportunity costs are more clearly relevant, but will still depend on the counterfactual assumptions. Earnings predictions from Mincer regressions for the relevant level of education and experience (potentially zero experience in this example) can be used to assign the appropriate opportunity cost. Finally, for TVET of the second type described above, that is directed at individuals who are unemployed or not in the labor force, the standard MCC practice is to assume zero opportunity cost of time. 78
Third, equipment costs usually loom large for TVET in ways that they do not for general education. To take one vivid example, pilot training without expensive flight simulators—and/or real planes—would hardly be effective. This is not a qualitative difference from general education cost analysis, but the analyst should make sure that all necessary equipment costs for a particular type of training are budgeted, including any donated equipment. 79
D. PUTTING THE CBA PIECES TOGETHER TO INFORM DECISION MAKING
This section outlines the process to estimate CBA metrics and to carry out sensitivity analysis to test the robustness of the results, and better facilitate the use of this analysis for decision making. The discussion is just intended to highlight the main elements of this step, which are common to CBA in all sectors and are covered in detail in the MCC general CBA guidance.
Metrics for decision-making
The purpose of economic evaluation at MCC is to support the agency to make better decisions and design projects that efficiently use US taxpayer funding, and to further consider equity and tradeoffs in making such investments. As discussed earlier, MCC uses other investment criteria alongside the CBA, which is warranted particularly when some benefits cannot be easily measured or are difficult to monetize. Distributional factors may also influence project assessment.
MCC uses the economic rate of return (ERR) as an investment criterion because it facilitates comparison across projects as well as relative to the threshold of 10%, as formalized in 2015 in the MCC Investment Criteria . As indicated earlier, the use of this threshold value is the subject of continued discussion at MCC. The analyst also calculates an additional statistic, the Net Present Value (NPV). While the ERR represents the discount rate when the NPV equals zero, and is therefore a percent, the NPV is a monetary measure (i.e., in USD) of the discounted net benefits. As such, the NPV can be greatly influenced by the scope or scale of the project, making it difficult to compare projects of different sizes. The ERR is not affected by scale and thus helpful in comparisons, and a factor in why this has become the primary metric at MCC for deciding among investments or whether an investment is economically and socially worthwhile. ERRs are calculated for each project, at the lowest level of aggregation possible, with the original ERR reported in MCC’s investment decision document, the Investment Memo . As described in MCC’s CBA Guidance (page 18-19), the agency officially reports final ERRs at potentially five key points in time, and the ERR at each of these points is given a specific title and definition. The first four are normally completed by MCC Economists and considered ex ante CBA models (Original, EIF, Revised and Closeout), while the fifth is completed by a separate entity contracted by MCC and considered an ex post model.
Supporting documents reporting a final ERR (e.g., CBA models published on MCC’s website, M&E Plan) should include at least the following standardized information to comply with MCC’s full disclosure requirements and be aligned with the practices noted in our CBA guidance: the ERR (mean), the probability that the ERR is above MCC’s threshold, the NPV (mean), the present value (PV) of all benefits, an outline of critical parameters (i.e., those that are most influential to the ERR estimate, including the sources and ranges for these parameters), and an indication of when project components with separate logics do not have separate ERRs including a note on why and if an ERR is expected in the future. This additional information aims to provide insights into the uncertainty and distribution of summary statistics to support greater understanding of an investment’s potential risks and benefits. Additional specifics for each supporting document are included within the templates developed and approved by management of the economic analysis division.
Sensitivity analysis—Assessing Uncertainty
Risks and potentially inaccurate assumptions may lead to an inability of the project to attain the benefit streams as captured in the CBA model. The economic logic described above can be used to assess where in the logical chain from investment to benefits the risks are most significant. Many of these risks come down to expectations about behavioral or social change. In addition, results may be affected by broader external factors well outside of the control of the project – such as unexpectedly high inflation, currency risk, climate change and climate events, COVID-19, and changes to policy and institutional reforms, and any other complementary investments that are expected but may not materialize or not materialize on time. The economic analysis can help project design by highlighting where mitigating actions can be developed to reduce potential negative impacts from external factors, or perhaps incorporate additional components to an intervention that would support behavior change in participants to increase uptake for a given intervention.
MCC’s Cost Benefit Analysis Guidelines distinguish the following types of uncertainty:
- Parametric uncertainty , i.e., uncertainty regarding the value of numerical inputs that represent the relationships embodied in the logic and CBA models. Examples would include parametric assumptions about how learning changes from an increased in teacher training, and the relationship of earnings and employment probabilities to changes in school attainment or training.
- Structural uncertainty , a more fundamental form of uncertainty, concerning whether the model captures the key relationships (including benefit streams) and their interactions.
- Scenario uncertainty , referring to changes in broader factors outside the project but that affect benefits or costs. These include the macroeconomic environment, climate factors, broad policy changes, as noted above.
Several approaches are available to deal with these sources of uncertainty. Scenario analysis is particularly useful for understanding the implications of the third type of uncertainty above, for example, changes in inflation affecting costs, or in other policies that affect benefits. Here the analysis would show how vulnerable the ERRs are to changes in assumptions regarding these external factors. Scenario analysis would also be the means of assessing the impacts of changing basic aspects of the model, such as the time horizon or discount rate.
For parametric uncertainty, there are several possible approaches. If a statistical distribution can be reasonably assumed for the parameter, Monte Carlo methods can be used to translate the parameter uncertainty (across multiple parameters at once) into outcome or ERR uncertainty, thereby by producing a probability distribution for the ERRs. This in turn allows the analyst to establish the probability that the ERR is above the hurdle rate. Use of Monte Carlo analysis is now the default approach for conducting and reporting sensitivity analysis in the Investment Memo. However, these results rely on the validity of the distributional assumptions for the parameters in question. Where there is little or no prior evidence on the appropriate distribution for a parameter, it is better to use simpler approaches such as simple sensitivity analysis (varying the value of the parameter), bounding values, or “break-even” approaches in which the parameter value required to cause the project to fall below the hurdle rate is identified and then assessed for plausibility. More detailed discussion of these issues can be found in the MCC CBA guideline document.
Beneficiary Analysis
Research has shown that economic growth in a country tends to reduce poverty, but there are significant questions about the potential pathways through which this can occur, and which policy actions or interventions could expediate poverty reduction. As MCC’s mission is to reduce poverty through economic growth in our partner countries, this topic is closely considered during project design. At this more micro level, the assumption is that not all investments are guaranteed to reduce poverty, and there could be notable differences in the poverty reduction potential of intervention alternatives that aim to address the same core problem. The CBA, as presented above, aligns with a focus on overall economic growth, not distribution: final outcomes are typically measured as increases in income and it is the aggregate gain in incomes that is used to calculate the ERR. A complementary, distributional analysis could outline who incurs the costs and obtains the benefits of a given investment, and the distribution of those costs and benefits across certain groups. Together, these analyses can highlight tradeoffs between the potential for economic growth and poverty reduction among a set of potential interventions, as well as how a given intervention could be adjusted, or a complementary investment introduced, to better meet the aim to reduce poverty or increase benefits for one or another marginalized groups. 80
Thus far, the CBA has implicitly assumed that society equally values benefits to all potential beneficiary groups and furthermore that all beneficiaries value a dollar’s worth of benefit equally. However, on the first assumption, project funders like MCC often have an explicit preference for investing in projects that will provide more benefits to the poor or other specified groups. Equal valuation of costs and benefits may not produce results that reflect this motivation. On the second assumption, it is known that groups differ in how they would value the benefits and costs associated with a given project. For example, $500 in annual benefits would mean less to a wealthy family than a lower income family, for which this may represent a significant percentage increase in annual household income (in economic terminology, the marginal value of income or consumption is assumed higher for the poor). On the cost side, students who obtain additional years of schooling experience an opportunity cost to attend, which typically impinges more on those from poorer households, which may lack the resources to do without the foregone income.
As discussed in the Sections II. A and B on problems and interventions, these opportunity costs could be so high that individuals decide not to participate in an education and workforce development program and therefore miss out on the potential to become beneficiaries. In fact, even after school, those from non-poor families tend to have higher reservation wages as they can remain unemployed until they receive an enticing job offer. Individuals in lower income households do not have this luxury, so they may accept less than ideal employment, even if it is unrelated to the training that they just completed. These aspects of inclusion should be considered, and distributional analysis conducted earlier in project design could help to highlight who is intended to benefit and why, and identify who may be excluded. This can further inform the detailed design of an intervention to obtain a better distribution of benefits overall – supporting donor or government investments that not only achieve social efficiency (favorable results from a CBA) but could have a greater poverty reduction impact. 81
For the purposes of the CBA itself, there are two methods that economists typically use to assess the distributional impacts of projects. The first method would adjust the CBA model itself by applying distributional weights to account for variations in the valuing of costs and benefits of different groups. While this sounds like a logical approach, in practice it is challenging to determine a justifiable, non-arbitrary set of weights to use in the analysis. What should be assumed about the social valuation of a dollar given to a low-income household relative to a middle-income household? For this and other reasons, 82 economists tend to avoid applying distributional weights in CBA.
The other method for distributional analysis is the one that has been adopted by MCC, and is referred to by MCC as Beneficiary Analysis (BA). The BA attempts is a separate exercise that attempts to estimate the number of beneficiaries, and measure how the benefits forecast in the CBA model accrue to different groups. More specifically, this analysis aims to estimate the flow of benefits to various income categories (especially the ‘poor’), 83 as well as to assess the potential impact on populations of particular interest, such as women, ethnic or religious minorities, those within a particular region, the aged, or children.
Together, the results of the CBA and BA will inform decision making on both the intervention’s potential for economic growth and for poverty reduction, as well as to provide insights on its ability to respond to an MCC agency priority of gender and social inclusion. 84 As MCC has three priorities (gender and social inclusion; climate change; and blended finance) and several other outlined investment criteria (see footnote 15), tradeoffs often arise when making investment decisions. The CBA and BA results help project teams assess whether an investment could be adjusted to better allocate cost and benefits to support poverty reduction, or possibly, could be coupled with other investments that are more clearly pro-poor or targeted to groups that may be historically more marginalized (e.g., women, certain ethnic groups).
Defining Beneficiaries
According to the MCC Guidelines for Economic and Beneficiary Analysis , beneficiaries of projects are considered individuals that are expected to experience better standards of living due to program activities. These better standards of living can be materialized as financial gains or improvements in other social outcomes, but ultimately the CBA measures these in monetary terms, as an increase in their real incomes. A CBA model provides details on benefit streams through which beneficiaries should experience increased income or enhanced wellbeing through improved outcomes (for instance, the value of longer, more productive lives, the value of home production, such as childcare and domestic services, and changes in future welfare associated with a country’s natural assets) as a result of the intervention.
Reporting total beneficiaries is an MCC statutory requirement. For a given intervention these estimates would include all members of any household that has at least one individual directly benefitting from that intervention, aggregating across 20 years (or the alternative time horizon established in the CBA model). All household members are included because research indicates that when one member experiences an increase in income, it generally benefits the entire household, even if the intrahousehold distribution of these benefits is not equal. As the household is typically defined by when the beneficiaries begin to accrue benefits, for most education interventions this would not be when the student is a child, but when they have made their own household.
In addition to the total beneficiaries, there are two other groups that are often defined, particularly for education and training projects: participants and direct beneficiaries. In some cases, participants are distinct from direct beneficiaries, e.g., teachers may be trained as part of an intervention so are participants but are not considered beneficiaries, which are the students. 85 In other cases, participants are also likely to become direct beneficiaries, e.g., students wo attend a newly constructed school. Table 4 that follows provides an overall definition for each of the three groups – participants, direct beneficiaries, and total beneficiaries, as well as examples for how these could be defined for the example interventions that are used in the previous sections: general education, school construction; general education, teacher training; and demand-driven TVET. This is followed by a real-life example for an education intervention in an MCC country.
| Participants | Direct Beneficiaries | Total Beneficiaries | |
|---|---|---|---|
| Overall Definition | Individuals engaged in an MCC intervention. Some participants will become beneficiaries, but not all. | Individuals who realize improved standards of living due to their participation in an MCC-funded intervention | All members of a household with at least one direct beneficiary. |
| General Education, School Construction | Individuals from non-urban regions, with a greater likelihood to come from low-income households, who are enrolled in newly constructed, MCC-funded schools | Participant students who complete additional years of education due to the newly constructed, MCC-funded schools and enter the labor market. | All members of a household with at least one direct beneficiary |
| General Education, Teacher Training | Participant students who complete their years of education with the newly trained teachers and enter the labor market. | All members of a household with at least one direct beneficiary | |
| TVET, new demand-driven centers with new training programs | Individuals enrolled in new demand-driven TVET centers. | Participant students who complete training provided by new demand-driven TVET centers and enter the labor market. | All members of a household with at least one direct beneficiary |
The Morocco II Compact can serve as a useful example. The Education and Training for Employability Project includes a Secondary Education Activity that is estimated to have the participants, direct beneficiaries and total beneficiaries across 20 years as described in Table 5. 87 Starting with participants, two main groups are highlighted: trained educators and secondary school students. As noted above, the teachers remain only as participants, while students have the potential to become direct beneficiaries. In this particular example there are far fewer students that are expected to be categorized as both participants and direct beneficiaries. This occurs for a few reasons that are helpful to note.
The first reason is that the CBA model is built on the assumption that students can only become direct beneficiaries if they graduate from the with-project school (lower or upper secondary), rather than simply finishing an additional year of schooling. The second reason is that not all students who graduate will enter the labor market and then obtain employment. This is particularly important for estimating the number of female direct beneficiaries, as this subset of the population has low labor force participation rates. As the program was not designed to improve labor force participation rates, unemployment rates, or address any labor regulations that could be impacting these employment outcomes, the status quo was assumed in both the with and without project scenarios. Therefore, boys are more likely to shift from participant to direct beneficiary status.
This example helps to highlight that designing interventions that improve student learning is a necessary but not a sufficient condition for increasing individual incomes. If the labor market cannot absorb these graduates or other factors are inhibiting them from entering the labor market, then the expected benefits and number of beneficiaries would be reduced. This can be restated as a lesson learned: the importance of labor market conditions, as well as behavioral aspects of labor market decisions, should be considered in project design to determine whether complementary investments are needed, given the country context, to increase the potential for obtaining benefits, particularly for groups of interest, such as women and girls.
| Group | Estimate | Definition |
|---|---|---|
| Participants | 550,000 | |
| Direct beneficiaries | 180,000 | Students in with-Project schools who graduate and find employment |
| Total beneficiaries | 830,000 | Direct beneficiaries and their family members, assuming 4.6 people per household |
The final step in this process is to estimate the total beneficiaries for (in this example) the Secondary Education Activity by multiplying the direct beneficiaries (180,000) by the national average household size (4.6 persons). Since total beneficiaries include all household members, the aggregate division of benefits by sex is likely to appear as closer to 50-50, reflecting the average, relatively equal gender composition of households in the community. Therefore, while women/girls may be underrepresented as participants or direct beneficiaries, the total beneficiaries could mask these important findings. This demonstrates the need for examining each the three categories outlined above to produce a more complete narrative about which groups are benefiting and why certain groups may not realize the anticipated economic benefits.
A compact will have an expected number of beneficiaries over 20 years (or the alternative time horizon established in the CBA model), which is an aggregation across all projects, with adjustments made for any potential double counting. 90 Addressing the potential for double counting beneficiaries is important and would be determined on a case-by-case basis. Considering the intervention examples provided earlier, if there was a nationwide teacher training activity and a second activity for building schools within several rural regions, then this could result in a group of individuals who enroll in an MCC-supported, newly constructed school that also has a newly trained teacher. The analyst would estimate the participants, direct beneficiaries, and total beneficiaries separately for each activity, but could not simply add the two activity-level estimates together to report the project’s total number of beneficiaries of each type. The expected overlap would need to be accounted for, ensuring that households that would benefit from both activities were only included in the total project beneficiary estimate one time to avoid overstating the number of individuals impacted by the two activities.
We illustrate this with the Morocco II example discussed above. The Secondary Education Activity included many components, but they were implemented as a package so there was no need to adjust for double counting, at least from this perspective. Some households may combine, as students marry and decide to start their own families, but this additional step was not incorporated within this version of the CBA model and the BA completed. However, double-counting can still occur if a family had more than one lower- or upper-secondary-aged student in a with-project school, as this also has implications for calculating the total beneficiary numbers. While available student data are unlikely to be able to be used to match siblings in with-project schools, adjusting beneficiary counts could be facilitated through other data collection efforts, including in the context of focus group discussions with parents.
The definitions and example above focus on summarizing the process for reporting the total number of beneficiaries, aggregated across all groups. For the distributional analysis of a given intervention, the next steps require defining the groups of interest, calculating the number of beneficiaries for each group, and then describing and calculating the benefits accrued by each group. Specific methods for estimation will depend on data availability and activity-specific details, but MCC’s Beneficiary Analysis aims at least to describe and calculate benefits by income categories and sex (women/men, or girl/boy).
With respect to sex, there may be an expectation that girls will benefit more than boys from various education and training interventions, particularly those that have this aim specified in the program logic. As discussed earlier in the estimation of wages to monetize the benefit streams, given that the education, career and employment paths differ between men and women in most contexts, it should be standard practice to estimate employment outcomes and wages separately within the CBA model. The same could be true for examining other groups that may be historically marginalized. This distinction in the CBA model would facilitate the work of estimating benefits by groups in the distributional analysis.
This subsection has provided a summary of the importance of distributional analysis, its linkages with CBA, and introduces the reader to MCC’s Beneficiary Analysis more generally and then highlights current practices for the education and workforce development sector. MCC has been doing BA for more than a decade, and continues to examine the specifics of the analysis to improve the methodologies employed, the outputs produced, and the efficiency in complete the BA in order to support its use for decision making. As our BA guidance and practices evolve based on continued discussions on MCC lessons learned and advances in this field, future versions of the SCDP will aim to indicate what this means for the education and workforce development sector.
E. Areas for Future Work
Throughout the paper we have pointed to areas where MCC’s CBA of education and workforce development programs could potentially be expanded or elaborated further in a future version of this guidance. The list below is not comprehensive, but highlights a few areas of ongoing work:
- Accounting for externalities in education investments : While standard CBA of education investments typically focus narrowly on returns to the individual in the labor market, research has shown significant benefits beyond the labor market and the direct recipients of the investments, in particular, benefits for child nutrition and schooling, especially from educating girls. Other benefits may include greater social cohesion and reduced crime.
- Accounting for job quality : CBA practice typically considers improvements to employment and wages. While to a significant extent, higher wages capture higher job ‘quality’, jobs to which a better education or training provides access often have a number of non-wage attributes such as access to health care and vacation benefits and a safer or more pleasant work environment. Many of these attributes can be monetized in principle and included in the CBA, if the necessary data are available.
- Accounting for benefit to firms : As noted, TVET interventions (especially) often developed expressly to address skills needs of firms, whereas CBA of TVET programs is typically limited to measuring benefits to trainees. Further work is needed to ascertain when it is important to consider firms’ benefits in the CBA, and the appropriate data and methods for doing so.
Annex I: MCC’s Historical Findings: Education as a Binding Constraint
The table below lists all countries where a Constraints Analysis was conducted, and education was found to be one of the binding constraints to economic growth. The last two columns indicate when a binding constraint was also found in the country related to labor market regulations or health, which are both tightly linked to the development and use of human capital. Below the table is a list of all the countries where education was not found to be a binding constraint, as well as countries where labor market regulations or health were found as a binding constraint.
| Country | Education Constraint | Labor Market | Health |
|---|---|---|---|
| Belize (2022) | Low quality of education has led to a shortage of trained professionals in all industries | ||
| Benin II (2012) | Failure of coordination in skills training. There is an inadequacy between the needs of the market and the skills available to the market by the Beninese education system. | ||
| Côte d’Ivoire (2016) | Low level of basic and technical and vocational skills as evidenced by very low literacy and firms circumventing the problem by offering training. | ||
| Georgia II (2011) | Insufficient qualifications and skills of workforce that do not meet the demand of the labor market, resulting in high unemployment. | ||
| Guatemala (2013) | Low quantity and quality of education services and unequal distribution of these services, particularly to indigenous citizens and those in rural areas as evidenced by high returns to education, businesses trying to circumvent the restriction by providing their own training, sectors that are not human capital intensive have been the largest export sectors for decades. | ||
| Indonesia (2010) | Despite good progress in primary school enrollment rates, inequality in access to secondary and vocational education remains high in Indonesia. High returns to education and the gap between wages for workers with primary education and those with university education has been widening. | ||
| Malawi (2012) | Returns to tertiary education are high and consequently Malawians make great efforts to study in overseas universities. Primary school completion rates are low and tertiary enrollment is very low. | ||
| Morocco II (2015) | Unequal access to education and poor quality of education and training system as evidenced by low enrollment rates and poor results of Moroccan students in international tests. | ||
| Mozambique (2007) | Overall, there is low educational attainment and half of the Mozambique population has no education or only basic literacy. Unequal access is also an issue. [1 of 6] | ||
| Timor L’este (2017) | Lack of tertiary education has resulted in 30-40% of professional jobs being filled by foreign nationals. | ||
| Zambia (2011) | Low quality of human capital as well as limited access to secondary and tertiary education for the poor, resulting in low levels of employability of the Zambian population. |
- Education was NOT found as a constraint in the following countries (in alphabetical order): Benin, Cabo Verde II, El Salvador II, Ethiopia, Gambia, Ghana II, Honduras, Indonesia II, Jordan, Kenya, Kiribati, Kosovo, Lesotho II, Liberia, Malawi II, Moldova, Mongolia II, Mozambique II, Nepal, Niger, Philippines, Philippines II, Senegal, Senegal II, Sierra Leone THP, Sierra Leone, Solomon Islands, Sri Lanka, Tanzania II, Togo, and Tunisia.
- Labor market regulations or employment related aspects were found as constraints in the following countries: Kosovo (near binding, female participation rate), Morocco II, Tunisia (high fiscal and regulatory cost of employing workers)
- Health, a component of human capital, was found as a constraint in the following countries: Guatemala, Lesotho II, Mongolia II, Mozambique, Sierra Leone, Timor L’Este, Zambia
Annex II: MCC’s History of Education Investments: Linkage with Problems
The table below outlines MCC’s education and workforce development investments, and which were found to have education as a constraint, root cause, or neither, noting which were designed before these analyses were an MCC requirement.
| Country | Intervention Type | MCC Funding | Education Constraint | Education Root Cause | No CA; Not constraint or root cause |
|---|---|---|---|---|---|
| Burkina Faso | BRIGHT | $28.8M | No CA | ||
| Cote d’Ivoire | Secondary Education | $111.3M | Yes | Yes | |
| TVET | $35M | Yes | |||
| El Salvador | Human Development Project, Education and Training Activity (non-Formal Skills) | $5M | No CA | ||
| Human Development Project, Education and Training Activity (Formal Skills) | $16M | ||||
| El Salvador II | Education Quality (gen ed) | $69.5M | No | ||
| Education Quality (TVET) | $15.5M | ||||
| Georgia II | General Education | $73M | Yes | ||
| TVET | $15.7M | ||||
| Tertiary | $36.1M | ||||
| Ghana I | Education | $9.4M | No CA | ||
| Guatemala (THP) | Education Project: Secondary General Education | $14.6M | Yes | ||
| Education Project: Improving TVET in Upper Secondary | $4.7M | ||||
| Mongolia | Vocational Education Project | $49M | No CA | ||
| Morocco | Artisan and Fez Medina Project: Functional Literacy and Vocational Training | $32.8M | No CA | ||
| Morocco II | Secondary Education | $114.3M | Yes | ||
| Education and Training for Employability Project: Workforce Development Activity | $107.4M | ||||
| Namibia | Quality of Education (general ed) | $145M | No CA | ||
| Education Project: Vocational and Skills Training Activity (NTF/VTGF) | $28.4M | ||||
| Education Project: Vocational and Skills Training Activity (COSDECs) | $16.8m | ||||
| Niger (THP) | IMAGINE | $16.9M | No CA | ||
| Timor-Leste | Education | $40.2M | Yes |
Annex III: Mincer Regressions
Mincer specification.
The table below provides several Mincer regression specifications that can be used to inform the analysts work and decision on the specific parameters to use within a CBA model. It is paramount that the analyst assess the results across these findings to determine the base case value for the main CBA model, and then the ranges or alternative scenarios to consider in the sensitivity analysis.
The first column provides the regression specification, and the second column indicates the strengths, weaknesses and limitations of the results from that specification. 91 The general definitions of the variables included in the table are as follows:
- ln ( y ) is the natural log of monthly income from labor earnings (e.g., salary and wages).
- S is a variable for years of schooling
- r is the returns to schooling
- X is potential work experience, equal to Age – Education – 5; 92
- μ 1 is the error term
| Specification | Description of Use (strengths, weaknesses, limitations, etc.) |
|---|---|
Simple Regression: | Here, ‘r’ is interpreted as the average returns to an additional year of schooling. The results do not separate returns by the different school levels. This is the most commonly reported finding. This option may be less ideal for the CBA because we know that there are often great differences by education level, which would not be captured here and highly relevant for understanding potential results of a given intervention. |
Level of School Completion (3 variables): | This specification includes three dummy variables for completion of primary, secondary, and tertiary, with less than primary school as the omitted category. The results provide returns to the highest level of education obtained, where each individual would only have one of the dummies equal to ‘1’ or all equal to ‘0’ if they did not complete primary. As opposed to the ‘simple regression’, the coefficients (r1, r2, and r3) require explanation on how to interpret. This distinction by level would be helpful for understanding potential intervention impacts against a counterfactual, especially if data is available across time. One weakness is that this specification does not allow the analyst to tease out the “sheep skin” effects (obtaining an additional year of schooling vs obtaining a diploma for completion), as is done in the following specification. |
Level of School Completion (5 variables): | This specification includes five dummy variables for primary completed, incomplete secondary, complete secondary, incomplete higher, complete higher, with less than primary school as the omitted category. The construction of the variables and the interpretations of the results are similar to that described above (see footnote 11). The benefit of this specification is that the analyst can observe the “sheep skin” effects of receiving a diploma and completing some portion of a given level of education. On the other hand, few countries may report results in this way, so it may complicate country comparisons. |
| Heckman Selection Model: See Heckman’s paper for details on specification | This specification uses a two-stage estimator to utilize a simple regression method while addressing a selection bias that may occur by using a nonrandomly selected sample, as there are clear differences in behavioral functions between those that make decisions around schooling and work. The use of this model was discussed at length and was ultimately discarded as a viable option due to the inability to reliably estimate a selection model using an instrument that affects probability of employment but does not affect earnings. In the absence of a valid instrument, the Heckman model does not appear to perform better than the general Mincer, and could possibly perform worse, due to collinearity issues between the Heckman corrector and the second-stage regressors. For the purposes of the Constraints Analysis, the results would not be comparable to other countries, as this approach is not commonly used, and furthermore as noted above, the comparison across countries helps to eliminate this issue because the same bias occurs in all country estimates. |
| Specifications for Deeper Examination | |
Identify Gender Disparities: Women: Men: | There are two main ways in which the gender differential can be estimated. Both are represented for the simple regression but can easily be used for the other two specifications as well. First, there is the option to include a gender dummy (F) this means it is equal to one for female and zero for males. The coefficient is likely to be negative indicating a lower income earned by women. The is to run two separate regressions for women and men, as this elucidates differences in returns to schooling (r), rather than simply demonstrating what we already know – women make less than men on average. This appears to be particularly important in the developing country context, where significant differences in education and labor pathways. |
| Identify other potential differences: urban/rural, indigenous/non-indigenous, job type or employer (public vs. private), types of education (TVET, university, public/private, etc.) | It is not recommended that these terms be included in the above specifications as they are plausibly endogenous and collinear with (or causally affected by) education, and so may bias the education coefficient. However, the inclusion of these potentially endogenous factors as dummies in one of the above specifications or running separate regressions ( ) can illuminate country-specific characteristics of employment and education returns. As with gender, the difference in income between groups is known, but an understanding of their returns is seen more clearly when separate regressions are run. |
| Probability of Employment | Regressions on the probability of employment can provide a more holistic view of the labor market at a specific point in time and across time (if data is available). For example, in some countries we have seen that higher levels of education for women may not significantly increase wages, but drastically increase the probability of employment. Variables such as urban/rural, gender, social class, level of education, socioeconomic status, type of degree, etc. can be very useful in explaining gaps in employment status. |
| Cohort and Across Time | Running separate regressions by specific cohorts can assess changes in returns to schooling over time. The general Mincer will reveal average returns to schooling. However, it may be that younger workers received different schooling than older workers due to investments or changes in public schooling programs, historical events, etc. Separating observations into cohorts and comparing cohorts can reveal differences in returns to schooling over time. |
Sample and Variable Considerations and Adjustments for Mincers:
- Include adults of working age and run regressions only for employed workers . Common practice is to run Mincer regressions for the population of adults aged 16 to 65 years of age that receive a non-zero income (i.e., working). Although the appropriate age range may differ slightly across countries, a common range provides ease in comparing across countries and to regional and world averages. One clear weakness is that this would not include women who provide non-remunerated domestic work.
- Include all adults of working age . To capture in-country differences and insights into the structure of the labor market, the analyst can also add one-unit of income to all zero-income observations (as natural log of zero does not exist and will drop these observations from the regression sample) and this will provide returns for all adults of working age, whether or not they are currently working.
- Standard adjustments to years of schooling as needed . Regarding the experience terms, using a measure of potential rather than actual experience is common practice given the absence of more complete data on work history. In the event that data is not available for actual years of schooling, it is recommended that for individuals whose highest level of education is “some” level of schooling – but not a completed level – that the years of education be imputed by taking the average number of years between the lower and higher levels. For example, if primary school is five years and secondary school is an additional five years, a person who reports having “some secondary school” as their highest level of education should be coded as having 7.5 years of education. Results would need to be interpreted with caution.
- Adjust income to reflect real labor earnings . The purpose is to discover the returns to labor income, which is assumed to be closely related to individual productivity and returns to the employment of labor. Therefore, the analyst should separate labor and non-labor income (e.g., transfers, remittances, interest or other capital gains, or rent, etc.), if possible. Some surveys measure consumption instead of income. This is a second best alternative that should be fine for in-country analysis but would not allow for meaningful comparisons to other countries since income is the variable of choice. Additionally, it is preferred to measure and test earnings over smaller periods of time (i.e., hours, days, weeks) than over longer periods of time (i.e., months or years). This will help to reduce recall biases, and wages per hour are a better measure of productivity than annual earnings if there is significant variation in employment over a year. However, understanding in-year variations may be important for the country context, taking note of survey timing with relation to agricultural seasons and other potentially meaningful variations.
Annex IV: TVET program type and skills focus
| Program type and skills focus | El Salvador I | Mongolia | Morocco I | Namibia | Côte d’Ivoire | El Salvador II | Georgia II | Guatemala | Morocco II |
|---|---|---|---|---|---|---|---|---|---|
| Year compact signed | 2006 | 2007 | 2008 | ||||||
| Pre-employment training | X | X | X | X | X | X | X | X | |
| Training for unemployed/ inactive youth or adults | X | X | X | X | |||||
| In service training | X | X | X | X | X | ||||
| Industry-focused skills training | X | X | X | X | X | X | X (it appears) | X | |
| General skills/literacy/ remedial/soft skills training | X | X | X |
- For individuals who are still in the formal schooling system, i.e., who have not entered the labor market, or who are currently working but in a different field, so the program provides training prior to entering the targeted field.
- Skills training (basic remedial or industry focused) for those who are no longer in formal schooling, and who are currently unemployed or economically inactive, i.e., out of the labor force.
- In service training for those who are employed in the field, typically provided by private employers alone or in partnership with the public sector
- The El Salvador I Human Development Project had two distinct programs: a formal activity directed at improving an existing TVET center (part of the formal education sector directed at students still in school) and an informal training activity of short skills course for informal occupations directed at vulnerable, out of school populations (rural poor, women, youth)
- For the formal activity, there was some internships provided to students
- Morocco I provided both basic literacy training and technical training to traditional artisans in several fields and to individuals seeking to enter these occupations.
- The Namibia Community Skills Development Center Sub-Activity rehabilitated or constructed and equipped community-based vocational institutes to serve primarily disadvantaged out of school youth, while the Vocational and Skills Training Activity focused on in school youth as part of the formal education system.
Annex V: Program Components of MCC TVET Projects
| Program component | El Salvador I | Mongolia | Morocco I | Namibia | Côte d’Ivoire | El Salvador II | Georgia II | Guatemala | Morocco II |
|---|---|---|---|---|---|---|---|---|---|
| Infrastructure and equipment (for new or renovated centers) | X (formal sub-activity) | x | x | x | x | x | x | ||
| O & M | x | ||||||||
| Curriculum/degree program development1 | X (formal sub-activity) | x | x | X | x | X | x | X | |
| Develop accreditation/ occupational training standards | x | x | X | x | |||||
| Assistance for teacher training or certification | X (formal sub-activity) | x | x | X (for community based centers sub act) | x | x | |||
| TVET sector management, governance reform/ funding, accountability mechanisms | x | X (for Vocational and Skills Training sub act) | X | x | X | x | x | ||
| Internships/apprenticeships to supplement classroom learning | X | X | X | X (implicit) | X (expected as part of grant apps)) | X | X | ||
| Mechanisms for continuous feedback from labor market to TVET | X | x | X | x | X | ||||
| Tracer system to track graduates | |||||||||
| Labor observatory/labor market information system | x | x | |||||||
| Job placement, employment services | x | x | x | ||||||
| GSI/Inclusion (outreach, quotas, scholarships, special programs, etc.) | X | X | x | x | x | x | x | ||
| Scholarships | X (formal sub-activity) | x |
- Refers to direct support of this activity. May also be supported indirectly through grants to private TVET centers
- For unemployed youth and economically inactive women, Morocco II provides job placement services to be funded through results-based financing. The remainder of the activities concern pre-labor market entry programming.
- Labor observatory/labor market information system differ from ‘mechanisms for continuous feedback from labor market to TVET’ in that they are broader, providing information to the government, public and various stakeholders whereas the latter are specific components of the TVET sector.
- A number of the artisan training centers receiving grants focus on women artisans.
Almeida, Rita; Behrman, Jere; Robalino, David. 2012. The Right Skills for the Job? Rethinking Training Policies for Workers. Human Development Perspectives. Washington, DC: World Bank. http://hdl.handle.net/10986/13075 License: CC BY 3.0 IGO .”
Asian Development Bank. Guidelines for the economic analysis of projects, Appendix 18. 2017. https://www.adb.org/documents/guidelines-economic-analysis-projects
Bacher-Hicks, Andrew, Thomas J. Kane, and Douglas O. Staiger. 2014. “Validating Teacher Effect Estimates Using Changes in Teacher Assignments in Los Angeles.” NBER Working Paper No. 20657.
Barro, Robert J. (1991). “Economic Growth in a Cross-Section of Countries.” Quarterly Journal of Economics , 106(2), pp. 407-443.
Benhabib, Jess and Spiegel, Mark M. “Human Capital and Technology Diffusion.”December 2002. Forthcoming in Philippe Aghion and Steven Durlauf (eds.) The Handbook of Economic Growth, Amsterdam, The Netherlands: North-Holland, 2005
Boardman, A.E., Greenberg, D.H., Vining, A.R., & Weimer, D.L. (2011). Cost-Benefit Analysis: Concepts and Practice (5th ed.). Upper Saddle River, NJ: Pearson Education.
Borkum, E., Nichols-Barrer, I., Cheban, I., and Blair, R. Evaluation of the Georgia II Industry-Led Skills and Workforce Development Project. Mathematica. January 17, 2023. link
Burde, D. and Linden, L.L. “Bringing Education to Afghan Girls: A Randomized Controlled Trial of Village-Based Schools.” American Economic Journal: Applied Economics 5(3): 27–40. 2013. Link
Caselli, Francesco and Coleman, John Wilbur II. “The World Technology Frontier.” June 2005, American Economic Review .
Ciccone, Antonio y Elias Papaioannou (May 2006). Human Capital, The Structure of Production, And Growth. European Central Bank. Working Paper Series No. 623
Chetty, Raj, John N. Friedman, and Jonah E. Rockoff. 2014a. “Measuring the Impacts of Teachers I: Evaluating Bias in Teacher Value-Added Estimates.” American Economic Review 104(9): 2593–2632.
Chetty, Raj, John N. Friedman, and Jonah E. Rockoff. 2014b. “Measuring the Impacts of Teachers II: Teacher Value-Added and Student Outcomes in Adulthood.” American Economic Review 104(9): 2633-2679.
Davidson, E., de Santos, A., Lee, Y., Martinez, N., Smith, C., & Tassew, T. (2014). Bangladesh Inclusive Growth Diagnostic. USAID and DFID.
Davis, M., Ingwersen, N., Kazianga, H., Linden, L., Mamum, A., Protik, A., and Sloan, M. Ten-Year Impacts of Burkina Faso’s BRIGHT Program. Mathematica. August 29, 2016. Link.
Dee, Thomas S., “Are There Civic Returns to Education?” Journal of Public Economics 88 (2004), 1697–1720.
Duckworth, A.L., & Yeager, S. (2015). “Measurement matters: Assessing qualities other than cognitive ability for educational purposes”. Educational Researcher , 44(4), 237-251.
Dumitrescu, A., Levy, D., Orfield, C. and Sloan, M. Impact Evaluation of Niger’s IMAGINE Program: Final Report. Mathematica. September 13, 2011. link
Evans, David K., and Anna Popova. “What Really Works to Improve Learning in Developing Countries? An Analysis of Divergent Findings in Systematic Reviews.” World Bank Policy Research Paper 7203. Washington, DC: World Bank Group, February 2015.
Hanushek, Eric A., Guido Schwerdt, Simon Wiederhold, and Ludger Woessmann. 2015. “Returns to Skills Around the World: Evidence from PIAAC.” European Economic Review 73: 103-130.
Hanushek, Eric A., and Ludger Woessmann. 2012a. “Do Better Schools Lead to More Growth? Cognitive Skills, Economic Outcomes, and Causation.” Journal of Economic Growth 17:267-321.
Hanushek, Eric and Ludger Woessmann 2012b. Schooling, educational achievement, and the Latin American growth puzzle. Journal of Development Economics, 99 pp.497-512.
Hanushek, Eric A. 2010. “The Economic Value of Higher Teacher Quality.” NBER Working Paper No. 16606.
Hanushek, Eric A., and Lei Zhang. 2009. “Quality-Consistent Estimates of International Schooling and Skill Gradients.” Journal of Human Capital 3(2): 107-143.
Hanushek, Eric A., and Ludger Woessmann. 2008. “The Role of Cognitive Skills in Economic Development.” Journal of Economic Literature , 46 (3): 607-68.
Hausmann, R., Rodrik, D., and Velasco, A. ‘Growth Diagnostics’ 2005. John F. Kennedy School of Government, Harvard University. https://growthlab.cid.harvard.edu/files/growthlab/files/growth-diagnostics.pdf
Heckman, J., Moon, S.H., Pinto, R., Savelyez, P.A., and Yavitz, A. The Rate of Return to the HighScope Perry Preschool Program. Journal of Public Economics 94 p.114 – 118. 2010. https://heckmanequation.org/wp-content/uploads/2017/01/HeckmanMoonPintoSavelyevYavitz_RateofReturnPerryPreschool_2010.pdf
Heath, Rachel and Seema Jayachandran. 2018. “The Causes and Consequences of Increased Female Education and Labor Force Participation in Developing Countries” in the Oxford Handbook on the Economics of Women , ed. Susan L. Averett, Laura M. Argys and Saul D. Hoffman. New York: Oxford University Press.
Ianchovichina, E. and S. Lundstrom. 2009. “Inclusive Growth Analytics: Framework and Application.” Policy Research Working Paper No. 4851. Washington DC: World Bank.
Karoly, Lynn A. The Economic Returns to Early Childhood Education. (2016) https://files.eric.ed.gov/fulltext/EJ1118537.pdf
Klasen, S., T. Le Thi Ngoc, J. Pieters, and M. Santos Silva (2020). ‘What Drives Female Labour Force Participation? Comparable Micro-Level Evidence from Eight Developing and Emerging Economies’. Journal of Development Studies, 57: 417–42.
Larreguy HA and Marshall J (2017) The Effect of Education on Civic and Political Engagement in Nonconsolidated Democracies: Evidence from Nigeria. Review of Economics and Statistics 99 (3): 387–401 Levin, H.M., McEwan, P.J, Belfield, C., Bowden, A.B., & Shand, R. (2018). Economic Evaluation in Education: Cost-Effectiveness and Benefit-Cost Analysis (3rd ed.). Thousand Oaks, California: SAGE Publications, Inc.
Lazear, Edward P. 2003. “Teacher Incentives.” Swedish Economic Policy Review 10: 179-214.
Mankiw, N. Gregory; Romer, David, and Weil, David N (Mayo 1992). “A Contribution to the Empirics of Economic Growth.” Quarterly Journal of Economics, 107(2), pp. 407-437.
Milligan, Kevin, Enrico Moretti, and Philip Oreopoulos, “Does Education Improve Citizenship? Evidence from the United States and the United Kingdom,” Journal of Public Economics 88 (2004), 1667–1695.
Mincer, Jacob. Schooling, Experience, and Earnings . New York: Columbia University Press. 1974.
Mulligan, Casey B. 1999. “Galton Versus the Human Capital Approach to Inheritance.” Journal of Political Economy 107(6): S184-S224.
Murnane, Richard J., John B. Willett, Yves Duhaldeborde, and John H. Tyler. 2000. “How important are the cognitive skills of teenagers in predicting subsequent earnings?” Journal of Policy Analysis and Management 19(4): 547-568.
Nelson, Richard R. and Phelps Edmund S. “Investment in Humans, Technical Diffusion, and Economic Growth.” American Economic Review, March 1966, 56(1/2), pp. 69-75.
Null, Clair, Clemencia Cosentino, Swetha Sridharan, and Laura Meyer. “Policies and Programs to Improve Secondary Education in Developing Countries: A Review of the Evidence.” White Paper. Princeton NJ: Mathematica Policy Research. August 1, 2017. https://www.mathematica-mpr.com/our-publications-and-findings/publications/policies-and-programs-to-improve-secondary-education .
Popova, Anna, David K. Evans, and Violeta Arancibia. Training Teachers on the Job: What Works and How to Measure It . World Bank Policy Research Working Paper 7834. 2016
Pritchett, Lant. 2001. Where Has All the Education Gone?. World Bank Economic Review. © Washington, DC: World Bank.
Psacharopoulos, George; Patrinos, Harry Anthony. 2018. “Returns to Investment in Education: A Decennial Review of the Global Literature”. Policy Research Working Paper; No. 8402. World Bank, Washington, DC. World Bank. https://openknowledge.worldbank.org/handle/10986/29672 License: CC BY 3.0 IGO.”
Psacharopoulos, George, and Zafiris Tzannatos. “Female labor force participation: An international perspective.” The World Bank Research Observer 4, no. 2 (1989): 187-201.
Revenga, Ana and Dooley, Meagan. (2020) The constraints that bind (or don’t): Integrating gender into economic constraints analyses. Working Paper #137 Global Economy and Development at the Brookings Institution https://www.brookings.edu/wp-content/uploads/2020/04/Constraints-that-Bind.pdf
USAID. Education Activities Office of Education, Bureau for Economic Growth, Education, and Environment (E3). 2018. “Cost Reporting Guidance for USAID-Funded Education Activities”. https://pdf.usaid.gov/pdf_docs/PA00X69X.pdf
World Bank, Independent Evaluation Group. Later Impacts of Early Childhood Interventions: A Systematic Review. Working Paper. 2015. https://ieg.worldbankgroup.org/sites/default/files/Data/Evaluation/files/ImpactsofInterventions_EarlyChildhoodonLaterOutcomes.pdf
Bowen, Derick H., and Guyslain K. Ngeleza. Land Sector Cost-Benefit Analysis Guidance. June 1, 2019. https://www.mcc.gov/resources/doc/land-sector-cost-benefit-guidance
Carter, Andrew. Transportation Sector Cost Benefit Analysis Guidance. September 2020. [not yet published externally: internal link .]
Department of Compact Operations (DCO), Infrastructure, Environment and Private Sector (IEPS). “Vertical Structures Development and Implementation Guidelines’. July 2021.
Epley, Brian, Francis Mulangu, and Derick Bowen. Power Sector Cost-Benefit Analysis Design Principles. July 2021. https://www.mcc.gov/resources/doc/guidance-power-sector-cost-benefit-analysis
Heintz, Jenny. Insights from General Education Evaluations, September 2022. Millennium Challenge Corporation.
Myers, Jenn, Stefan Osborne, and Onay Payaam. Health Sector Cost-Benefit Analysis Guidance. Forthcoming.
Millennium Challenge Corporation. Economic Analysis Division. Cost Benefit Analysis Guidelines. June 24, 2021. https://www.mcc.gov/resources/doc/cost-benefit-analysis-guidelines
Millennium Challenge Corporation. Policy for Monitoring and Evaluation. March 15, 2017. https://www.mcc.gov/resources/doc/policy-for-monitoring-and-evaluation
Osborne, Stefan. Water Supply and Sanitation Sector Cost-Benefit Analysis Guidance. May 1, 2019. https://www.mcc.gov/resources/doc/water-sector-cost-benefit-guidance
Patel, Shreena and Sobieski, Cindy. “Independent Evaluation at MCC: An Evolving Practice 18 Year On.” January 2023. https://www.mcc.gov/resources/doc/paper-independent-evaluation-at-mcc
Ricou, Marcel & Moore, Ryan. “Training Service Delivery for Jobs & Productivity: MCC’s Lessons Learned in Technical and Vocational Education and Training.” 2021. https://assets.mcc.gov/content/uploads/paper-2020001233801-p-into-p-tvet.pdf
Szott, Aaron and Mesbah Motamed, Agriculture Sector Cost-Benefit Analysis Guidance. March 31, 2023. https://www.mcc.gov/resources/doc/agriculture-sector-cost-benefit-analysis-guidance
Tracy, Brandon. Guidance for MCC Economic Analysis of the Power Sector. 2013. MCC.
2023-001-2839-01
Budget Snapshot: Education Funding in State Budget for FYs 2024 and 2025
Jun 6, 2023 - 2 minutes
On June 6, 2023, the Connecticut General Assembly passed a new state budget for fiscal years 2024 and 2025 that increases funding for K-12 education to historic levels.
The budget increases total K-12 education funding by $435 million over the next two years, accelerates full funding of the Education Cost Sharing (ECS) formula, increases funding for the Excess Cost grant for students with extraordinary special education needs, and includes $150 million for public schools across the state.
This nonpartisan, independent analysis summarizes policy and funding changes related to K-12 education that are included in the budget and provides estimated town-by-town runs for the Education Cost Sharing (ECS) grant. Below are some of the key education policies and funding changes in the adopted budget.
- ECS formula’s phase-in schedule is accelerated in FY 2025 to “speed up” funding (56.5% of balance).
- Full funding of the ECS formula is sped up by two years so towns will receive their full grant in FY 2026 instead of FY 2028.
- Towns considered "overfunded" according to the ECS formula , which are currently scheduled to receive decreases in their ECS grants for FYs 2024 and 2025, will be "held harmless" and receive their FY 2023 funding amounts for both fiscal years instead.
- $68.5 million for local and regional public school districts
- $40.2 million for RESC-operated magnet schools
- $13.3 million for magnet schools operated by local and regional public school districts
- $11.4 million for the Open Choice program
- $9.4 million for state charter schools
- $7.2 million for AgriScience programs
- Funding for Excess Cost grant is increased by $25 million over current level to support students with extraordinary special education needs and associated costs.
- Tuition for magnet schools and AgriScience programs is capped at 58% of FY 2024 levels, starting in FY 2025.
- Funding for the Open Choice program is reduced to reflect enrollment changes, however, due to due to an appropriation of $11.4 million from the Education Finance Reform line item, the Open Choice program will receive an overall increase in funding.
- Funding for state charter schools is increased by $600,000 in FY 2024 and $3 million is provided in FY 2025 for new charter schools in New Haven and Norwalk.
- $16 million is provided in FY 2024 to extend free school meals to all students from families making at or below 200% of the federal poverty line.
School and State Finance Project. (2023). Budget Snapshot: Education Funding in Adopted Budget for FYs 2024 and 2025 . Hamden, CT: Author. Retrieved from https://schoolstatefinance.org/resource-assets/State-Budget-FYs-2024-and-2025-Education-Snapshot.pdf.
- Education Funding
- Funding Formulas
- State Budget
- State Revenue & Spending
Stay Up-to-Date
Sign up to get new reports and the latest data sent right to your inbox.
Thanks, you'll receive a confirmation email shortly.
We care about the protection of your data. Read our Privacy Policy.
Getting both costs and effectiveness right to improve decisionmaking in education
Subscribe to the center for universal education bulletin, emily gustafsson-wright and emily gustafsson-wright senior fellow - global economy and development , center for universal education @egwbrookings dayoung lee dayoung lee associate partner - dalberg advisors.
December 23, 2021
Despite increases in access to education, we face a global learning crisis: In 2019, it was estimated that over half of children in low- and middle-income countries (LMICs) could not read and understand a simple text by the age of 10. The COVID-19 crisis has only exacerbated this learning poverty, as school closures have resulted in an increase to an estimated 70 percent of children in LMICs experiencing learning poverty today. In order for funders to successfully help reverse the learning crisis, they will require explicit information on both the costs and effectiveness of education interventions to make informed decisions.
While recently there has been increasing attention to measuring and ensuring an intervention’s effectiveness, there is a paucity of high-quality cost data and even less on how it relates to effectiveness. In a resource-constrained world, not having the full picture means donors, policymakers, and education organizations cannot make informed investment decisions. For example, with cost-effectiveness information a funder might consider a somewhat less effective intervention to be a better investment if it is much cheaper, thus allowing many more students to benefit. For program implementers, understanding the cost-effectiveness of different levers within their interventions can help them double down on those that drive the greatest value, and let go of resource-intensive activities that make little difference in student outcomes. Furthermore, an understanding of what cost-effective interventions should cost provides a good target for implementers as they design programs, and for funders to reference as they set budgets and expectations for their grantees.
Given the double burden of the learning crisis and constrained government and donor budgets, spending must be oriented toward smart investments in future outcomes. More than ever, it is critical to have quality data on costs and evidence on cost-effectiveness.
We at the Center for Universal Education (CUE) at Brookings and Dalberg have independently been working to improve access to resources and evidence to contribute to the global knowledge base on costs and effectiveness and the combination of the two. CUE, as part of a broader project focused on the collection, analysis, and use of data to achieve learning outcomes in education and early childhood development (ECD), initiated research on costs and costing data in 2014. Dalberg Advisors, in partnership with British Asian Trust, UBS Optimus Foundation, and the Foreign, Commonwealth and Development Office (FCDO), have recently assessed the cost-effectiveness of education interventions in government schools in India and analyzed how results-based financing mechanisms and COVID-19 may change them.
At CUE, this effort is two-pronged: The Center co-leads with the ECD Action Network (ECDAN) a costing working group, the Global Education and ECD Costing Consortium (GEECC), aimed at improving awareness of and access to costing resources and cost data. In addition, CUE is in the process of finalizing the Childhood Cost Calculator (C3) , intended to facilitate cost analysis exercises, often referred to simply as “costing” of ECD and basic education interventions and programs. C3 is an online, soon-to-be publicly accessible costing tool that allows the user to enter costing data in a guided survey form that can provide a range of calculations, estimates, or simulated costs. This calculator was based on the Standardized ECD Costing Tool (SECT) , which was developed earlier by CUE with the aim of providing methodological consistency to costing the full range of ECD interventions and to generate costing data for policymakers, donors, program implementers, and researchers to make informed and effective investment decisions.
C3 aids in answering the following questions:

The tool includes a number of different cost classifications such as: cost categories, resource types, investment versus recurrent costs, and imputed (donated) resource costs. It also includes functionalities such as currency conversions and amortization. Data collected through C3 costing exercises will be available in the Cost Data Explorer, an interactive database available on the website where the tool is housed. This will allow funders, implementers, and policymakers to explore the range of costs by type of program and context facilitating their decisionmaking processes. In the first quarter of 2022, CUE will pilot C3 in several countries and plans to launch it in the second quarter, so stay tuned for more information on using this resource very shortly.
Cost-effectiveness
The cost-effectiveness study in India by Dalberg and its partners is a starting point in plugging important knowledge gaps around effective ways to support student learning. It provides guidance on what costs to expect per learning outcome for effective education interventions in India and on what to invest in and for how much. The impetus for the study was the availability of robust cost and effectiveness data from the Quality Education India Development Impact Bond (QEI DIB). As payments are tied to results, an impact bond generates some of the purest cost and effectiveness data in the education sector. One of QEI DIB’s aims was to measure such data on a range of education delivery models to inform the allocation of future funding in the Indian education sector. This study augmented the QEI DIB intervention data with high-quality evidence on about 20 additional programs.
The study found that it costs around $13-40 per student (or about 5-15 percent of annual expenditure per student) for high-quality in-person interventions in government schools in India to deliver an additional year of learning beyond what an average student learns. Remedial and Teaching at the Right Level (TaRL) interventions are among the most cost-effective measures that can be easily adopted, while education technology can be powerful when combined with the right infrastructure and human resources. Another key finding was that QEI interventions led to a 50 percent increase in outcomes when compared to similar grant-funded programs, even though the costs were not higher.* This finding signals a vast potential for outcomes-based financing mechanisms to improve cost-effectiveness through higher transparency and accountability.
While it serves as a good starting point, the study could only assess six types of interventions because there was limited cost and effectiveness data for other interventions. It also leaves several important questions unanswered, such as how the cost-effectiveness of interventions differs across key demographic and contextual differences (e.g., gender, rural versus urban schools, and high- versus low-capacity states). Tools such as CUE’s C3 could be extremely useful to collect better costing data alongside the effectiveness data.
An outcomes-oriented future
Given the double burden of the learning crisis and constrained government and donor budgets, spending must be oriented toward smart investments in future outcomes. More than ever, it is critical to have quality data on costs and evidence on cost-effectiveness. Moreover, as funders increasingly tie funding to outcomes, either through traditional results-based financing or impact bonds and outcomes funds , the need to more accurately price outcomes will rise. We are seeing this, for example, with the establishment of the Education Outcomes Fund , which will be launching projects in Ghana and Sierra Leone, and a soon-to-be-launched Back-to-School Outcomes Fund in India. If prices are set too low, these initiatives may not attract enough implementing partners to participate, while if set too high, they will not provide enough value for funders. Cost-effectiveness benchmarks help set smart outcome prices, and ultimately encourage innovation by incentivizing implementers to achieve outcomes within these set prices.
*Note: This does not imply that program budgets should be reduced going forward. There are certain fixed costs per child—even if more outcomes can be expected per child, costs may not be reducible.
Related Content
Sarah Osborne, Emily Gustafsson-Wright
December 17, 2020
Emily Gustafsson-Wright, Izzy Boggild-Jones
September 20, 2019
Emily Gustafsson-Wright, Sarah Osborne, Aarushi Sharma
May 6, 2021
Brookings is committed to quality, independence, and impact in all of its work. Activities supported by its donors reflect this commitment and the analysis and recommendations are solely determined by the scholar. Support for this blog post was provided by the British Asian Trust.
Early Childhood Education
Global Economy and Development
Center for Universal Education
Sofoklis Goulas
June 27, 2024
June 20, 2024
Modupe (Mo) Olateju, Grace Cannon, Kelsey Rappe
June 14, 2024

- Our Approach
- Live Events

Comparing Higher Education Construction Costs
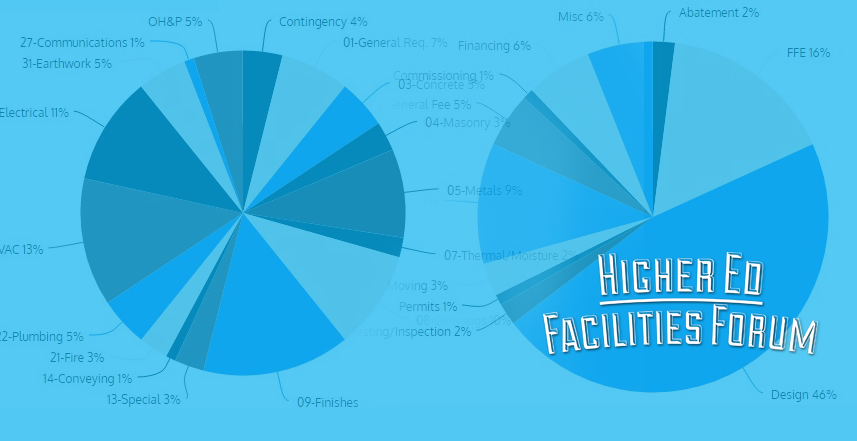
The first hurdle that has to be overcome is to clearly define what is a “hard” and what is a “soft” cost. There are almost as many owner delivery models and cost accounting models amongst American Universities as there are American Universities. In order to remove this source of variability, a very purist definition of hard costs being defined as “construction and construction contingency”, and soft costs being defined as “everything else” was used to help sort the data for consistent comparisons. To further categorize hard costs, the Construction Specifications Institute’s MasterFormat ® system was used.
The second hurdle is to get access to data that can be categorized and compared. As it turns out, this is not a hurdle at all. Most universities are willing to share data as well as best practices and there are many professional forums that assist with this sharing and benchmarking. Stanford University’s Department of Project Management hosts one of the best examples of this type of cooperation with their Benchmark database . Data from 108 recent projects from across the country, totaling over 12 million square feet and over $7B was used for this analysis. A Northwestern University sponsored survey collected detailed data from an additional 19 respondents on 60 current projects, totaling over 5 million square feet and over $3B, which was also used in this analysis.
The final hurdle is to remember that the data is self-reported and does not represent all projects in the higher education portfolio. Although an attempt is made to ensure that the below results are directionally correct with national sources such as RSMeans Building Construction Cost Data and Engineering News-Record Construction Economics , the data analyzed is not accurate enough to be conclusive nor is the sample size large enough overcome effects from outliers. That said, the results do serve to provide a benchmark to allow higher education construction leaders to isolate opportunities for improvement within their respective program.

Result Number 1. Higher education construction is booming in both the public and private sector. Research is leading the pack with 35% of the reported projects being new or renovated laboratories. New or renovated residence halls account for 16% of the projects, new or renovated classroom buildings account for 13% , and new or renovated office buildings account for 11% of the reported projects. All other primary use types reported make up only 25% of the projects.
The below table shows that the number of projects, the scope of the projects and the cost of the projects are not always proportional. Scope is reported in millions of square feet (sf) and unless otherwise noted, this refers to gross square feet constructed or renovated.

Result Number 2. Even within the higher education portfolio, there is expected variability in project cost by primary building program. Several universities and hospitals reported healthcare occupancy projects in the Northwestern survey, but these were primarily fit-outs of existing space. As fit-outs, the average total project cost of $743/sf is more expensive than all but two higher education new construction categories.
New laboratory construction averages $812/sf . The lowest cost of $313/sf was reported as a laboratory, but the reported program descriptor would cause this project to be categorized as a classroom space at many universities. Wet laboratories dominate the upper end of the scale with the most expensive at $1,879/sf. 26% of the reported projects are over the $1,000/sf benchmark and are all high acuity wet labs by their program narratives. This subcategory has an average total project cost of $1,186/sf.
Student and Visitor Centers have a reported total project cost averaging $808/sf . Although the sample size is small for this category, the variability of total project cost between private universities, state universities and community colleges is smaller than all other categories in the higher education portfolio. Although inconclusive without more data, it appears that those institutions investing in this category of building are targeting similar outcomes regardless of their financial base.

Result Number 3. Once normalized for inflation using project start dates and for geographical diversity using area cost factors, the standard deviations in hard costs by category are reasonably small with the exception of laboratories as mentioned previously. Program acuity appears to be the significant driver.
There is variation in the ratio of hard costs to total project costs, (hard plus soft costs). The mean ratio of hard costs to total project costs is 0.72 and the mode is 0.70 , which correlates to 69% of the projects submitted.
Most higher education institutions report using a variety of construction contract vehicles with Request for Proposal and Guaranteed Maximum Price being primary. No significant project hard cost difference is attributable to construction contract vehicle choice in the data provided.
Contractor Overhead and Profit (OH&P) averaged 5% of hard costs, but varied greatly between 1.41% and 12.55% on respondent data. Typically, OH&P is tied to contractor risk. There is insufficient data to draw conclusions on the reasons behind this variability as it does not appear to be linked to institution type, project acuity or project schedule.
Contingency varied between 0% and 8% , with an average over the dataset of 4% . Drivers of this variability include construction contract vehicle type and accounting differences between institutions. Although not supported by data, many state and community schools have reported legislated accounting practices that impact the project contingency line.
General Requirements (Conditions) averaged 7% and varied between 3% and 13% of hard costs for the projects submitted. There was a larger correlation to the institution as the driver than to category of project.
Construction Specifications Institute (CSI) section 09 for Finishes averaged 15% of hard costs with strong correlation both by institute and project category for the higher education portfolio. Additionally, CSI section 23 for Heating, Ventilation and Air Conditioning averaged 13% of hard costs and has a strong correlation to project category with no significant correlation to geographical location.
The below graph breaks out hard cost averages by CSI section across the portfolio:

Result Number 4. Soft costs were also normalized for inflation using project start dates and for geographical diversity using area cost factors. Whereas this is standard practice for hard cost normalization, there was not a clear direction on appropriateness for soft costs. In the end, it was determined that applying the area cost factors allowed a directional correctness for comparisons across the country.
There is much greater variability in soft costs than in hard costs attributable to multiple models of project management reimbursement and project accounting across the higher education portfolio.
Reimbursement models include centrally funded, fully reimbursable through a project charge and hybrids between the two. Those that are in a fully reimbursable or hybrid model have charges that range from $1/sf to $25/sf . Regardless of the model, about 75% of the respondents listed a University Fee separate from a reimbursable project management fee and about half list a separate finance charge.
Nearly all respondents are commissioning their facilities. The average cost of commissioning is 1% of the total soft cost and ranges from $0.56/sf to $1.86/sf .
Permit fees have the greatest variability of all hard and soft costs reported. The respondent average is 0.3% of hard costs, but the range is between 0.15% to nearly 2% of hard costs.
Design is the largest soft cost averaging 47% of this category. Furniture, Fixtures and Equipment (FFE) averages 16% of soft costs across the dataset, although several projects had no costs for FFE and several university models made FFE procurement a responsibility of the end user and accounted for separately. The below graph breaks out the soft costs by category.

Result Number 5. The average ratio of net to gross square feet for the projects sampled is 0.69 . New laboratories have the largest variation in net to gross feet with ratios as low as 0.45 and as high as 0.88 . The mean ratio for new laboratories is 0.59 and the project descriptors do not correlate net to gross with laboratory acuity.
The average net to gross square feet ratios by category are listed in the table below:

Conclusions:
- There is significant variation in how projects are managed and how costs are captured amongst the higher education sector.
- There is significant variation in the ratio of construction to total project cost, but the mean is 0.72 and the mode is 0.70 – submitted by respondents on 69% of the projects.
- New laboratories have the largest variation in net to gross square feet ratios with a low of 0.45, high of 0.88, mean of 0.59 and mode of 0.52.
The most important conclusion is that higher education portfolio managers are willing to share best practices and benchmark data in both formal and informal settings. This practice improves the national portfolio and reduces the overall cost to each institution and to the sector as a whole. Additionally, the data clearly shows that although each project is unique and many cost accounting, management models and construction delivery vehicles exist across the sector, both the hard and soft cost benchmarks are of a sufficient quality to use for parametric planning. Finally, the building program category remains the largest differentiator for both total project cost and net to gross ratio.
Join us in Scottsdale!
A one of a kind retreat for real estate, store development, design, operations & customer experience strategy leaders.
Sept 15 - 17, 2024 | Scottsdale, AZ

MOST POPULAR
Recent posts.

Travis Kalanick's Vision for the Future of Restaurants

Inaugural BankSpaces a Hit: Leaders Gathered to Imagine Branch of the Future

Whole Foods CEO Discusses New Small-Format Store and More at RetailSpaces

How CRE Leaders Are Humanizing ESG

The Future of Care in the Home: Predictions for the Next Decade
© Copyright 2024 influence group. All Rights Reserved
Project cost estimation: types and techniques for project success in 2024
Plus a 4-step process to calculate project costs as accurately as possible.
Table of contents
Project cost estimating is the process of predicting the total cost of the tasks, time, and resources required to deliver a project’s scope of work.
Unfortunately for project and resource managers, humans can’t see into the future 🔮 and that’s what makes cost estimation for projects a daunting task.
But even if you’re not a clairvoyant, there are several methods and tools to help you create cost estimates that will be close to the project’s actual cost. We’ll cover them below, including:
- What a project cost estimate is
- How to create one
- Methods and tools for cost estimation
Plus, we’ll also give you an example of how one of our customers figured out how to estimate costs for a new project.
What is cost estimation in project management?
Project cost estimation is the process of forecasting the financial resources required to complete a project successfully. It involves analyzing various factors such as labor, materials, equipment, overhead, and other expenses associated with the project to come up with an estimate of the total cost.
Cost estimation is a critical aspect of strategic project management as it provides stakeholders with valuable information for decision-making, budgeting, and resource allocation .
It helps ensure that projects are completed within budget constraints and enables project managers to identify potential cost overruns or risks early in the project lifecycle.
Imagine you’re a digital agency owner about to send a proposal to a client to revamp their website. Your main question is probably: How much is this going to cost us? Well, one way to figure that out is by looking back at a similar project you’ve tackled before: how long it took, who was involved, and what they charged per hour.
If you’ve been storing all this project info in a dedicated resource management tool , accessing these details should be a breeze.

<cta-box><image-color="yellow">
Get your project cost estimates right with resource management software
Rated #1 on G2 for resource management , Float helps your team accurately forecast project costs with a detailed view of your capacity, availability, and budget spend.
<cta-button> Try for free </cta-button>
</cta-box>
5 project cost estimation methods & techniques
You can estimate how much a given project might cost in different ways. Here are five cost estimation techniques and who they might work best for—but remember, this list is not exhaustive.
1. Analogous estimate
Analogous estimation is a top-down approach that uses historical data from similar past projects to estimate the cost of a new one.
Let’s say you want to estimate the cost of an advertising campaign for a new Netflix film: you’d look at the cost analysis of a past project that is similar in size and scope and make some adjustments based on changes in equipment, inflation rates, and resource costs.
This cost estimation technique is best for you if you have a reliable record of the cost and duration of past projects.
2. Bottom-up estimate
Bottom-up estimating is where you estimate the cost for individual tasks or components of a project and then sum them up to get to the total project cost.
It involves creating a work breakdown structure and including overheads for contingencies .
This cost estimation technique is best for projects with a well-defined scope and list of tasks.
3. Parameter estimate
Parameter estimation is a method that makes predictions or estimates based on specific characteristics or data points. It’s like making an educated guess using known factors or measurements.
For instance, a paid ad agency estimates that reaching the target audience on a specific platform might cost $4,000 based on past campaigns and the client’s objectives. So they project that creating multiple ad variations could cost $10,000, and they sum up these estimated costs to provide the client with an overall estimate for the advertising campaign.
Parametric estimation works best when you have a lot of information from similar projects in the past.
4. Three-point estimate
A three-point estimation is a way to calculate a project’s cost based on likely, optimistic, and pessimistic cost projections.
The benefit of a three-point estimation is that it ties a project’s costs to uncertainties and risks, which allows you to plan for "worst-case" scenarios.
Let’s say you’re to find the cost of building a new website. Your estimate could look like this:
💰 Likely cost: $10k 😃 Optimistic costs: $7.5k 😟 Pessimistic costs: $15k
These three figures become a basis for building an average estimate. Simply add them together and divide by three:
10,000 + 7,500 + 15,000 = 32,500
32,500 ÷ 3 = 10,833
As a result, the average project estimate is $10,833.
Three-point estimates are best for where there’s a lot of uncertainty or variability in the tasks or projects.
5. Ballpark estimate
A ballpark estimate will give you the approximate value of a project based on the combination of similar projects you’ve done in the past and expenses unique to the particular project.
Let’s say your client needs a website built and your team has done similar projects in the past for $10k. Using the ballpark estimate, the cost might range from -25% to +50% ($7.5k - $15k).
Ballpark estimates are best used when there’s limited information available like at the start of a project.
How to create accurate cost estimates using a dedicated tool
The cost estimation process we will outline below is best suited for you if
1. You are running a professional service business, not an internal project
2. You have some idea of how much things cost based on historical data
If you don’t have any historical cost data, you can skip to the section below this one to see how to estimate costs for new projects. Note that we will be using our tool, Float, throughout this example; if you are using a different tool (or none at all) some parts of this may not be applicable, but the overall approach remains the same. Here is how you can create accurate estimates:
1. Gather data from past projects
Start by collecting data from past projects that are similar in scope, size, and complexity to your current project. This data should include total costs, duration, resources used, and any other relevant information.
To find similar projects in Float, here’s what you would do:
- Head over to the Project tab in Float
- Toggle the project view options to “Archive” and voila, all your old projects will apply

If you don’t have any projects in Float, you can sign up for a free 14 day trial , import your project details in, and get started. You can learn how to get set up with this guide .
2. Identify variables and adjust costs
A few things (or a lot) might have changed since you worked on other similar projects. Before estimating costs for new projects, look for any changes from previous work like higher billing rates or pricier software like VFX instead of CGI.
Aside from cost, consider how durations might have to change. Check if certain phases in past projects took longer than expected and adjust for new projects accordingly.
You can easily check for variations in duration by heading to the Report page in Float and comparing the actual and scheduled time spent on tasks.

3. Create a tentative project to calculate the estimated costs
By now, you should have a good idea of the people, duration, and billing rates you need for the new project.
To get a good idea of how much will cost, create a tentative project in Float. You can do this by simply selecting Tentative on the project menu.

Then, allocate your team’s time to the project and set your budget type and billing rates. You can use placeholders if you plan to hire freelancers.
Because the project has been marked tentative, the new allocations will not affect your team’s time schedule .
Once you are done setting up the project, head over to the project report to check for the total estimated cost.
4. Review the estimate with your team
Verify the estimate with stakeholders, experts, or team members to ensure its accuracy. Different team members might notice things that were initially overlooked. This process helps uncover any missed details or factors in the initial estimate.
A real-life cost estimate example for new projects (without past data)
One of our customers , a marketing and communications company, took on a project they had never worked on before (we’re not going to share their name to protect their privacy 😉)
Since they had not done similar projects in the past, they anticipated a learning curve and expected to spend more time than initially scoped due to several potential client revisions.
To accommodate this uncertainty, they added buffers—increasing the estimated cost by 50% and extending the project duration from 30 to 45 or 50 working days.

These measures allowed them to manage additional costs caused by a slower pace and multiple rounds of client feedback.
Use resource management software to track and control costs in real-time
When your project budget gets a thumbs up, there lies a new challenge of cost management and control. The things to pay attention to never end!
This is where a dedicated resource management tool can help you not just make estimates, but also track spending as it happens, ensuring that you always know how much money is available and when you’re running out of funds.
And, yes: you can also do this in a spreadsheet. But if you track your projects in Float, you can just click on a project and see the entire budget. Ta-da!

Depending on the budget type you choose, you can either see the budget displayed in hours or currency.

You can see how much was spent per project phase and the remaining budget.
You can also keep tabs on your team’s hours and individual rates. And if there are cost overruns , Float alerts you by showing how much over budget your project is.
If you’re ready to take control of your project costs, sign up for a free trial today .
Forecast project costs with the #1 rated resource management software
More than 4,500 of the world’s top teams rely on Float to plan their projects, track budgets, and keep work on track.
Some FAQs about project cost estimation
What factors influence cost estimates.
Several elements can influence cost estimates. These cost elements include:
- Scope of work
- Material costs
- Equipment costs
- Project duration
- Market conditions
- Location factors
- Inflation rates
- Contingency allowances
Who performs project cost estimation?
Cost estimating can be performed by various individuals or teams depending on the nature and size of the project. This may include project managers, cost estimators, engineers, financial analysts, and other relevant stakeholders.
How can businesses choose tools and software for estimating costs?
Choosing the right estimating software depends on several factors, including the specific needs of your organization, the complexity of your projects, your budget, and the features you require.
Related reads
How to calculate fte for better resource (and budget) management.

Resource utilization: two calculation methods, benefits & a real-life example

How to create and manage timesheets effectively
Get exclusive updates on.
- Async communication
- Remote team culture
- Smart time management
Topics › Education

Policy Study
The cost of state hold harmless policies in k-12 education, with widespread public school enrollment losses in the wake of the covid-19 pandemic, the financial costs of some hold harmless policies have increased exponentially..

Executive Summary
Public school enrollment is falling fast, and hold harmless policies that provide funding protections for school districts are becoming increasingly costly. These policies can broadly be classified in two ways, with each type serving different aims.
Declining enrollment protections allow school districts to use previous, rather than current, student counts for funding purposes. This promotes stability by giving school districts time to adjust to revenue fluctuations caused by enrollment losses. Similarly, funding guarantees promise school districts a minimum level of state aid and are often used as a political bargaining chip to help legislators pass school finance reforms. Across states, many hold harmless policies were in place even before the COVID-19 pandemic.
But such hold harmless policies fund “ghost students” or set arbitrary funding floors, which have opportunity costs. For instance, these dollars could be otherwise devoted to raising per-student funding for all school districts or to directing greater funds to higher-need students.
Hold harmless policies also reduce the incentive for school districts to right-size operations or innovate in response to budget constraints. Finally, they run the risk of becoming entrenched in school finance systems over time, outliving their intended purpose.
In many cases, it’s unclear exactly how much these provisions cost and which districts benefit most from them. As a result, policymakers can’t easily assess their effectiveness or whether these resources could be put to better use for students. With widespread public school enrollment losses in the wake of the COVID-19 pandemic, the financial costs of some hold harmless policies have increased exponentially. This trend is likely to continue, with the National Center for Education Statistics projecting that nationwide public school enrollment will fall by 5.1% between 2021 and 2031 as many states continue to lose students. This, combined with the rise of school choice policies such as Education Savings Accounts and public school open enrollment, also raises the stakes for policies that effectively fund students twice.
This study shines light on the issue by assessing declining enrollment provisions across three states: California, Missouri, and Oklahoma. It also analyzes separate funding protections in California and Missouri. Because it is sometimes claimed hold harmless policies benefit low-income students, particular attention is given to trends related to school district poverty levels.
- In 2022-23, 789 of 931 school districts—or 84.7%—received declining enrollment funding. As a result, there were an estimated 400,974 ghost students statewide, costing the state $4.06 billion or 6.2% of total formula aid. Charter schools were not eligible for this funding.
- Los Angeles Unified School District had an estimated 50,417 ghost students, costing the state $507.74 million or $1,459 per student.
- On average, the state’s highest-poverty school districts weren’t the largest beneficiaries of declining enrollment funding per student.
- In 2022-23, 148 school districts received hold harmless funding via California’s Minimum State Aid (MSA) policy, which guarantees funding based on 2012-13 levels. The majority of these school districts (111) were property-wealthy districts that didn’t otherwise qualify for state formula aid. MSA funding for school districts totaled $186.1 million.
- In 2021-22, 256 of 518 school districts—or 49.4%—received declining enrollment funding. As a result, there were an estimated 44,997 ghost students statewide, costing the state $197.04 million or 4.7% of total formula aid. Charter schools were not eligible for this funding.
- In 2021-22, 200 school districts received hold harmless funding via Missouri’s large school hold harmless (LSHH) and small schools hold harmless (SSHH) provisions, which guarantee funding based on 2005-06 and 2004-05 or 2005-06 levels, respectively. Combined, these policies cost the state about $134 million and sent state aid to 17 property-wealthy school districts that otherwise wouldn’t qualify for state formula aid.
- Clayton and Brentwood—two of the highest-funded school districts in the state— received $546 per student and $580 per student in LSHH funding, respectively.
- In 2022-23, 155 of 541 school districts in Oklahoma—or 28.7%—received declining enrollment funding. As a result, there were an estimated 3,777 ghost students statewide, costing the state $14.03 million or 0.6% of total formula aid.
- The per-student amounts allocated through this provision were substantially lower than in California and Missouri.
3 Key Takeaways
Putting it all together, this study has three key takeaways for state policymakers.
1. Declining enrollment provisions can have substantial opportunity costs, but context matters.
Hold harmless policies divert dollars away from funding school districts based on current enrollment counts and students’ needs. California and Missouri illustrate how declining enrollment provisions can consume a substantial portion of state education budgets during periods of widespread enrollment losses. In comparison, Oklahoma allocated only a modest portion of its formula aid through its declining enrollment policy.
As declining enrollment provisions become costlier, policymakers can look to states such as Texas, Arizona, and Indiana, which all fund school districts solely based on current-year enrollment counts. Alternatively, lawmakers can make their declining enrollment provisions less generous, as Oklahoma did in 2021, by going from a two-year look back to a one-year look back.
2. Funding guarantees can allocate dollars arbitrarily and undermine state funding formulas.
Hold harmless policies can long outlive their intended purpose and arbitrarily benefit subsets of school districts at the expense of overall funding fairness. This is especially true of funding protections, which are often aimed at ensuring state aid for wealthy school districts.
For example, California’s Minimum State Aid (MSA) guarantee was designed to shield some districts from funding losses related to a funding formula overhaul in 2012-2013. This policy directed $126.6 million in state funds to 111 property-wealthy school districts that wouldn’t otherwise receive any state funding.
Although funding protections are entrenched in statute, lawmakers sign off on them each year they persist. Eliminating outdated hold harmless policies can be politically challenging, but is a worthwhile policy goal.
3. The relationship between declining enrollment funding and school district poverty rates is tenuous.
Across the three states examined, there isn’t a clear relationship between declining enrollment funding and school district poverty levels. For instance, California’s highest-poverty school districts (Quartile 4) received less declining enrollment funding on average than its lower-poverty school districts (Quartiles 2 and 3).
If targeting additional dollars to low-income students is a policy goal, there are more effective ways to accomplish this. For instance, all states examined in this study have funding weights in their formulas that provide additional resources for economically disadvantaged students. This is a more precise and transparent approach to divvying up education dollars.
Many states employ hold harmless policies similar to those examined in California, Missouri, and Oklahoma. Policymakers in each state should evaluate the cost of these policies, their distribution patterns, and whether they’ve outgrown their original purpose. In a context where states are still rebounding from COVID-19 enrollment shocks and many are projected to have stagnating or declining K-12 populations over the next decade, it becomes increasingly expensive to shield districts from the resulting financial effects. Ultimately, legislators should ensure that K-12 dollars are tied to their strategic goals for public education.
Full Study—Billions: The Cost of State Hold Harmless Policies in K-12 Education
If you're seeing this message, it means we're having trouble loading external resources on our website.
If you're behind a web filter, please make sure that the domains *.kastatic.org and *.kasandbox.org are unblocked.
To log in and use all the features of Khan Academy, please enable JavaScript in your browser.
Financial Literacy
Course: financial literacy > unit 9.
- What are the different types of costs associated with college, postsecondary education, and training?
How to estimate your educational costs
- True cost of education
Understanding educational costs
Direct costs, indirect costs, check your understanding.
- (Choice A) direct costs A direct costs
- (Choice B) indirect costs B indirect costs
Fixed costs
Variable costs, financial aid, grants and scholarships, want to join the conversation.
- Upvote Button navigates to signup page
- Downvote Button navigates to signup page
- Flag Button navigates to signup page

- Public Safety
- Nation & World

'Great for Brockton Public Schools:' Brockton High could earn massive renovation project
BROCKTON – Brockton High School has moved one step closer to getting a massive building renovation as Mayor Robert Sullivan announced Thursday that state officials will conduct a feasibility study for a state-subsidized renovation project.
Earlier this week, officials from the Massachusetts School Building Authority approved Brockton’s request for a feasibility study for the renovation of Brockton High, which was first built in September 1970.
Following the study, if plans are approved by the Massachusetts School Building Authority, the state will fund 80% of the entire renovation.
“That was a game changing vote,” Sullivan said at Thursday’s school committee meeting. “That’s great for Brockton High, that’s great for Brockton Public Schools.”
Brockton was selected as one of 10 schools in the Commonwealth for the Massachusetts School Building Authority CORE grant program, which was established in 2004 to fund major construction projects for public schools in Massachusetts. After missing the invitation twice, Brockton High School sent a letter of interest in 2020 that was accepted in December 2022.
The possibility of the huge project came under threat in February of this year when members of the Brockton City Council considered denying Brockton Public Schools the $2.5 million needed to secure the feasibility study. The council has been critical of the school district’s spending since its $18 million budget deficit in 2023.
"This is what we wanted," said Ward 7 Councilor Shirley Asack at the time, "but we're not in the right place to accept it."
Councilors voted unanimously in March to approve the $2.5 million despite the school district’s financial insecurity.
Read more: Wary pols approve $2.5M to study renovation of Brockton High School
How much will the project cost?
The project could cost $1 billion, meaning Brockton would pay roughly $100 million to $200 million for its share. According to Sullivan, state leaders have pledged that the $2.5 million for the feasibility study will be included in the 80% reimbursement, although cities typically pay that fee in full. The Massachusetts School Building Authority will pay up to $800 million.
“The feasibility study will carefully examine potential solutions to the issues identified at the school’s facility and will help us develop the most cost-effective plan to address those issues,” state Treasurer Deborah B. Goldberg said in a written statement.
The Massachusetts School Building Authority has given the green light to over 1,000 school building renovations across Massachusetts and has given more than $17 million to fund these projects.
Your choices
Expand the sections below to view details about cookies used on this website.
| jsessionid | This tracks individual visits to the website to enable measurement of user visits. |
| _gat_gtag_UA _96333005_2, _ga, _gid | Google Analytics cookies are used to record fully anonymised data on visits to the website, so that the EBRD can interpret audience actions and make our content more useful. |
| MYSAPSSO2 | Tracks viewership of videos on the website |
| This website does not use marketing-related cookies |
- Corporate and investor information
Sectors we work in
- View list of sectors and key topics
Project information
- Project finder
- Independent Project Accountability Mechanism
What we provide
- Products and services
- Policy reform
Operations and processes
- Evaluating our work
- Strategies and policies
- Client due diligence
- Comment on our work
Key themes and topics
- The war on Ukraine
- The EBRD and digitalisation
- Economic Inclusion
- Food security
- Securing Chernobyl site
- Local currency
Economic research
- Economics at the EBRD
- Office of the Chief Economist
- Transition Report
- History of the EBRD
- Basic documents of the EBRD
- View by country and department
- Media enquiries
Structure and staff
- President Odile Renaud-Basso
- Board of Governors
- Board of Directors
- Executive Committee
- Senior leadership group
- Multiparty democracy and pluralism
- Promoting transition
- Environmental and social sustainability
- Integrity and compliance
- Backing gender equality
- Transparency
Partnering for impact
- Civil Society
- Alumni Association
- Bosnia and Herzegovina
- Kyrgyz Republic
- North Macedonia
- Slovak Republic
- Türkiye
- Turkmenistan
- West Bank and Gaza
- Project finance
- The financing process
- Why finance with us?
- Eligibility checker
Support for SMEs
- Advice for businesses
- Finance for businesses
- Donor support
- Flagship programmes
- EBRD Know How Academy
Procurement
- Project procurement
- Corporate procurement and Consultancy services
Trade Finance
- Trade Facilitation Programme
- Trade Ready
More ways to work with the EBRD
- Treasury and Capital Markets
- Mobilisation
- Working at the EBRD
- Change language
- Work With Us
Education Energy Efficiency Project
Municipal and environmental infrastructure
11 Sep 2024
Concept Reviewed
26 Jun 2024
Project Description
The provision of a sovereign loan in the amount of up to €20 million to the Government of Montenegro, to finance implementation of energy efficiency measures in 24 public educational buildings located in 10 cities across Montenegro (the "Project"). The buildings include 18 elementary schools, 3 secondary schools, 2 kindergartens and one high education school.
Project Objectives
Improvement of the energy performance of the selected public educational buildings and enhancement of thermal comfort, better health and well-being for over 19,000 users via improvement of heating, cooling and ventilation systems and thermal insulation of the buildings envelope. Contribution to the reduction of GHG emissions and energy consumption, yielding electricity and heating savings.
Transition Impact
ETI score: 60
The expected transition impact of the Project stems primarily from the Green transition quality under the Bank's Green Economy Transition approach as 100% of the use of proceeds will contribute to energy efficiency improvements of public buildings, resulting in significant reduction of CO2 emissions. The Project is expected to enable energy savings estimated at 22,319 MWh per year, or 53% compared to the baseline. Total greenhouse gas ("GHG") savings are estimated at 4,273 tCO2 per year, or 52%.
Client Information
MONTENEGRO SOVEREIGN
The Client and the beneficiary of the loan is the Ministry of Education, Science and Innovation of Montenegro, which has overall responsibility for the education policy, strategic decisions, maintenance and capital investments in educational buildings. The Ministry carries out administration tasks in the field of education which includes: (i) preschool, primary and inclusive education; (ii) general secondary, vocational and lifelong education; (iii) education and training of members of minority nations and other minority national communities; and (iv) higher education.
EBRD Finance Summary
EUR 20,000,000.00
A sovereign loan in the amount of up to €20 million to Montenegro.
Total Project Cost
EUR 24,100,000.00
The Project's total estimated cost is EUR 24.1 million.
Additionality
The Bank's additionality is derived from: (i) provision of financing with a long tenor which is not available in Montenegro from local or international commercial sources on reasonable terms and conditions; (ii) closing the funding gap for public sector investments without crowding out other sources such as IFIs, government or commercial banks; (iii) capacity strengthening of the client; (iv) enhancing practices at the sector level; higher inclusion and gender standards and (v) best international procurement standards.
Environmental and Social Summary
Categorised B (2019 ESP). The Project is expected to have positive environmental and social ("E&S") benefits from improved energy efficiency of the existing buildings. Key E&S issues will include Client's E&S management systems and capacity, contractor management, overall waste management incl. management of any asbestos containing materials ("ACMs"), worker and community health and safety during construction works in particular (dust, noise and traffic), life and fire safety, gender, GBVH, stakeholder engagement and grievance management. Environmental and social due diligence ("ESDD") will be carried out by independent E&S consultants as part of the feasibility study, including confirmation of the Priority Investment Programme ("PIP") for the Project and initial ACM review. ESDD will include E&S audit and assessment of priority investments with the focus on construction health and safety risks and waste management. An environmental and social action plan ("ESAP") and stakeholder engagement plan ("SEP") will be developed to structure the Project in line with the EBRD's Performance Requirements. This section will be updated upon completion of ESDD.
Technical Cooperation and Grant Financing
The Project includes TC support to assist the Client with: (i) preparation of a feasibility study including energy audits; (ii) design preparation and works supervision; (iii) project implementation support including ESAP implementation support and tender preparation; (iii) procurement support to assist the Client with the procurement of consultancy services and related works.
Company Contact Information
Spasoje Ostojic; [email protected] +382 20 410 100 +382 67 020 011 https://www.gov.me/mps Vaka Djurovica bb 81000 Podgorica Montenegro
Implementation summary
Psd last updated, related material, understanding transition.
Further information regarding the EBRD’s approach to measuring transition impact is available here .
Business opportunities
For business opportunities or procurement, contact the client company.
For business opportunities with EBRD (not related to procurement) contact:
Tel: +44 20 7338 7168 Email: [email protected]
For state-sector projects, visit EBRD Procurement : Tel: +44 20 7338 6794 Email: [email protected]
General enquiries
Specific enquiries can be made using the EBRD Enquiries form .
Environmental and Social Policy (ESP)
The ESP and the associated Performance Requirements (PRs) set out the ways in which the EBRD implements its commitment to promoting “environmentally sound and sustainable development”. The ESP and the PRs include specific provisions for clients to comply with the applicable requirements of national laws on public information and consultation as well as to establish a grievance mechanism to receive and facilitate resolution of stakeholders’ concerns and grievances, in particular, about environmental and social performance of the client and the project. Proportionate to the nature and scale of a project’s environmental and social risks and impacts, the EBRD additionally requires its clients to disclose information, as appropriate, about the risks and impacts arising from projects or to undertake meaningful consultation with stakeholders and consider and respond to their feedback.
More information on the EBRD’s practices in this regard is set out in the ESP .
Integrity and Compliance
The EBRD's Office of the Chief Compliance Officer (OCCO) promotes good governance and ensures that the highest standards of integrity are applied to all activities of the Bank in accordance with international best practice. Integrity due diligence is conducted on all Bank clients to ensure that projects do not present unacceptable integrity or reputational risks to the Bank. The Bank believes that identifying and resolving issues at the project assessment approval stages is the most effective means of ensuring the integrity of Bank transactions. OCCO plays a key role in these protective efforts, and also helps to monitor integrity risks in projects post-investment.
OCCO is also responsible for investigating allegations of fraud, corruption and misconduct in EBRD-financed projects. Anyone, both within or outside the Bank, who suspects fraud or corruption should submit a written report to the Chief Compliance Officer by email to [email protected] . All matters reported will be handled by OCCO for follow-up. All reports, including anonymous ones, will be reviewed. Reports can be made in any language of the Bank or of the Bank's countries of operation. The information provided must be made in good faith.
Access to Information Policy (AIP)
The AIP sets out how the EBRD discloses information and consults with its stakeholders so as to promote better awareness and understanding of its strategies, policies and operations following its entry into force on 1 January 2020. Please visit the Access to Information Policy page to find out what information is available from the EBRD website.
Specific requests for information can be made using the EBRD Enquiries form .
Independent Project Accountability Mechanism (IPAM)
If efforts to address environmental, social or public disclosure concerns with the Client or the Bank are unsuccessful (e.g. through the Client’s Project-level grievance mechanism or through direct engagement with Bank management), individuals and organisations may seek to address their concerns through the EBRD’s Independent Project Accountability Mechanism (IPAM).
IPAM independently reviews Project issues that are believed to have caused (or to be likely to cause) harm. The purpose of the Mechanism is: to support dialogue between Project stakeholders to resolve environmental, social and public disclosure issues; to determine whether the Bank has complied with its Environmental and Social Policy or Project-specific provisions of its Access to Information Policy ; and where applicable, to address any existing non-compliance with these policies, while preventing future non-compliance by the Bank.
Please visit the Independent Project Accountability Mechanism webpage to find out more about IPAM and its mandate; how to submit a Request for review; or contact IPAM via email [email protected] to get guidance and more information on IPAM and how to submit a request.
- PSDs in Montenegro
- PSDs in Municipal and environmental infrastructure
Related IPAM Project Complaints
Sign up for email alerts.
- Comment on a proposal
- Report fraud, corruption and misconduct
- Submit an environmental or social complaint
- Give site feedback
- Request for Information
- View all contacts
- Terms and conditions

Committee Releases FY25 Labor, Health and Human Services, Education, and Related Agencies Appropriations Act
Washington, D.C. – Today, the House Appropriations Committee released the Fiscal Year 2025 bill for the Labor, Health and Human Services, Education, and Related Agencies Subcommittee. The bill will be considered in subcommittee tomorrow, June 27th at 8:00 a.m. The markup will be live-streamed and can be found on the Committee’s website . Labor, Health and Human Services, and Education Subcommittee Chairman Robert Aderholt (R-AL) said, “It’s been an honor to work with the members of this subcommittee to craft a bill that provides needed resources to agencies for administering vital programs, while also reining in reckless and wasteful spending. This bill focuses on ensuring the success of critical programs that affect every American, through supporting our nation’s workforce, increasing access to healthcare for those in underserved and rural areas, and prioritizing targeted education programs, all while cutting politically motivated initiatives pushed by unelected bureaucrats. "Earlier this year, I authored an op-ed calling for common sense reforms to the appropriations process. This bill is a step in moving forward on these reforms, as reflected through the reduction and elimination of many programs with expired authorizations, and efforts to bring members into the process as early as possible in the drafting of this legislation while also encouraging further partnerships with authorizers. "I thank Chairman Cole and my colleagues for working with me to begin these reform efforts, and I look forward to the continued progress that can be made by this Committee in restoring trust with the American people as we work to responsibly allocate taxpayer dollars. While we still have a ways to go, I believe this bill lays a strong foundation for the path to transparency and fiscal responsibility.” Chairman Tom Cole (R-OK) said, “We are directing valuable taxpayer dollars where they can best impact the nation. This bill prioritizes research for novel treatments that can save and transform lives—and we strengthen our medical supply chains and biodefense capabilities. Investments in this bill also support the well-being of the most precious among us: America’s children. The legislation rejects the Biden Administration’s pursuit of divisive programs in education and attempts to disregard the right to life of every unborn child. Instead, each dollar is directed toward initiatives that truly help our communities, students, and workforce. Chairman Aderholt’s work puts our country on a stronger path forward.” Fiscal Year 2025 Labor, Health and Human Services, Education, and Related Agencies Appropriations Act The Labor, Health and Human Services, Education, and Related Agencies Appropriations Act provides a total discretionary allocation of $185.8 billion, which is $8.6 billion (4%) below the Fiscal Year 2024 enacted score, $23.8 billion (11%) below the Fiscal Year 2024 effective spending level, and $36.2 billion (15%) below the President’s Budget Request. Key Takeaways
- Providing $48 billion in funding to support biomedical research, which is necessary to counter China’s growing threat in basic science research.
- Strengthening America’s biodefense and countering global health security threats by providing more than $3 billion for the Administration for Strategic Preparedness and Response, an increase of nearly $200 million above the President’s Budget Request.
- Prohibiting the purchase of supplies from China for the Strategic National Stockpile, which supports expansion of the domestic industrial base for these items.
- Reducing funding by 60% for nongovernmental organizations facilitating the flow of minors illegally crossing the border.
- Securing the nation’s food supply by rolling back the Biden Administration’s burdensome one-size-fits-all regulations leading to the closure of small family farms.
- Eliminating 57 programs, including 21 that are not authorized.
- Cutting funding for 48 programs.
- Rejecting new programs in the President’s Budget Request such as Climate Corps, divisive school diversity initiatives, and drug-use advocating “harm reduction” programs.
- Reducing funding for ineffective, duplicative, and controversial K-12 education competitive grants by $1 billion (50%).
- Reducing funding for the Baltimore and Washington, D.C. Social Security Administration offices due to reduced in-person staffing.
- Reducing funding by 22% and eliminating 23 duplicative and controversial programs while increasing funding to combat emerging and zoonotic infectious diseases.
- Providing mental health services through significant increases to the SAMHSA Substance Misuse Prevention and Mental Health Services block grants while reducing funding for programs that support the active misuse of narcotics.
- Prioritizing funding for early education, childcare, child welfare, and programs for seniors and the disabled.
- Increasing funding to educate children with disabilities in every school district.
- Increasing funding for career and technical education to support local programs for students who are not seeking a college degree.
- Increasing funding for charter schools to support students and families seeking better schooling options.
- Maintaining funding for Pell Grants at the maximum discretionary amount of $6,335, combined with mandatory funding of $1,060 – the total Pell award for the next school year continues to be $7,395.
- Maintaining the longstanding Hyde Amendment and ensuring no federal funding can be used for abortion on demand.
- Maintaining the Dickey-Wicker Amendment, a legacy rider that prohibits the creation or destruction of human embryos for research purposes.
- Prohibiting NIH from using human fetal tissue obtained from an elective abortion to be used in taxpayer-funded research.
- Prohibiting funding for Biden Administration activities to promote abortion.
- Eliminating funding for Title X family planning and stopping funding from going to abortion-on-demand providers, like Planned Parenthood.
- Prohibiting funding for Biden Administration executive orders and regulations that promote divisive ideologies, like Critical Race Theory, or infringe on American due process rights and religious liberties.
- Maintaining the longstanding Dickey Amendment, which ensures that federal funds cannot be used to advocate or promote gun control.
- Prohibiting funding for schools that support antisemitic conduct or which discriminate against religious student groups.
- Prohibiting funding for medical procedures that attempt to change an individual’s biological sex.
- Prohibiting the Biden Administration’s student loan bailout.
- Prohibiting the Biden administration’s independent contractor rule, liberating 64 million American women, seniors, and others balancing work with family responsibilities to participate in the freelance economy.
A summary of the bill is available here . Bill text is available here .
Early Education Leaders, an Institute at UMass Boston
Provides the leadership development opportunities and infrastructure that early educators need to support thriving children and families..

UMass Boston Early Ed Cost and Usage Simulator Project (CUSP)
June 26, 2024 by earlyedinstitute
The UMass Boston Early Education CUSP Project is led by a multidisciplinary team that designed a simulator to produce current, relevant, accurate, and responsive estimates of the key impacts of proposed legislation in Massachusetts to expand access to affordable, quality child care and early education.
CUSP releases publications aimed to provide essential information to guide policymaking on child care and early education affordability, quality, and access in Massachusetts.
Policy Briefs
Building a Foundation for Racial and Ethnic Equity: Estimated Impacts of Massachusetts Legislation to Expand Affordable Quality Child Care and Early Education. Released June 28, 2024.
Full Report
Executive Summary
Estimating the Impacts of Legislation to Expand Affordable Quality Child Care and Early Education in Massachusetts: Initial Findings on Utilization, Employment, and Financial Assistance. Released October 11, 2023.
Project Team
Randy Albelda, PhD , is professor emerita of economics at the University of Massachusetts Boston. Her research covers a broad range of economic policies affecting women’s economic status, especially for low-income workers in the United States, with particular attention to the intersection of public supports and earnings. Albelda has worked with various local, state, and national groups on policies that promote gender, racial, and income equality. She co-developed a paid family and medical leave simulator with Alan Clayton-Matthews in conjunction with the Institute for Women’s Policy Research.
Alan Clayton-Matthews, PhD , is an associate professor emeritus in the School of Public Policy and Urban Affairs and the Department of Economics at Northeastern University. He is a senior contributing editor of MassBenchmarks , a joint publication of the University of Massachusetts in cooperation with the Federal Reserve Bank of Boston; a member of the Board of Economic Advisors of the Associated Industries of Massachusetts (AIM); and a director of the New England Economic Project.
Anne Douglass, PhD , is professor of early childhood education policy and founding executive director of the Institute for Early Education Leadership and Innovation at the University of Massachusetts Boston. She is an expert on the early care and education workforce, leadership, and quality improvement, and she brings years of experience leading innovations to equitably increase early educator access to higher education and professional development. She also has 20 years of experience as an early educator. She is the author of Leading for Change in Early Care and Education: Cultivating Leadership from Within; has been published in a wide range of journals, books, and news media; and presents nationally and internationally to academic, policy, and professional audiences.
Christa Kelleher, PhD , serves as research and policy director of UMass Boston’s Center for Women in Politics and Public Policy. She enjoys building and managing diverse teams to conduct collaborative applied research on public leadership and a range of public policy issues. Among other projects, she has directed studies on women’s economic status, the midwifery workforce, women in construction, gender parity in higher education leadership, the early care and education workforce, and pay equity. She also partners with UMass Boston’s Collins Center for Public Management, helping to coordinate the Diversity, Equity, Inclusion, and Anti-Racism Practice.
Laurie Nsiah-Jefferson, PhD, MPH, MA is director of the Center for Women in Politics and Public Policy at UMass Boston and graduate program director of the Gender, Leadership, and Public Policy graduate certificate program. She is committed to equity and inclusion in her work as a faculty member, executive leader, and researcher. An expert on the intersection of race, class, and gender in health, health care and social policy, she is extremely well versed in the tools and applications of diversity, equity, inclusion, and anti-racism in multiple spheres and venues. She has held faculty and senior scientist positions at the Heller School for Social Policy and Management at Brandeis University, where she was affiliated with the Institute for Child, Youth and Family Policy, the Institute on Assets and Social Policy, and the Sillerman Center for the Advancement of Philanthropy.
Songtian (Tim) Zeng, PhD , is assistant professor of curriculum and instruction in the College of Education and Human Development and director of research for the Institute for Early Education Leadership and Innovation at UMass Boston. His research aims to support the health and social-emotional well-being of young children with adverse childhood experiences and disabilities by promoting equitable health and social service access for them. He has published over 30 peer-reviewed articles and secured a number of grants to support his research.

Comments are closed.
- Coronavirus Michigan
- Michigan K-12 schools
- Gov. Gretchen Whitmer
- Rural Michigan
- 2024 Michigan election
Michigan’s $23B education deal: Free community college for all, pre-K for many

Share This:
- Michigan education budget will save schools money on retirement costs but will not increase per-pupil funding
- Democrats hailed the plan, but some school groups and all Republicans opposed it
- Plan funds Gov. Gretchen Whitmer’s plan for tuition-free community college but not her universal pre-K proposal
LANSING — Michigan will guarantee free community college, continue free school lunches for all and expand access to free preschool under a budget deal approved early Thursday by the Democratic-led Legislature.
But the $23.4 billion education spending plan stops short of guaranteeing free preschool for all, a top priority for Democratic Gov. Gretchen Whitmer, and some school groups warned the plan could force future teacher layoffs.
The budget deal was delayed for weeks amid debate over Whitmer’s initial proposal to redirect $670 million in retirement health care contributions to other education priorities, including universal free pre-K.
- Michigan’s $83B budget deal boosts housing, scraps Whitmer’s trash fee hike
- Michigan lawmakers add $411M in pet projects to state budget
- Government transparency plan passes Michigan Senate — which had been roadblock
Under the final deal unveiled and approved Thursday morning, most of those savings would instead go directly back to traditional public schools. But for the first time in a decade, those schools will not receive any increase in their per-pupil foundation allowance.
Democrats approved the education budget in party-line votes, 56-54 in the House and 20-18 in the Senate, which voted at around 4:45 a.m. on Thursday to cap a marathon session that had begun Wednesday at 10 a.m.
Senate Majority Leader Winnie Brinks, D-Grand Rapids, said the budget will ultimately put more money back into Michigan classrooms, calling it a “thoughtful and responsive budget to the real needs of our students, parents, teachers and schools.”
But Republicans panned the spending plan as irresponsible, arguing that reducing retiree healthcare contributions was irresponsible given ongoing debt in the larger teacher pension fund.
“It's just an extremely unwise and reckless move,” said Sen. Thomas Albert, R-Lowell. “It is in no way necessary to maintain the central programs, and it makes no financial sense.”
With state surplus and federal pandemic funds run dry, the overall education budget is 3.5% smaller than the $24.3 billion version Whitmer and the Democratic-led Legislature negotiated last year.
Here’s a look at the education budget, which is part of a larger $82.5 billion spending plan approved Thursday:
K-12 school funding, retirement savings
Traditional school districts will have the health care portion of their pension contribution rates reduced by about 5.75 percentage points for next school year, saving them a combined $598 million.
But the plan eliminates $316 million in new spending Whitmer had proposed to increase traditional public school funding by $241 per student. Instead, most schools will receive the same $9,608 allowance as this year.
Public schools will face cuts in some other state programs.
The state will not add additional funds to the Mi Kids Back on Track program, which districts could use for tutoring and other support to help students recover learning loss. Whitmer had proposed $150 million.
The budget agreement also significantly pairs back how much the state will provide to public and nonpublic schools for mental health and school safety funding. Schools received these funds on a per-pupil basis.
This past school year, the state spent $328 million on the program. The governor had proposed another $150 million this year, but the final deal includes just $26.5 million.
Expanding Pre-K access
Michigan will expand access to the state’s free preschool program for 4-year-olds under the budget approved Wednesday, but the Great Start Readiness program will not be open to all, as Whitmer had proposed.
Under the final deal, a family will qualify for a free preschool spot if they are at or below 400% of the federal poverty line. Using 2024 federal poverty numbers , a family of four with an income of up to $124,800 could qualify.
Families that earn more than that could still qualify for free preschool if Great Start Readiness Program providers have additional open spots.
An estimated 5,000 kids would benefit from the expansion, down from the 6,800 who would have benefited from Whitmer's proposal for universal pre-K, according to an analysis by the nonpartisan House Fiscal Agency.
House Democrats had wanted to remove a requirement that intermediate school districts allocate 30% of preschool slots to private providers, and Senate Democrats proposed wage requirements for preschool teachers .
Private providers warned those proposals could force closures, but neither provision made the final budget.
Free community college tuition
The budget deal includes what Whitmer is calling the Community College Guarantee, which combines state and federal aid to make community college tuition-free.
The program builds off the existing Michigan Achievement Scholarship, which currently pays up to $2,750 a year for community college, $4,000 a year for independent nonprofit college or $5,500 a year for public university.
The new budget will eliminate income caps that had restricted access to free community college and raise the yearly amount some students can receive.
Community college students who are eligible for the federal Pell grant will receive an additional $1,000 to pay for school.
The state would cover up to the cost of in-district community college tuition for a student.
Brandy Johnson, president of the Michigan Community College Association, said that roughly 80 percent of K-12 students live within a community college district.
The deal will also raise the maximum yearly award for students who attend independent nonprofit schools from $4,000 a year to $5,500 a year.
The changes are funded by a $330 million deposit into the state’s postsecondary scholarship fund, an increase of $30 million from the previous budget.
Free school meals
Michigan will put another $40 million into a reserve fund that pays for free school meals for all public school students regardless of income.
School districts across the state offered free breakfast and lunch to students regardless of their income during the 2023-2024 school year. Whitmer and legislative Democrats had each proposed continuing the free program.
Growing educator workforce
The state will also continue to invest in the Mi Future Educator Program, which provides scholarships to university students studying to become a teacher and stipends for student teachers. Whitmer had proposed $75 million for the program and the budget deal includes the same allocation.

Michigan medical students fight to make climate change part of curriculum

FAFSA filings down at Michigan universities. Will enrollment follow?

Trash into treasure: Rethinking waste in Michigan college towns
How impactful was this article for you.
Only donate if we've informed you about important Michigan issues
See what new members are saying about why they donated to Bridge Michigan:
- “In order for this information to be accurate and unbiased it must be underwritten by its readers, not by special interests.” - Larry S.
- “Not many other media sources report on the topics Bridge does.” - Susan B.
- “Your journalism is outstanding and rare these days.” - Mark S.
If you want to ensure the future of nonpartisan, nonprofit Michigan journalism, please become a member today . You, too, will be asked why you donated and maybe we'll feature your quote next time!
Center for American Progress
Project 2025 Would Increase Costs, Block Debt Cancellation for Student Loan Borrowers
The radical Project 2025 policy agenda for student loan repayment would multiply costs for borrowers, increase defaults, and end existing programs that allow borrowers to earn cancellation.

Building an Economy for All, College Affordability and Student Debt, Education, Higher Education, Higher Education Accountability and Oversight +2 More
Media Contact
Mishka espey.
Senior Manager, Media Relations
[email protected]
Government Affairs
Madeline shepherd.
Director, Federal Affairs
Part of a Series

Project 2025: Exposing the Far-Right Assault on America

This article is part of a series from the Center for American Progress exposing how the sweeping Project 2025 policy agenda would harm all Americans. This new authoritarian playbook, published by the Heritage Foundation, would destroy the 250-year-old system of checks and balances upon which U.S. democracy has relied and give far-right politicians, judges, and corporations more control over Americans’ lives.
For decades, far-right lawmakers have pushed ideas that would weaken higher education in the United States, including, blocking efforts to allow student borrowers to earn cancellation, allowing predatory actors to take advantage of students, and even eliminating the U.S. Department of Education. But a sweeping new agenda from the Heritage Foundation called Project 2025 serves as an authoritarian road map to implement destructive new policies, including a new student loan repayment plan that would force student loan borrowers to shell out thousands more each year in payments.
Project 2025 proposes phasing out existing income-driven repayment (IDR) plans for student loan borrowers, such as the Biden-Harris administration’s new Saving on a Valuable Education (SAVE) plan , and replacing it with a one-size-fits-all IDR plan. The Project 2025 repayment plan offers limited flexibility to account for borrowers’ financial picture and eliminates SAVE’s interest benefit, threatening to bring back ballooning balances even for borrowers who make on-time monthly payments. This would be a devastating blow to the millions of Americans every year who must take out debt in order to obtain a higher education and pursue a path to America’s middle class.
Under Project 2025, borrowers would see an increase in monthly payments
If enacted, Project 2025’s blueprint for student loan payments would eliminate the SAVE plan, the most affordable repayment plan in history . Replacing SAVE with the Project 2025 repayment plan would significantly increase many borrowers’ monthly payments, adding additional financial strain to those who already struggle with their student loan debt.
Additional annual payments for typical earners ages 25–34 under the Project 2025 plan
Additional annual payment for borrowers with some college, but no degree
Additional annual payment for borrowers with an associate degree
Additional annual payment for borrowers with a bachelor's degree
Additional annual payment for borrowers with a master's degree
Figure 1 shows how student borrowers ages 25–34 with earnings around the median among those with their level of educational attainment would be affected by the Project 2025 repayment plan. Those who attended college but did not earn a degree or credential would see their monthly payments almost quadruple, while borrowers with associate degrees would see their payments more than triple. Typical borrowers of all education levels would shell out at least $2,700—and as high as $4,000—more per year in student loan payments on this plan relative to the SAVE plan.
A vast majority of the 8 million borrowers currently enrolled in SAVE would see their monthly payments go up under the Project 2025 repayment plan. In addition, the Project 2025 plan would lower the income threshold at which borrowers are required to make a payment from the current amount under the SAVE plan, $34,000 (225 percent of the federal poverty line ), to $15,000, or the federal poverty line. That means single borrowers making as little as $15,000—or a family of four living on $31,000—would have to begin making monthly student loan payments.
A vast majority of the 8 million borrowers currently enrolled in SAVE would see their monthly payments go up under the Project 2025 repayment plan.
Project 2025 would bring back ballooning balances
This far-right agenda permits runaway interest on student loans, so some borrowers might still see their balance grow even if they make payments. This continues a phenomenon that plagues many borrowers and that is often caused by deferments, forbearances, interest capitalization, or simply because a borrower did not earn enough from their education to afford to repay their debt. Data from 2015–2016 indicate that at 12 years after enrollment, 27 percent of all borrowers owed more than they originally borrowed, with this share being even higher among Black borrowers (52 percent), Pell Grant recipients (33 percent), those from families near or below the poverty line (31 percent to 34 percent), those without a degree or credential (31 percent), and those with an associate degree or certificate (30 percent).
For example, a typical Black K-12 classroom teacher with graduate debt who began repayment in 2024 would see their balance grow for the first eight years of repayment—even as they made payments—under the Project 2025 plan. (see methodology for more information) Starting with a median debt of about $70,000 for their graduate and undergraduate education, but seeing a starting salary of only around $52,000, this teacher’s monthly payment the first year of repayment would be $308: a substantial sum, yet not enough to cover the $325 that accrues in interest every month. Because Project 2025 would also eliminate the Public Service Loan Forgiveness program and the maximum repayment terms on IDR plans, this teacher would pay for a total of 27 years. Others with higher debts, lower incomes, or both may get caught in a debt trap, in which their monthly payments would never cover the growing interest on a ballooning balance. Project 2025 would force them to pay in perpetuity.
Under Project 2025 policies, this teacher would ultimately pay about $150,000, more than double their original principal. Their monthly payments would begin at $308 and rise to an estimated $678 after 27 years, assuming 3 percent annual wage growth.
By contrast, under the SAVE plan, this K-12 teacher would have a $117 monthly payment, and the additional $150–$200 in interest that accrued each month would be waived to prevent the outstanding balance from growing. A borrower’s payments would increase over time as their income grows and therefore eventually cover higher shares of the interest. If this teacher qualified for Public Service Loan Forgiveness, they would pay $17,000 over 10 years. If they did not, they would pay a total of $56,000 over 25 years under the SAVE plan. In both cases, their monthly loan payments would go entirely to interest, and the remaining original principal of about $70,000 would be canceled.
The SAVE plan and existing debt cancellation pathways help reduce the burden on individuals, including many teachers, whose incomes are too low to service their debt without extreme hardship. Project 2025 policies, by contrast, would impose burdensome monthly costs on these essential public service workers and close off pathways to earned relief.
Sign up for the Spotlight Project 2025 newsletter The newsletter exposes the far-right assault on America
This site is protected by reCAPTCHA and the Google Privacy Policy and Terms of Service apply.
Under Project 2025, millions of borrowers would be denied earned debt relief
In addition, existing programs for teachers and public service workers, such as law enforcement officers and nurses, would eliminate the remainder of this K-12 teacher’s debt after a defined period of employment. Depending on the subject they teach and the type of school they teach at, they may be eligible for the Teacher Loan Forgiveness program, which cancels $17,500 in debt after five years of service. After 10 years, they would be eligible for the Public Service Loan Forgiveness program, which would cancel the remaining balance. (A teacher may be eligible for both but cannot receive credit for both for the same period of service.)
Project 2025, however, seeks to eliminate any “time-based and occupation-based student loan forgiveness” programs such as these. In combination, eliminating these programs promises to entangle many public service workers with high debt-to-income ratios in a lifelong debt trap.
For all other borrowers, the Project 2025 IDR plan would eliminate earned cancellation for people who have already been paying off their loans for many years. Such a change would require congressional action; in the absence of legislative change, Project 2025 proposes extending the cancellation timeline to the current statutory maximum of 25 years. Under current policies, undergraduate student loan borrowers on all IDR plans who make their required payments will see their remaining balances forgiven after 20 years, while those who hold graduate loans will experience this benefit after 25 years. For borrowers with low balances, the SAVE plan offers a shortened timeline to cancellation in as little as 10 years. There are currently 12.7 million people enrolled in IDR plans, some of whom would lose out on these earned cancellation opportunities after making their maximum number of payments.
Project 2025 would wreak havoc on student loan borrowers’ credit
While the full impact of the SAVE plan on default rates is yet to be determined, in its absence, the student loan system is likely to see default rates similar to those for cohorts of borrowers beginning repayment in 2012 to 2017, when IDR plan monthly payment options were similar to those in Project 2025 and before the pandemic payment pause affected reporting. During that period, the share of borrowers who defaulted within three years of beginning repayment ranged from 10 percent to 12 percent . This means more than 1 in 10 borrowers saw their credit scores lower, with consequences such as higher interest rates or difficulty acquiring new lines of credit, as well as more severe consequences such as wage or Social Security garnishment. Project 2025 threatens to return student loan borrowers to a time when expensive monthly payments both imposed daily burdens on borrowers and harmed their long-term financial well-being.
Since the SAVE plan debuted in August 2023, nearly 8 million borrowers have enrolled , including 4.5 million borrowers with a $0 monthly payment. The other 3.5 million save an estimated $117 per month, or about $1,400 per year, on average. In addition, about 360,000 low-balance borrowers have already received $4.8 billion in relief from the SAVE plan’s shortened timeline to cancellation.
One in 3 borrowers ages 25 to 49 rely upon an IDR plan to afford their student loan payments and would see their repayment plan options severely restricted if the Project 2025 proposal were adopted. This far-right vision for student loan repayment would fail to provide affordable repayment options to those who are most likely to struggle with their loans and experience default . An estimated 85 percent of community college borrowers, who likely have low balances, would still be saddled with their debt , even 10 years later.
Creating affordable repayment options is essential to ensuring student loan borrowers do not have to choose between making on-time payments and meeting their basic needs. Instead of alleviating the burden imposed by student loans, Project 2025 would make monthly loan payments a financial anchor for millions, push more borrowers into default, and force others to pay in perpetuity.
Methodology
The approximate percentages of the student loan borrowers by education level are estimated using data from the Federal Reserve’s 2020–2022 Surveys of Household and Economic Decisionmaking (SHED) and the U.S. Census Bureau . The data from the 2020, 2021, and 2022 survey years were pooled for these estimates. The SHED data showed the proportion of the population that reported currently holding student loans for their own education, by educational attainment level. Those whose education level is high school degree or GED certificate and who reported holding student loan debt (28 percent) were included in those with “some college, no degree” in this figure. Those who hold a “certificate or technical degree” (6 percent) were not included because corresponding income data were not available. Similarly, SHED includes data for “graduate degree” holders, and not master’s degree holders specifically. The share of this group that are master’s degree holders (rather than doctoral degree holders) was estimated from U.S. Census Bureau data on educational attainment, which shows that approximately 80 percent of those with graduate degrees hold master’s degrees, while 20 percent hold doctoral degrees. The 12.85 percent of SHED survey respondents with student loan debt who hold graduate degrees was then adjusted to assume 80 percent of these, or approximately 10.28 percent (rounded to 10 percent) of all graduate degree holders hold master’s degrees.
The financial impact of the Project 2025 repayment plan on workers ages 25–34, by education level, was estimated using 2023 data from the U.S. Bureau of Labor Statistics’ Current Population Survey (CPS) , which is available at https://www.bls.gov/cps/earnings.htm#education . Median annual earnings by education level were derived from median weekly earnings. Discretionary income under SAVE is defined as the annual income minus 225 percent of the federal poverty guidelines (FPL). The calculations in Figure 1 use the 2023 FPL of $14,580, and the calculations assume a family size of one.
The SAVE plan monthly payment amount is calculated as 5 percent of discretionary income for undergraduate loans and 10 percent of income for graduate loans. The monthly payment projection for master’s degree borrowers assumes an effective discretionary income percentage of 8.5 percent for a borrower whose debt loan comprises 30 percent undergraduate and 70 percent graduate debt, approximated from the average federal student loan debt levels for master’s degree borrowers in 2020 according to the National Center for Education Statistics’ National Postsecondary Student Aid Study (retrieval code “vgdcbk”).
Because the SAVE plan was not introduced until August 2023, and the discretionary income calculation for undergraduate loans will not be reduced to 5 percent until July 1, 2024 , these should be considered estimates based on the latest CPS data available (2023).
The Project 2025 plan monthly payments are calculated as 10 percent of discretionary income, which the plan defines as annual income minus 100 percent of the FPL.
The median annual earnings figures in Figure 1 represent all workers ages 25–34 across the United States, and not necessarily student loan borrowers. Student loan borrowers’ incomes may systematically differ from workers of similar education levels. This figure should be interpreted, therefore, as the theoretical impact on student loan borrowers whose incomes are similar to the median of their age group and education level.
Example: Typical Black K-12 teacher with graduate debt who began repayment in 2024
These data derive from the U.S. Department of Education National Center for Education Statistics’ Baccalaureate and Beyond Longitudinal Study, 2016/2020, available at https://nces.ed.gov/surveys/b&b/ . The names of the variables used in this analysis are: B2FEDCUM1, B2FEDCUM2, B2FEDCUM3, B2ALLINC4YRS, RACE, B2EVRGRDENR, B2PBENM48, and B2CURREGTCH, and the analysis can be retrieved using the code “ulijah” at https://nces.ed.gov/datalab/ . This analysis uses baseline data found in this survey to project what a Black K-12 teacher with graduate debt who earned their bachelor’s in 2020 and began repaying their debt in 2024 would pay under the SAVE versus Project 2025 plans.
The results indicate that the median undergraduate debt for a Black K-12 teacher who had attended but was not currently enrolled in a graduate program was $30,707, and graduate debt was $36,741, for a total estimated debt of $67,448. These numbers align with findings from a 2021 National Education Association report that found that 26 percent of P-12 teachers who borrowed for their education took out more than $65,000 in debt. Young educators and educators of color also had higher debt loads than their older and white peers. The data indicate that this group of borrowers had a median annual income of $46,263. These numbers were updated to reflect the increased borrowing rates of 1 percent per year for both undergraduate and graduate debt. An average wage increase rate of 3 percent per year was assumed for a 2024 salary of $52,069.
Interest rates were approximated at 4 percent for undergraduate loans and 7 percent for graduate loans based on historical federal student loan interest rates . The weighted interest rate was used for calculating the monthly accrued interest. Student loan interest compounds daily, so the monthly interest rate was found by dividing the annual interest rate by 365 and then multiplying by 30. It should be noted that interest only accrues on the principal and does not capitalize.
The monthly payments under the Project 2025 and SAVE plans from 2024 onward were then found by assuming a 2.8 percent annual increase in the FPL, based on the historical average . Teacher pay was estimated to increase 3 percent per year, a conservative estimate relative to other occupations given that teacher pay has historically risen at lower rates than the pay for other workers.
The positions of American Progress, and our policy experts, are independent, and the findings and conclusions presented are those of American Progress alone. A full list of supporters is available here . American Progress would like to acknowledge the many generous supporters who make our work possible.
Sara Partridge
Senior Policy Analyst
Madison Weiss
Policy Analyst

Higher Education Policy
The Higher Education team works toward building an affordable and high-quality higher education system that supports economic mobility and racial equity.
Explore The Series
The far right’s new authoritarian playbook could usher in a sweeping array of dangerous policies.

Project 2025 Medicaid Lifetime Cap Proposal Threatens Health Care Coverage for up to 18.5 Million Americans

Project 2025 Would Eliminate Head Start, Severely Restricting Access to Child Care in Rural America
Sign up for the spotlight project 2025 newsletter.
The newsletter exposes the far-right assault on America
IMAGES
VIDEO
COMMENTS
New York City is the most costly metro market for K-12 school construction, with elementary school buildings running $320.96 per square foot on average and high schools at $319.16 per square foot. Honolulu, Chicago, Los Angeles, and Las Vegas round out the top five most-costly school construction markets analyzed by Gordian.
By Gordian | April 13, 2023. Photo: Pixabay. Colleges and universities manage more than 6 billion square feet of campus space in 210,000 buildings nationwide, with a replacement value of $2 trillion and a backlog of urgent capital renewal needs exceeding $112 billion.
U.S. DEPARTMENT OF EDUCATION. Indirect Cost Division. Office of Grants Administration . Office of Finance and Operations. September 2019. 1 U.S. Department of Education Betsy DeVos Secretary . ... Education Department General Administrative Regulations (EDGAR) under 34 CFR 75 and 76.
U.S. public construction spending on power projects 2009-2019; Construction costs for educational buildings in the U.S. 2024, by city; Local and state government construction value: education 2005 ...
evaluation projects. IES believes cost analysis is crucial to support education agencies' decision-making in the adoption of programs, policies, or practices. IES has released this starter kit for grant applicants who are new to this kind of analysis. The kit will help you plan a cost analysis, setting the foundation for more
USAID has a cost analysis guide (100+ pages) for education projects that explains all the methods and then a guide to doing this in practice. Dhaliwal and others walk readers through many of the decisions you have to make in cost analysis and their implications.
Payments take the form of direct grant aid to defray the costs incurred by projects or to reimburse locally issued debt, without requiring school districts to repay the state. Financing. 35 states and the District of Columbia employ various financing mechanisms, such as bond issuance, to fund school construction costs. One state has a program ...
To assist our education clients in informed decision making, we use a detailed preliminary cost estimate which reflects the total project cost. The total project cost includes both "hard" and "soft" costs. "Hard" costs are any costs related to construction - the materials, labor, and work to complete the building.
When California-based C.W. Driver Cos. began work on the new 94,000-square-foot K-8 Cadence Park School campus in Irvine in 2016, the overall construction costs came in at $475 per square foot ...
COST ANALYSIS STANDARDS & GUIDELINES 1.1. June 2021 (revised from Version 1.0 issued June 2020) Fiona Hollands, Ph.D. tt-Williams, Ph.D.Robert Shand, Ph.D.The development of these guidelines was supported by the Institute of Education Sciences, U.S. Department of Education, through Grant R305U200002 to.
Lastly, it should be noted that CBA is not the only approach to assessing education projects. For example, cost-effectiveness analysis (CEA) is often used to compare education-related investments based on the costs to achieve a specific educational outcome, such as higher test scores or grade attainment, that is quantified but not assigned a ...
K-12 Education Our K-12 portfolio includes more than 2,000 projects with a combined construction value exceeding $10 billion. Our experience in this sector spans every project type imaginable and includes the management of some of the largest school programs in the country. We have successfully delivered K-12 programs and
The budget increases total K-12 education funding by $435 million over the next two years, accelerates full funding of the Education Cost Sharing (ECS) formula, increases funding for the Excess Cost grant for students with extraordinary special education needs, and includes $150 million for public schools across the state.
CUE, as part of a broader project focused on the collection, analysis, and use of data to achieve learning outcomes in education and early childhood development (ECD), initiated research on costs ...
Education, a $15.3 billion or 20.9 percent increase from the 2021 enacted level (less rescissions). The President is also committed to working with Congress to enact his planto lower costs for American families and expand the productive capacity of the American economy. This plan includes proposals to cut
IIEP supports UNESCO Member States in costing and planning their education development plans. Discover our tools and methodologies. 1. Education sector analysis: 'costs and financing' section. The sector analysis is the first step in educational planning, as it sets out an in-depth diagnosis of the state of a country's educational system.
Cost Analysis Guidance for USAID-Funded Education Activities . Bureau for Development, Democracy, and Innovation, Center for Education (DDI/EDU) U.S. AGENCY FOR INTERNATIONAL DEVELOPMENT 2024 Version 2.2 This document should be cited as follows: Walls, Elena, Caitlin Tulloch, and Christine Harris-Van Keuren. 2024.
Economic Analysis of Education Projects and Project Outcomes. Ayesha Vawda, Peter Moock, J. Price Gittinger, and Harry Patrinos. The research reported in this paper tests the hypothesis that World Bank staff appraisal. reports (SARs) or project appraisal documents (PADs)2 of education projects which are judged.
Comparing Higher Education Construction Costs. There is significant variation in how projects are managed and how costs are captured amongst the higher education sector. There is significant variation in the ratio of construction to total project cost, but the mean is 0.72 and the mode is 0.70 - submitted by respondents on 69% of the projects ...
Simply add them together and divide by three: 10,000 + 7,500 + 15,000 = 32,500. 32,500 ÷ 3 = 10,833. As a result, the average project estimate is $10,833. Three-point estimates are best for where there's a lot of uncertainty or variability in the tasks or projects. 5.
6. GoGetFunding. GoGetFunding is a large UK-based crowdfunding site solely intended for personal causes like education. At the time of writing, GoGetFunding has around 25.2K education campaigns. Students and teachers all over the world have used the site to cover costs for tuition, school supplies, travel, and more.
This is a more precise and transparent approach to divvying up education dollars. Many states employ hold harmless policies similar to those examined in California, Missouri, and Oklahoma. Policymakers in each state should evaluate the cost of these policies, their distribution patterns, and whether they've outgrown their original purpose.
Direct costs are what you pay to the school for your education. These costs include tuition, fees, books, and supplies. For example, if you go to a four-year college, your tuition might be $ 10,000 a year. You might also have to pay fees for things like the student center fee or the school library fee. Books and supplies can add up, too.
EDUCATION 'Great for Brockton Public Schools:' Brockton High could earn massive renovation project. ... How much will the project cost? The project could cost $1 billion, meaning Brockton would ...
The buildings include 18 elementary schools, 3 secondary schools, 2 kindergartens and one high education school. Project Objectives. ... Total Project Cost. EUR 24,100,000.00 The Project's total estimated cost is EUR 24.1 million. Additionality. The Bank's additionality is derived from: (i) provision of financing with a long tenor which is not ...
The Labor, Health and Human Services, Education, and Related Agencies Appropriations Act provides a total discretionary allocation of $185.8 billion, which is $8.6 billion (4%) below the Fiscal Year 2024 enacted score, $23.8 billion (11%) below the Fiscal Year 2024 effective spending level, and $36.2 billion (15%) below the President's Budget ...
The UMass Boston Early Education CUSP Project is led by a multidisciplinary team that designed a simulator to produce current, relevant, accurate, and responsive estimates of the key impacts of proposed legislation in Massachusetts to expand access to affordable, quality child care and early education.
Michigan Democrats cap a 19-hour marathon session with approval of an education budget they say will put money back into classrooms. Some school groups opposed the plan, along with all Republicans. ... Michigan lawmakers add $411M in pet projects to state budget; ... The state would cover up to the cost of in-district community college tuition ...
The Ventura City Council voted Tuesday to initiate a new rate study for water and wastewater services in response to higher cost estimates for the city's planned water recycling program ...
The financial impact of the Project 2025 repayment plan on workers ages 25-34, by education level, was estimated using 2023 data from the U.S. Bureau of Labor Statistics' Current Population ...