- Privacy Policy
Home » Variables in Research – Definition, Types and Examples

Variables in Research – Definition, Types and Examples
Table of Contents

Variables in Research
Definition:
In Research, Variables refer to characteristics or attributes that can be measured, manipulated, or controlled. They are the factors that researchers observe or manipulate to understand the relationship between them and the outcomes of interest.
Types of Variables in Research
Types of Variables in Research are as follows:
Independent Variable
This is the variable that is manipulated by the researcher. It is also known as the predictor variable, as it is used to predict changes in the dependent variable. Examples of independent variables include age, gender, dosage, and treatment type.
Dependent Variable
This is the variable that is measured or observed to determine the effects of the independent variable. It is also known as the outcome variable, as it is the variable that is affected by the independent variable. Examples of dependent variables include blood pressure, test scores, and reaction time.
Confounding Variable
This is a variable that can affect the relationship between the independent variable and the dependent variable. It is a variable that is not being studied but could impact the results of the study. For example, in a study on the effects of a new drug on a disease, a confounding variable could be the patient’s age, as older patients may have more severe symptoms.
Mediating Variable
This is a variable that explains the relationship between the independent variable and the dependent variable. It is a variable that comes in between the independent and dependent variables and is affected by the independent variable, which then affects the dependent variable. For example, in a study on the relationship between exercise and weight loss, the mediating variable could be metabolism, as exercise can increase metabolism, which can then lead to weight loss.
Moderator Variable
This is a variable that affects the strength or direction of the relationship between the independent variable and the dependent variable. It is a variable that influences the effect of the independent variable on the dependent variable. For example, in a study on the effects of caffeine on cognitive performance, the moderator variable could be age, as older adults may be more sensitive to the effects of caffeine than younger adults.
Control Variable
This is a variable that is held constant or controlled by the researcher to ensure that it does not affect the relationship between the independent variable and the dependent variable. Control variables are important to ensure that any observed effects are due to the independent variable and not to other factors. For example, in a study on the effects of a new teaching method on student performance, the control variables could include class size, teacher experience, and student demographics.
Continuous Variable
This is a variable that can take on any value within a certain range. Continuous variables can be measured on a scale and are often used in statistical analyses. Examples of continuous variables include height, weight, and temperature.
Categorical Variable
This is a variable that can take on a limited number of values or categories. Categorical variables can be nominal or ordinal. Nominal variables have no inherent order, while ordinal variables have a natural order. Examples of categorical variables include gender, race, and educational level.
Discrete Variable
This is a variable that can only take on specific values. Discrete variables are often used in counting or frequency analyses. Examples of discrete variables include the number of siblings a person has, the number of times a person exercises in a week, and the number of students in a classroom.
Dummy Variable
This is a variable that takes on only two values, typically 0 and 1, and is used to represent categorical variables in statistical analyses. Dummy variables are often used when a categorical variable cannot be used directly in an analysis. For example, in a study on the effects of gender on income, a dummy variable could be created, with 0 representing female and 1 representing male.
Extraneous Variable
This is a variable that has no relationship with the independent or dependent variable but can affect the outcome of the study. Extraneous variables can lead to erroneous conclusions and can be controlled through random assignment or statistical techniques.
Latent Variable
This is a variable that cannot be directly observed or measured, but is inferred from other variables. Latent variables are often used in psychological or social research to represent constructs such as personality traits, attitudes, or beliefs.
Moderator-mediator Variable
This is a variable that acts both as a moderator and a mediator. It can moderate the relationship between the independent and dependent variables and also mediate the relationship between the independent and dependent variables. Moderator-mediator variables are often used in complex statistical analyses.
Variables Analysis Methods
There are different methods to analyze variables in research, including:
- Descriptive statistics: This involves analyzing and summarizing data using measures such as mean, median, mode, range, standard deviation, and frequency distribution. Descriptive statistics are useful for understanding the basic characteristics of a data set.
- Inferential statistics : This involves making inferences about a population based on sample data. Inferential statistics use techniques such as hypothesis testing, confidence intervals, and regression analysis to draw conclusions from data.
- Correlation analysis: This involves examining the relationship between two or more variables. Correlation analysis can determine the strength and direction of the relationship between variables, and can be used to make predictions about future outcomes.
- Regression analysis: This involves examining the relationship between an independent variable and a dependent variable. Regression analysis can be used to predict the value of the dependent variable based on the value of the independent variable, and can also determine the significance of the relationship between the two variables.
- Factor analysis: This involves identifying patterns and relationships among a large number of variables. Factor analysis can be used to reduce the complexity of a data set and identify underlying factors or dimensions.
- Cluster analysis: This involves grouping data into clusters based on similarities between variables. Cluster analysis can be used to identify patterns or segments within a data set, and can be useful for market segmentation or customer profiling.
- Multivariate analysis : This involves analyzing multiple variables simultaneously. Multivariate analysis can be used to understand complex relationships between variables, and can be useful in fields such as social science, finance, and marketing.
Examples of Variables
- Age : This is a continuous variable that represents the age of an individual in years.
- Gender : This is a categorical variable that represents the biological sex of an individual and can take on values such as male and female.
- Education level: This is a categorical variable that represents the level of education completed by an individual and can take on values such as high school, college, and graduate school.
- Income : This is a continuous variable that represents the amount of money earned by an individual in a year.
- Weight : This is a continuous variable that represents the weight of an individual in kilograms or pounds.
- Ethnicity : This is a categorical variable that represents the ethnic background of an individual and can take on values such as Hispanic, African American, and Asian.
- Time spent on social media : This is a continuous variable that represents the amount of time an individual spends on social media in minutes or hours per day.
- Marital status: This is a categorical variable that represents the marital status of an individual and can take on values such as married, divorced, and single.
- Blood pressure : This is a continuous variable that represents the force of blood against the walls of arteries in millimeters of mercury.
- Job satisfaction : This is a continuous variable that represents an individual’s level of satisfaction with their job and can be measured using a Likert scale.
Applications of Variables
Variables are used in many different applications across various fields. Here are some examples:
- Scientific research: Variables are used in scientific research to understand the relationships between different factors and to make predictions about future outcomes. For example, scientists may study the effects of different variables on plant growth or the impact of environmental factors on animal behavior.
- Business and marketing: Variables are used in business and marketing to understand customer behavior and to make decisions about product development and marketing strategies. For example, businesses may study variables such as consumer preferences, spending habits, and market trends to identify opportunities for growth.
- Healthcare : Variables are used in healthcare to monitor patient health and to make treatment decisions. For example, doctors may use variables such as blood pressure, heart rate, and cholesterol levels to diagnose and treat cardiovascular disease.
- Education : Variables are used in education to measure student performance and to evaluate the effectiveness of teaching strategies. For example, teachers may use variables such as test scores, attendance, and class participation to assess student learning.
- Social sciences : Variables are used in social sciences to study human behavior and to understand the factors that influence social interactions. For example, sociologists may study variables such as income, education level, and family structure to examine patterns of social inequality.
Purpose of Variables
Variables serve several purposes in research, including:
- To provide a way of measuring and quantifying concepts: Variables help researchers measure and quantify abstract concepts such as attitudes, behaviors, and perceptions. By assigning numerical values to these concepts, researchers can analyze and compare data to draw meaningful conclusions.
- To help explain relationships between different factors: Variables help researchers identify and explain relationships between different factors. By analyzing how changes in one variable affect another variable, researchers can gain insight into the complex interplay between different factors.
- To make predictions about future outcomes : Variables help researchers make predictions about future outcomes based on past observations. By analyzing patterns and relationships between different variables, researchers can make informed predictions about how different factors may affect future outcomes.
- To test hypotheses: Variables help researchers test hypotheses and theories. By collecting and analyzing data on different variables, researchers can test whether their predictions are accurate and whether their hypotheses are supported by the evidence.
Characteristics of Variables
Characteristics of Variables are as follows:
- Measurement : Variables can be measured using different scales, such as nominal, ordinal, interval, or ratio scales. The scale used to measure a variable can affect the type of statistical analysis that can be applied.
- Range : Variables have a range of values that they can take on. The range can be finite, such as the number of students in a class, or infinite, such as the range of possible values for a continuous variable like temperature.
- Variability : Variables can have different levels of variability, which refers to the degree to which the values of the variable differ from each other. Highly variable variables have a wide range of values, while low variability variables have values that are more similar to each other.
- Validity and reliability : Variables should be both valid and reliable to ensure accurate and consistent measurement. Validity refers to the extent to which a variable measures what it is intended to measure, while reliability refers to the consistency of the measurement over time.
- Directionality: Some variables have directionality, meaning that the relationship between the variables is not symmetrical. For example, in a study of the relationship between smoking and lung cancer, smoking is the independent variable and lung cancer is the dependent variable.
Advantages of Variables
Here are some of the advantages of using variables in research:
- Control : Variables allow researchers to control the effects of external factors that could influence the outcome of the study. By manipulating and controlling variables, researchers can isolate the effects of specific factors and measure their impact on the outcome.
- Replicability : Variables make it possible for other researchers to replicate the study and test its findings. By defining and measuring variables consistently, other researchers can conduct similar studies to validate the original findings.
- Accuracy : Variables make it possible to measure phenomena accurately and objectively. By defining and measuring variables precisely, researchers can reduce bias and increase the accuracy of their findings.
- Generalizability : Variables allow researchers to generalize their findings to larger populations. By selecting variables that are representative of the population, researchers can draw conclusions that are applicable to a broader range of individuals.
- Clarity : Variables help researchers to communicate their findings more clearly and effectively. By defining and categorizing variables, researchers can organize and present their findings in a way that is easily understandable to others.
Disadvantages of Variables
Here are some of the main disadvantages of using variables in research:
- Simplification : Variables may oversimplify the complexity of real-world phenomena. By breaking down a phenomenon into variables, researchers may lose important information and context, which can affect the accuracy and generalizability of their findings.
- Measurement error : Variables rely on accurate and precise measurement, and measurement error can affect the reliability and validity of research findings. The use of subjective or poorly defined variables can also introduce measurement error into the study.
- Confounding variables : Confounding variables are factors that are not measured but that affect the relationship between the variables of interest. If confounding variables are not accounted for, they can distort or obscure the relationship between the variables of interest.
- Limited scope: Variables are defined by the researcher, and the scope of the study is therefore limited by the researcher’s choice of variables. This can lead to a narrow focus that overlooks important aspects of the phenomenon being studied.
- Ethical concerns: The selection and measurement of variables may raise ethical concerns, especially in studies involving human subjects. For example, using variables that are related to sensitive topics, such as race or sexuality, may raise concerns about privacy and discrimination.
About the author

Muhammad Hassan
Researcher, Academic Writer, Web developer
You may also like

Control Variable – Definition, Types and Examples

Moderating Variable – Definition, Analysis...

Categorical Variable – Definition, Types and...

Independent Variable – Definition, Types and...

Ratio Variable – Definition, Purpose and Examples

Ordinal Variable – Definition, Purpose and...

Variables in Research | Types, Definiton & Examples

Introduction
What is a variable, what are the 5 types of variables in research, other variables in research.
Variables are fundamental components of research that allow for the measurement and analysis of data. They can be defined as characteristics or properties that can take on different values. In research design , understanding the types of variables and their roles is crucial for developing hypotheses , designing methods , and interpreting results .
This article outlines the the types of variables in research, including their definitions and examples, to provide a clear understanding of their use and significance in research studies. By categorizing variables into distinct groups based on their roles in research, their types of data, and their relationships with other variables, researchers can more effectively structure their studies and achieve more accurate conclusions.

A variable represents any characteristic, number, or quantity that can be measured or quantified. The term encompasses anything that can vary or change, ranging from simple concepts like age and height to more complex ones like satisfaction levels or economic status. Variables are essential in research as they are the foundational elements that researchers manipulate, measure, or control to gain insights into relationships, causes, and effects within their studies. They enable the framing of research questions, the formulation of hypotheses, and the interpretation of results.
Variables can be categorized based on their role in the study (such as independent and dependent variables ), the type of data they represent (quantitative or categorical), and their relationship to other variables (like confounding or control variables). Understanding what constitutes a variable and the various variable types available is a critical step in designing robust and meaningful research.

ATLAS.ti makes complex data easy to understand
Turn to our powerful data analysis tools to make the most of your research. Get started with a free trial.
Variables are crucial components in research, serving as the foundation for data collection , analysis , and interpretation . They are attributes or characteristics that can vary among subjects or over time, and understanding their types is essential for any study. Variables can be broadly classified into five main types, each with its distinct characteristics and roles within research.
This classification helps researchers in designing their studies, choosing appropriate measurement techniques, and analyzing their results accurately. The five types of variables include independent variables, dependent variables, categorical variables, continuous variables, and confounding variables. These categories not only facilitate a clearer understanding of the data but also guide the formulation of hypotheses and research methodologies.
Independent variables
Independent variables are foundational to the structure of research, serving as the factors or conditions that researchers manipulate or vary to observe their effects on dependent variables. These variables are considered "independent" because their variation does not depend on other variables within the study. Instead, they are the cause or stimulus that directly influences the outcomes being measured. For example, in an experiment to assess the effectiveness of a new teaching method on student performance, the teaching method applied (traditional vs. innovative) would be the independent variable.
The selection of an independent variable is a critical step in research design, as it directly correlates with the study's objective to determine causality or association. Researchers must clearly define and control these variables to ensure that observed changes in the dependent variable can be attributed to variations in the independent variable, thereby affirming the reliability of the results. In experimental research, the independent variable is what differentiates the control group from the experimental group, thereby setting the stage for meaningful comparison and analysis.
Dependent variables
Dependent variables are the outcomes or effects that researchers aim to explore and understand in their studies. These variables are called "dependent" because their values depend on the changes or variations of the independent variables.
Essentially, they are the responses or results that are measured to assess the impact of the independent variable's manipulation. For instance, in a study investigating the effect of exercise on weight loss, the amount of weight lost would be considered the dependent variable, as it depends on the exercise regimen (the independent variable).
The identification and measurement of the dependent variable are crucial for testing the hypothesis and drawing conclusions from the research. It allows researchers to quantify the effect of the independent variable , providing evidence for causal relationships or associations. In experimental settings, the dependent variable is what is being tested and measured across different groups or conditions, enabling researchers to assess the efficacy or impact of the independent variable's variation.
To ensure accuracy and reliability, the dependent variable must be defined clearly and measured consistently across all participants or observations. This consistency helps in reducing measurement errors and increases the validity of the research findings. By carefully analyzing the dependent variables, researchers can derive meaningful insights from their studies, contributing to the broader knowledge in their field.
Categorical variables
Categorical variables, also known as qualitative variables, represent types or categories that are used to group observations. These variables divide data into distinct groups or categories that lack a numerical value but hold significant meaning in research. Examples of categorical variables include gender (male, female, other), type of vehicle (car, truck, motorcycle), or marital status (single, married, divorced). These categories help researchers organize data into groups for comparison and analysis.
Categorical variables can be further classified into two subtypes: nominal and ordinal. Nominal variables are categories without any inherent order or ranking among them, such as blood type or ethnicity. Ordinal variables, on the other hand, imply a sort of ranking or order among the categories, like levels of satisfaction (high, medium, low) or education level (high school, bachelor's, master's, doctorate).
Understanding and identifying categorical variables is crucial in research as it influences the choice of statistical analysis methods. Since these variables represent categories without numerical significance, researchers employ specific statistical tests designed for a nominal or ordinal variable to draw meaningful conclusions. Properly classifying and analyzing categorical variables allow for the exploration of relationships between different groups within the study, shedding light on patterns and trends that might not be evident with numerical data alone.
Continuous variables
Continuous variables are quantitative variables that can take an infinite number of values within a given range. These variables are measured along a continuum and can represent very precise measurements. Examples of continuous variables include height, weight, temperature, and time. Because they can assume any value within a range, continuous variables allow for detailed analysis and a high degree of accuracy in research findings.
The ability to measure continuous variables at very fine scales makes them invaluable for many types of research, particularly in the natural and social sciences. For instance, in a study examining the effect of temperature on plant growth, temperature would be considered a continuous variable since it can vary across a wide spectrum and be measured to several decimal places.
When dealing with continuous variables, researchers often use methods incorporating a particular statistical test to accommodate a wide range of data points and the potential for infinite divisibility. This includes various forms of regression analysis, correlation, and other techniques suited for modeling and analyzing nuanced relationships between variables. The precision of continuous variables enhances the researcher's ability to detect patterns, trends, and causal relationships within the data, contributing to more robust and detailed conclusions.
Confounding variables
Confounding variables are those that can cause a false association between the independent and dependent variables, potentially leading to incorrect conclusions about the relationship being studied. These are extraneous variables that were not considered in the study design but can influence both the supposed cause and effect, creating a misleading correlation.
Identifying and controlling for a confounding variable is crucial in research to ensure the validity of the findings. This can be achieved through various methods, including randomization, stratification, and statistical control. Randomization helps to evenly distribute confounding variables across study groups, reducing their potential impact. Stratification involves analyzing the data within strata or layers that share common characteristics of the confounder. Statistical control allows researchers to adjust for the effects of confounders in the analysis phase.
Properly addressing confounding variables strengthens the credibility of research outcomes by clarifying the direct relationship between the dependent and independent variables, thus providing more accurate and reliable results.

Beyond the primary categories of variables commonly discussed in research methodology , there exists a diverse range of other variables that play significant roles in the design and analysis of studies. Below is an overview of some of these variables, highlighting their definitions and roles within research studies:
- Discrete variables : A discrete variable is a quantitative variable that represents quantitative data , such as the number of children in a family or the number of cars in a parking lot. Discrete variables can only take on specific values.
- Categorical variables : A categorical variable categorizes subjects or items into groups that do not have a natural numerical order. Categorical data includes nominal variables, like country of origin, and ordinal variables, such as education level.
- Predictor variables : Often used in statistical models, a predictor variable is used to forecast or predict the outcomes of other variables, not necessarily with a causal implication.
- Outcome variables : These variables represent the results or outcomes that researchers aim to explain or predict through their studies. An outcome variable is central to understanding the effects of predictor variables.
- Latent variables : Not directly observable, latent variables are inferred from other, directly measured variables. Examples include psychological constructs like intelligence or socioeconomic status.
- Composite variables : Created by combining multiple variables, composite variables can measure a concept more reliably or simplify the analysis. An example would be a composite happiness index derived from several survey questions .
- Preceding variables : These variables come before other variables in time or sequence, potentially influencing subsequent outcomes. A preceding variable is crucial in longitudinal studies to determine causality or sequences of events.

Master qualitative research with ATLAS.ti
Turn data into critical insights with our data analysis platform. Try out a free trial today.

Have a language expert improve your writing
Run a free plagiarism check in 10 minutes, automatically generate references for free.
- Knowledge Base
- Methodology
- Types of Variables in Research | Definitions & Examples
Types of Variables in Research | Definitions & Examples
Published on 19 September 2022 by Rebecca Bevans . Revised on 28 November 2022.
In statistical research, a variable is defined as an attribute of an object of study. Choosing which variables to measure is central to good experimental design .
You need to know which types of variables you are working with in order to choose appropriate statistical tests and interpret the results of your study.
You can usually identify the type of variable by asking two questions:
- What type of data does the variable contain?
- What part of the experiment does the variable represent?
Table of contents
Types of data: quantitative vs categorical variables, parts of the experiment: independent vs dependent variables, other common types of variables, frequently asked questions about variables.
Data is a specific measurement of a variable – it is the value you record in your data sheet. Data is generally divided into two categories:
- Quantitative data represents amounts.
- Categorical data represents groupings.
A variable that contains quantitative data is a quantitative variable ; a variable that contains categorical data is a categorical variable . Each of these types of variable can be broken down into further types.
Quantitative variables
When you collect quantitative data, the numbers you record represent real amounts that can be added, subtracted, divided, etc. There are two types of quantitative variables: discrete and continuous .
Categorical variables
Categorical variables represent groupings of some kind. They are sometimes recorded as numbers, but the numbers represent categories rather than actual amounts of things.
There are three types of categorical variables: binary , nominal , and ordinal variables.
*Note that sometimes a variable can work as more than one type! An ordinal variable can also be used as a quantitative variable if the scale is numeric and doesn’t need to be kept as discrete integers. For example, star ratings on product reviews are ordinal (1 to 5 stars), but the average star rating is quantitative.
Example data sheet
To keep track of your salt-tolerance experiment, you make a data sheet where you record information about the variables in the experiment, like salt addition and plant health.
To gather information about plant responses over time, you can fill out the same data sheet every few days until the end of the experiment. This example sheet is colour-coded according to the type of variable: nominal , continuous , ordinal , and binary .

Prevent plagiarism, run a free check.
Experiments are usually designed to find out what effect one variable has on another – in our example, the effect of salt addition on plant growth.
You manipulate the independent variable (the one you think might be the cause ) and then measure the dependent variable (the one you think might be the effect ) to find out what this effect might be.
You will probably also have variables that you hold constant ( control variables ) in order to focus on your experimental treatment.
In this experiment, we have one independent and three dependent variables.
The other variables in the sheet can’t be classified as independent or dependent, but they do contain data that you will need in order to interpret your dependent and independent variables.

What about correlational research?
When you do correlational research , the terms ‘dependent’ and ‘independent’ don’t apply, because you are not trying to establish a cause-and-effect relationship.
However, there might be cases where one variable clearly precedes the other (for example, rainfall leads to mud, rather than the other way around). In these cases, you may call the preceding variable (i.e., the rainfall) the predictor variable and the following variable (i.e., the mud) the outcome variable .
Once you have defined your independent and dependent variables and determined whether they are categorical or quantitative, you will be able to choose the correct statistical test .
But there are many other ways of describing variables that help with interpreting your results. Some useful types of variable are listed below.
A confounding variable is closely related to both the independent and dependent variables in a study. An independent variable represents the supposed cause , while the dependent variable is the supposed effect . A confounding variable is a third variable that influences both the independent and dependent variables.
Failing to account for confounding variables can cause you to wrongly estimate the relationship between your independent and dependent variables.
Discrete and continuous variables are two types of quantitative variables :
- Discrete variables represent counts (e.g., the number of objects in a collection).
- Continuous variables represent measurable amounts (e.g., water volume or weight).
You can think of independent and dependent variables in terms of cause and effect: an independent variable is the variable you think is the cause , while a dependent variable is the effect .
In an experiment, you manipulate the independent variable and measure the outcome in the dependent variable. For example, in an experiment about the effect of nutrients on crop growth:
- The independent variable is the amount of nutrients added to the crop field.
- The dependent variable is the biomass of the crops at harvest time.
Defining your variables, and deciding how you will manipulate and measure them, is an important part of experimental design .
Cite this Scribbr article
If you want to cite this source, you can copy and paste the citation or click the ‘Cite this Scribbr article’ button to automatically add the citation to our free Reference Generator.
Bevans, R. (2022, November 28). Types of Variables in Research | Definitions & Examples. Scribbr. Retrieved 14 May 2024, from https://www.scribbr.co.uk/research-methods/variables-types/
Is this article helpful?

Rebecca Bevans
Other students also liked, a quick guide to experimental design | 5 steps & examples, quasi-experimental design | definition, types & examples, construct validity | definition, types, & examples.
- USC Libraries
- Research Guides
Organizing Your Social Sciences Research Paper
- Independent and Dependent Variables
- Purpose of Guide
- Design Flaws to Avoid
- Glossary of Research Terms
- Reading Research Effectively
- Narrowing a Topic Idea
- Broadening a Topic Idea
- Extending the Timeliness of a Topic Idea
- Academic Writing Style
- Applying Critical Thinking
- Choosing a Title
- Making an Outline
- Paragraph Development
- Research Process Video Series
- Executive Summary
- The C.A.R.S. Model
- Background Information
- The Research Problem/Question
- Theoretical Framework
- Citation Tracking
- Content Alert Services
- Evaluating Sources
- Primary Sources
- Secondary Sources
- Tiertiary Sources
- Scholarly vs. Popular Publications
- Qualitative Methods
- Quantitative Methods
- Insiderness
- Using Non-Textual Elements
- Limitations of the Study
- Common Grammar Mistakes
- Writing Concisely
- Avoiding Plagiarism
- Footnotes or Endnotes?
- Further Readings
- Generative AI and Writing
- USC Libraries Tutorials and Other Guides
- Bibliography
Definitions
Dependent Variable The variable that depends on other factors that are measured. These variables are expected to change as a result of an experimental manipulation of the independent variable or variables. It is the presumed effect.
Independent Variable The variable that is stable and unaffected by the other variables you are trying to measure. It refers to the condition of an experiment that is systematically manipulated by the investigator. It is the presumed cause.
Cramer, Duncan and Dennis Howitt. The SAGE Dictionary of Statistics . London: SAGE, 2004; Penslar, Robin Levin and Joan P. Porter. Institutional Review Board Guidebook: Introduction . Washington, DC: United States Department of Health and Human Services, 2010; "What are Dependent and Independent Variables?" Graphic Tutorial.
Identifying Dependent and Independent Variables
Don't feel bad if you are confused about what is the dependent variable and what is the independent variable in social and behavioral sciences research . However, it's important that you learn the difference because framing a study using these variables is a common approach to organizing the elements of a social sciences research study in order to discover relevant and meaningful results. Specifically, it is important for these two reasons:
- You need to understand and be able to evaluate their application in other people's research.
- You need to apply them correctly in your own research.
A variable in research simply refers to a person, place, thing, or phenomenon that you are trying to measure in some way. The best way to understand the difference between a dependent and independent variable is that the meaning of each is implied by what the words tell us about the variable you are using. You can do this with a simple exercise from the website, Graphic Tutorial. Take the sentence, "The [independent variable] causes a change in [dependent variable] and it is not possible that [dependent variable] could cause a change in [independent variable]." Insert the names of variables you are using in the sentence in the way that makes the most sense. This will help you identify each type of variable. If you're still not sure, consult with your professor before you begin to write.
Fan, Shihe. "Independent Variable." In Encyclopedia of Research Design. Neil J. Salkind, editor. (Thousand Oaks, CA: SAGE, 2010), pp. 592-594; "What are Dependent and Independent Variables?" Graphic Tutorial; Salkind, Neil J. "Dependent Variable." In Encyclopedia of Research Design , Neil J. Salkind, editor. (Thousand Oaks, CA: SAGE, 2010), pp. 348-349;
Structure and Writing Style
The process of examining a research problem in the social and behavioral sciences is often framed around methods of analysis that compare, contrast, correlate, average, or integrate relationships between or among variables . Techniques include associations, sampling, random selection, and blind selection. Designation of the dependent and independent variable involves unpacking the research problem in a way that identifies a general cause and effect and classifying these variables as either independent or dependent.
The variables should be outlined in the introduction of your paper and explained in more detail in the methods section . There are no rules about the structure and style for writing about independent or dependent variables but, as with any academic writing, clarity and being succinct is most important.
After you have described the research problem and its significance in relation to prior research, explain why you have chosen to examine the problem using a method of analysis that investigates the relationships between or among independent and dependent variables . State what it is about the research problem that lends itself to this type of analysis. For example, if you are investigating the relationship between corporate environmental sustainability efforts [the independent variable] and dependent variables associated with measuring employee satisfaction at work using a survey instrument, you would first identify each variable and then provide background information about the variables. What is meant by "environmental sustainability"? Are you looking at a particular company [e.g., General Motors] or are you investigating an industry [e.g., the meat packing industry]? Why is employee satisfaction in the workplace important? How does a company make their employees aware of sustainability efforts and why would a company even care that its employees know about these efforts?
Identify each variable for the reader and define each . In the introduction, this information can be presented in a paragraph or two when you describe how you are going to study the research problem. In the methods section, you build on the literature review of prior studies about the research problem to describe in detail background about each variable, breaking each down for measurement and analysis. For example, what activities do you examine that reflect a company's commitment to environmental sustainability? Levels of employee satisfaction can be measured by a survey that asks about things like volunteerism or a desire to stay at the company for a long time.
The structure and writing style of describing the variables and their application to analyzing the research problem should be stated and unpacked in such a way that the reader obtains a clear understanding of the relationships between the variables and why they are important. This is also important so that the study can be replicated in the future using the same variables but applied in a different way.
Fan, Shihe. "Independent Variable." In Encyclopedia of Research Design. Neil J. Salkind, editor. (Thousand Oaks, CA: SAGE, 2010), pp. 592-594; "What are Dependent and Independent Variables?" Graphic Tutorial; “Case Example for Independent and Dependent Variables.” ORI Curriculum Examples. U.S. Department of Health and Human Services, Office of Research Integrity; Salkind, Neil J. "Dependent Variable." In Encyclopedia of Research Design , Neil J. Salkind, editor. (Thousand Oaks, CA: SAGE, 2010), pp. 348-349; “Independent Variables and Dependent Variables.” Karl L. Wuensch, Department of Psychology, East Carolina University [posted email exchange]; “Variables.” Elements of Research. Dr. Camille Nebeker, San Diego State University.
- << Previous: Design Flaws to Avoid
- Next: Glossary of Research Terms >>
- Last Updated: May 18, 2024 11:38 AM
- URL: https://libguides.usc.edu/writingguide
Research Variables 101
Independent variables, dependent variables, control variables and more
By: Derek Jansen (MBA) | Expert Reviewed By: Kerryn Warren (PhD) | January 2023
If you’re new to the world of research, especially scientific research, you’re bound to run into the concept of variables , sooner or later. If you’re feeling a little confused, don’t worry – you’re not the only one! Independent variables, dependent variables, confounding variables – it’s a lot of jargon. In this post, we’ll unpack the terminology surrounding research variables using straightforward language and loads of examples .
Overview: Variables In Research
What (exactly) is a variable.
The simplest way to understand a variable is as any characteristic or attribute that can experience change or vary over time or context – hence the name “variable”. For example, the dosage of a particular medicine could be classified as a variable, as the amount can vary (i.e., a higher dose or a lower dose). Similarly, gender, age or ethnicity could be considered demographic variables, because each person varies in these respects.
Within research, especially scientific research, variables form the foundation of studies, as researchers are often interested in how one variable impacts another, and the relationships between different variables. For example:
- How someone’s age impacts their sleep quality
- How different teaching methods impact learning outcomes
- How diet impacts weight (gain or loss)
As you can see, variables are often used to explain relationships between different elements and phenomena. In scientific studies, especially experimental studies, the objective is often to understand the causal relationships between variables. In other words, the role of cause and effect between variables. This is achieved by manipulating certain variables while controlling others – and then observing the outcome. But, we’ll get into that a little later…
The “Big 3” Variables
Variables can be a little intimidating for new researchers because there are a wide variety of variables, and oftentimes, there are multiple labels for the same thing. To lay a firm foundation, we’ll first look at the three main types of variables, namely:
- Independent variables (IV)
- Dependant variables (DV)
- Control variables
What is an independent variable?
Simply put, the independent variable is the “ cause ” in the relationship between two (or more) variables. In other words, when the independent variable changes, it has an impact on another variable.
For example:
- Increasing the dosage of a medication (Variable A) could result in better (or worse) health outcomes for a patient (Variable B)
- Changing a teaching method (Variable A) could impact the test scores that students earn in a standardised test (Variable B)
- Varying one’s diet (Variable A) could result in weight loss or gain (Variable B).
It’s useful to know that independent variables can go by a few different names, including, explanatory variables (because they explain an event or outcome) and predictor variables (because they predict the value of another variable). Terminology aside though, the most important takeaway is that independent variables are assumed to be the “cause” in any cause-effect relationship. As you can imagine, these types of variables are of major interest to researchers, as many studies seek to understand the causal factors behind a phenomenon.
Need a helping hand?
What is a dependent variable?
While the independent variable is the “ cause ”, the dependent variable is the “ effect ” – or rather, the affected variable . In other words, the dependent variable is the variable that is assumed to change as a result of a change in the independent variable.
Keeping with the previous example, let’s look at some dependent variables in action:
- Health outcomes (DV) could be impacted by dosage changes of a medication (IV)
- Students’ scores (DV) could be impacted by teaching methods (IV)
- Weight gain or loss (DV) could be impacted by diet (IV)
In scientific studies, researchers will typically pay very close attention to the dependent variable (or variables), carefully measuring any changes in response to hypothesised independent variables. This can be tricky in practice, as it’s not always easy to reliably measure specific phenomena or outcomes – or to be certain that the actual cause of the change is in fact the independent variable.
As the adage goes, correlation is not causation . In other words, just because two variables have a relationship doesn’t mean that it’s a causal relationship – they may just happen to vary together. For example, you could find a correlation between the number of people who own a certain brand of car and the number of people who have a certain type of job. Just because the number of people who own that brand of car and the number of people who have that type of job is correlated, it doesn’t mean that owning that brand of car causes someone to have that type of job or vice versa. The correlation could, for example, be caused by another factor such as income level or age group, which would affect both car ownership and job type.
To confidently establish a causal relationship between an independent variable and a dependent variable (i.e., X causes Y), you’ll typically need an experimental design , where you have complete control over the environmen t and the variables of interest. But even so, this doesn’t always translate into the “real world”. Simply put, what happens in the lab sometimes stays in the lab!
As an alternative to pure experimental research, correlational or “ quasi-experimental ” research (where the researcher cannot manipulate or change variables) can be done on a much larger scale more easily, allowing one to understand specific relationships in the real world. These types of studies also assume some causality between independent and dependent variables, but it’s not always clear. So, if you go this route, you need to be cautious in terms of how you describe the impact and causality between variables and be sure to acknowledge any limitations in your own research.

What is a control variable?
In an experimental design, a control variable (or controlled variable) is a variable that is intentionally held constant to ensure it doesn’t have an influence on any other variables. As a result, this variable remains unchanged throughout the course of the study. In other words, it’s a variable that’s not allowed to vary – tough life 🙂
As we mentioned earlier, one of the major challenges in identifying and measuring causal relationships is that it’s difficult to isolate the impact of variables other than the independent variable. Simply put, there’s always a risk that there are factors beyond the ones you’re specifically looking at that might be impacting the results of your study. So, to minimise the risk of this, researchers will attempt (as best possible) to hold other variables constant . These factors are then considered control variables.
Some examples of variables that you may need to control include:
- Temperature
- Time of day
- Noise or distractions
Which specific variables need to be controlled for will vary tremendously depending on the research project at hand, so there’s no generic list of control variables to consult. As a researcher, you’ll need to think carefully about all the factors that could vary within your research context and then consider how you’ll go about controlling them. A good starting point is to look at previous studies similar to yours and pay close attention to which variables they controlled for.
Of course, you won’t always be able to control every possible variable, and so, in many cases, you’ll just have to acknowledge their potential impact and account for them in the conclusions you draw. Every study has its limitations , so don’t get fixated or discouraged by troublesome variables. Nevertheless, always think carefully about the factors beyond what you’re focusing on – don’t make assumptions!

Other types of variables
As we mentioned, independent, dependent and control variables are the most common variables you’ll come across in your research, but they’re certainly not the only ones you need to be aware of. Next, we’ll look at a few “secondary” variables that you need to keep in mind as you design your research.
- Moderating variables
- Mediating variables
- Confounding variables
- Latent variables
Let’s jump into it…
What is a moderating variable?
A moderating variable is a variable that influences the strength or direction of the relationship between an independent variable and a dependent variable. In other words, moderating variables affect how much (or how little) the IV affects the DV, or whether the IV has a positive or negative relationship with the DV (i.e., moves in the same or opposite direction).
For example, in a study about the effects of sleep deprivation on academic performance, gender could be used as a moderating variable to see if there are any differences in how men and women respond to a lack of sleep. In such a case, one may find that gender has an influence on how much students’ scores suffer when they’re deprived of sleep.
It’s important to note that while moderators can have an influence on outcomes , they don’t necessarily cause them ; rather they modify or “moderate” existing relationships between other variables. This means that it’s possible for two different groups with similar characteristics, but different levels of moderation, to experience very different results from the same experiment or study design.
What is a mediating variable?
Mediating variables are often used to explain the relationship between the independent and dependent variable (s). For example, if you were researching the effects of age on job satisfaction, then education level could be considered a mediating variable, as it may explain why older people have higher job satisfaction than younger people – they may have more experience or better qualifications, which lead to greater job satisfaction.
Mediating variables also help researchers understand how different factors interact with each other to influence outcomes. For instance, if you wanted to study the effect of stress on academic performance, then coping strategies might act as a mediating factor by influencing both stress levels and academic performance simultaneously. For example, students who use effective coping strategies might be less stressed but also perform better academically due to their improved mental state.
In addition, mediating variables can provide insight into causal relationships between two variables by helping researchers determine whether changes in one factor directly cause changes in another – or whether there is an indirect relationship between them mediated by some third factor(s). For instance, if you wanted to investigate the impact of parental involvement on student achievement, you would need to consider family dynamics as a potential mediator, since it could influence both parental involvement and student achievement simultaneously.

What is a confounding variable?
A confounding variable (also known as a third variable or lurking variable ) is an extraneous factor that can influence the relationship between two variables being studied. Specifically, for a variable to be considered a confounding variable, it needs to meet two criteria:
- It must be correlated with the independent variable (this can be causal or not)
- It must have a causal impact on the dependent variable (i.e., influence the DV)
Some common examples of confounding variables include demographic factors such as gender, ethnicity, socioeconomic status, age, education level, and health status. In addition to these, there are also environmental factors to consider. For example, air pollution could confound the impact of the variables of interest in a study investigating health outcomes.
Naturally, it’s important to identify as many confounding variables as possible when conducting your research, as they can heavily distort the results and lead you to draw incorrect conclusions . So, always think carefully about what factors may have a confounding effect on your variables of interest and try to manage these as best you can.
What is a latent variable?
Latent variables are unobservable factors that can influence the behaviour of individuals and explain certain outcomes within a study. They’re also known as hidden or underlying variables , and what makes them rather tricky is that they can’t be directly observed or measured . Instead, latent variables must be inferred from other observable data points such as responses to surveys or experiments.
For example, in a study of mental health, the variable “resilience” could be considered a latent variable. It can’t be directly measured , but it can be inferred from measures of mental health symptoms, stress, and coping mechanisms. The same applies to a lot of concepts we encounter every day – for example:
- Emotional intelligence
- Quality of life
- Business confidence
- Ease of use
One way in which we overcome the challenge of measuring the immeasurable is latent variable models (LVMs). An LVM is a type of statistical model that describes a relationship between observed variables and one or more unobserved (latent) variables. These models allow researchers to uncover patterns in their data which may not have been visible before, thanks to their complexity and interrelatedness with other variables. Those patterns can then inform hypotheses about cause-and-effect relationships among those same variables which were previously unknown prior to running the LVM. Powerful stuff, we say!

Let’s recap
In the world of scientific research, there’s no shortage of variable types, some of which have multiple names and some of which overlap with each other. In this post, we’ve covered some of the popular ones, but remember that this is not an exhaustive list .
To recap, we’ve explored:
- Independent variables (the “cause”)
- Dependent variables (the “effect”)
- Control variables (the variable that’s not allowed to vary)
If you’re still feeling a bit lost and need a helping hand with your research project, check out our 1-on-1 coaching service , where we guide you through each step of the research journey. Also, be sure to check out our free dissertation writing course and our collection of free, fully-editable chapter templates .

Psst... there’s more!
This post was based on one of our popular Research Bootcamps . If you're working on a research project, you'll definitely want to check this out ...
You Might Also Like:

Very informative, concise and helpful. Thank you

Helping information.Thanks

practical and well-demonstrated

Very helpful and insightful
Submit a Comment Cancel reply
Your email address will not be published. Required fields are marked *
Save my name, email, and website in this browser for the next time I comment.
- Print Friendly
Independent and Dependent Variables
Saul Mcleod, PhD
Editor-in-Chief for Simply Psychology
BSc (Hons) Psychology, MRes, PhD, University of Manchester
Saul Mcleod, PhD., is a qualified psychology teacher with over 18 years of experience in further and higher education. He has been published in peer-reviewed journals, including the Journal of Clinical Psychology.
Learn about our Editorial Process
Olivia Guy-Evans, MSc
Associate Editor for Simply Psychology
BSc (Hons) Psychology, MSc Psychology of Education
Olivia Guy-Evans is a writer and associate editor for Simply Psychology. She has previously worked in healthcare and educational sectors.
On This Page:
In research, a variable is any characteristic, number, or quantity that can be measured or counted in experimental investigations . One is called the dependent variable, and the other is the independent variable.
In research, the independent variable is manipulated to observe its effect, while the dependent variable is the measured outcome. Essentially, the independent variable is the presumed cause, and the dependent variable is the observed effect.
Variables provide the foundation for examining relationships, drawing conclusions, and making predictions in research studies.

Independent Variable
In psychology, the independent variable is the variable the experimenter manipulates or changes and is assumed to directly affect the dependent variable.
It’s considered the cause or factor that drives change, allowing psychologists to observe how it influences behavior, emotions, or other dependent variables in an experimental setting. Essentially, it’s the presumed cause in cause-and-effect relationships being studied.
For example, allocating participants to drug or placebo conditions (independent variable) to measure any changes in the intensity of their anxiety (dependent variable).
In a well-designed experimental study , the independent variable is the only important difference between the experimental (e.g., treatment) and control (e.g., placebo) groups.
By changing the independent variable and holding other factors constant, psychologists aim to determine if it causes a change in another variable, called the dependent variable.
For example, in a study investigating the effects of sleep on memory, the amount of sleep (e.g., 4 hours, 8 hours, 12 hours) would be the independent variable, as the researcher might manipulate or categorize it to see its impact on memory recall, which would be the dependent variable.
Dependent Variable
In psychology, the dependent variable is the variable being tested and measured in an experiment and is “dependent” on the independent variable.
In psychology, a dependent variable represents the outcome or results and can change based on the manipulations of the independent variable. Essentially, it’s the presumed effect in a cause-and-effect relationship being studied.
An example of a dependent variable is depression symptoms, which depend on the independent variable (type of therapy).
In an experiment, the researcher looks for the possible effect on the dependent variable that might be caused by changing the independent variable.
For instance, in a study examining the effects of a new study technique on exam performance, the technique would be the independent variable (as it is being introduced or manipulated), while the exam scores would be the dependent variable (as they represent the outcome of interest that’s being measured).
Examples in Research Studies
For example, we might change the type of information (e.g., organized or random) given to participants to see how this might affect the amount of information remembered.
In this example, the type of information is the independent variable (because it changes), and the amount of information remembered is the dependent variable (because this is being measured).

For the following hypotheses, name the IV and the DV.
1. Lack of sleep significantly affects learning in 10-year-old boys.
IV……………………………………………………
DV…………………………………………………..
2. Social class has a significant effect on IQ scores.
DV……………………………………………….…
3. Stressful experiences significantly increase the likelihood of headaches.
4. Time of day has a significant effect on alertness.
Operationalizing Variables
To ensure cause and effect are established, it is important that we identify exactly how the independent and dependent variables will be measured; this is known as operationalizing the variables.
Operational variables (or operationalizing definitions) refer to how you will define and measure a specific variable as it is used in your study. This enables another psychologist to replicate your research and is essential in establishing reliability (achieving consistency in the results).
For example, if we are concerned with the effect of media violence on aggression, then we need to be very clear about what we mean by the different terms. In this case, we must state what we mean by the terms “media violence” and “aggression” as we will study them.
Therefore, you could state that “media violence” is operationally defined (in your experiment) as ‘exposure to a 15-minute film showing scenes of physical assault’; “aggression” is operationally defined as ‘levels of electrical shocks administered to a second ‘participant’ in another room.
In another example, the hypothesis “Young participants will have significantly better memories than older participants” is not operationalized. How do we define “young,” “old,” or “memory”? “Participants aged between 16 – 30 will recall significantly more nouns from a list of twenty than participants aged between 55 – 70” is operationalized.
The key point here is that we have clarified what we mean by the terms as they were studied and measured in our experiment.
If we didn’t do this, it would be very difficult (if not impossible) to compare the findings of different studies to the same behavior.
Operationalization has the advantage of generally providing a clear and objective definition of even complex variables. It also makes it easier for other researchers to replicate a study and check for reliability .
For the following hypotheses, name the IV and the DV and operationalize both variables.
1. Women are more attracted to men without earrings than men with earrings.
I.V._____________________________________________________________
D.V. ____________________________________________________________
Operational definitions:
I.V. ____________________________________________________________
2. People learn more when they study in a quiet versus noisy place.
I.V. _________________________________________________________
D.V. ___________________________________________________________
3. People who exercise regularly sleep better at night.
Can there be more than one independent or dependent variable in a study?
Yes, it is possible to have more than one independent or dependent variable in a study.
In some studies, researchers may want to explore how multiple factors affect the outcome, so they include more than one independent variable.
Similarly, they may measure multiple things to see how they are influenced, resulting in multiple dependent variables. This allows for a more comprehensive understanding of the topic being studied.
What are some ethical considerations related to independent and dependent variables?
Ethical considerations related to independent and dependent variables involve treating participants fairly and protecting their rights.
Researchers must ensure that participants provide informed consent and that their privacy and confidentiality are respected. Additionally, it is important to avoid manipulating independent variables in ways that could cause harm or discomfort to participants.
Researchers should also consider the potential impact of their study on vulnerable populations and ensure that their methods are unbiased and free from discrimination.
Ethical guidelines help ensure that research is conducted responsibly and with respect for the well-being of the participants involved.
Can qualitative data have independent and dependent variables?
Yes, both quantitative and qualitative data can have independent and dependent variables.
In quantitative research, independent variables are usually measured numerically and manipulated to understand their impact on the dependent variable. In qualitative research, independent variables can be qualitative in nature, such as individual experiences, cultural factors, or social contexts, influencing the phenomenon of interest.
The dependent variable, in both cases, is what is being observed or studied to see how it changes in response to the independent variable.
So, regardless of the type of data, researchers analyze the relationship between independent and dependent variables to gain insights into their research questions.
Can the same variable be independent in one study and dependent in another?
Yes, the same variable can be independent in one study and dependent in another.
The classification of a variable as independent or dependent depends on how it is used within a specific study. In one study, a variable might be manipulated or controlled to see its effect on another variable, making it independent.
However, in a different study, that same variable might be the one being measured or observed to understand its relationship with another variable, making it dependent.
The role of a variable as independent or dependent can vary depending on the research question and study design.
Related Articles

Research Methodology
Qualitative Data Coding

What Is a Focus Group?

Cross-Cultural Research Methodology In Psychology

What Is Internal Validity In Research?

Research Methodology , Statistics
What Is Face Validity In Research? Importance & How To Measure

Criterion Validity: Definition & Examples
Our websites may use cookies to personalize and enhance your experience. By continuing without changing your cookie settings, you agree to this collection. For more information, please see our University Websites Privacy Notice .
Neag School of Education
Educational Research Basics by Del Siegle
Each person/thing we collect data on is called an OBSERVATION (in our work these are usually people/subjects. Currently, the term participant rather than subject is used when describing the people from whom we collect data).
OBSERVATIONS (participants) possess a variety of CHARACTERISTICS .
If a CHARACTERISTIC of an OBSERVATION (participant) is the same for every member of the group (doesn’t vary) it is called a CONSTANT .
If a CHARACTERISTIC of an OBSERVATION (participant) differs for group members it is called a VARIABLE . In research we don’t get excited about CONSTANTS (since everyone is the same on that characteristic); we’re more interested in VARIABLES. Variables can be classified as QUANTITATIVE or QUALITATIVE (also known as CATEGORICAL).
QUANTITATIVE variables are ones that exist along a continuum that runs from low to high. Ordinal, interval, and ratio variables are quantitative. QUANTITATIVE variables are sometimes called CONTINUOUS VARIABLES because they have a variety (continuum) of characteristics. Height in inches and scores on a test would be examples of quantitative variables.
QUALITATIVE variables do not express differences in amount, only differences. They are sometimes referred to as CATEGORICAL variables because they classify by categories. Nominal variables such as gender, religion, or eye color are CATEGORICAL variables. Generally speaking, categorical variables
A special case of a CATEGORICAL variable is a DICHOTOMOUS VARIABLE. DICHOTOMOUS variables have only two CHARACTERISTICS (male or female). When naming QUALITATIVE variables, it is important to name the category rather than the levels (i.e., gender is the variable name, not male and female).
Variables have different purposes or roles…
Independent (Experimental, Manipulated, Treatment, Grouping) Variable- That factor which is measured, manipulated, or selected by the experimenter to determine its relationship to an observed phenomenon. “In a research study, independent variables are antecedent conditions that are presumed to affect a dependent variable. They are either manipulated by the researcher or are observed by the researcher so that their values can be related to that of the dependent variable. For example, in a research study on the relationship between mosquitoes and mosquito bites, the number of mosquitoes per acre of ground would be an independent variable” (Jaeger, 1990, p. 373)
While the independent variable is often manipulated by the researcher, it can also be a classification where subjects are assigned to groups. In a study where one variable causes the other, the independent variable is the cause. In a study where groups are being compared, the independent variable is the group classification.
Dependent (Outcome) Variable- That factor which is observed and measured to determine the effect of the independent variable, i.e., that factor that appears, disappears, or varies as the experimenter introduces, removes, or varies the independent variable. “In a research study, the independent variable defines a principal focus of research interest. It is the consequent variable that is presumably affected by one or more independent variables that are either manipulated by the researcher or observed by the researcher and regarded as antecedent conditions that determine the value of the dependent variable. For example, in a study of the relationship between mosquitoes and mosquito bites, the number of mosquito bites per hour would be the dependent variable” (Jaeger, 1990, p. 370). The dependent variable is the participant’s response.
The dependent variable is the outcome. In an experiment, it may be what was caused or what changed as a result of the study. In a comparison of groups, it is what they differ on.
Moderator Variable- That factor which is measured, manipulated, or selected by the experimenter to discover whether it modifies the relationship of the independent variable to an observed phenomenon. It is a special type of independent variable.
The independent variable’s relationship with the dependent variable may change under different conditions. That condition is the moderator variable. In a study of two methods of teaching reading, one of the methods of teaching reading may work better with boys than girls. Method of teaching reading is the independent variable and reading achievement is the dependent variable. Gender is the moderator variable because it moderates or changes the relationship between the independent variable (teaching method) and the dependent variable (reading achievement).
Suppose we do a study of reading achievement where we compare whole language with phonics, and we also include students’ social economic status (SES) as a variable. The students are randomly assigned to either whole language instruction or phonics instruction. There are students of high and low SES in each group.
Let’s assume that we found that whole language instruction worked better than phonics instruction with the high SES students, but phonics instruction worked better than whole language instruction with the low SES students. Later you will learn in statistics that this is an interaction effect. In this study, language instruction was the independent variable (with two levels: phonics and whole language). SES was the moderator variable (with two levels: high and low). Reading achievement was the dependent variable (measured on a continuous scale so there aren’t levels).
With a moderator variable, we find the type of instruction did make a difference, but it worked differently for the two groups on the moderator variable. We select this moderator variable because we think it is a variable that will moderate the effect of the independent on the dependent. We make this decision before we start the study.
If the moderator had not been in the study above, we would have said that there was no difference in reading achievement between the two types of reading instruction. This would have happened because the average of the high and low scores of each SES group within a reading instruction group would cancel each other an produce what appears to be average reading achievement in each instruction group (i.e., Phonics: Low—6 and High—2; Whole Language: Low—2 and High—6; Phonics has an average of 4 and Whole Language has an average of 4. If we just look at the averages (without regard to the moderator), it appears that the instruction types produced similar results).
Extraneous Variable- Those factors which cannot be controlled. Extraneous variables are independent variables that have not been controlled. They may or may not influence the results. One way to control an extraneous variable which might influence the results is to make it a constant (keep everyone in the study alike on that characteristic). If SES were thought to influence achievement, then restricting the study to one SES level would eliminate SES as an extraneous variable.
Here are some examples similar to your homework:
Null Hypothesis: Students who receive pizza coupons as a reward do not read more books than students who do not receive pizza coupon rewards. Independent Variable: Reward Status Dependent Variable: Number of Books Read
High achieving students do not perform better than low achieving student when writing stories regardless of whether they use paper and pencil or a word processor. Independent Variable: Instrument Used for Writing Moderator Variable: Ability Level of the Students Dependent Variable: Quality of Stories Written When we are comparing two groups, the groups are the independent variable. When we are testing whether something influences something else, the influence (cause) is the independent variable. The independent variable is also the one we manipulate. For example, consider the hypothesis “Teachers given higher pay will have more positive attitudes toward children than teachers given lower pay.” One approach is to ask ourselves “Are there two or more groups being compared?” The answer is “Yes.” “What are the groups?” Teachers who are given higher pay and teachers who are given lower pay. Therefore, the independent variable is teacher pay (it has two levels– high pay and low pay). The dependent variable (what the groups differ on) is attitude towards school.
We could also approach this another way. “Is something causing something else?” The answer is “Yes.” “What is causing what?” Teacher pay is causing attitude towards school. Therefore, teacher pay is the independent variable (cause) and attitude towards school is the dependent variable (outcome).
Research Questions and Hypotheses
The research question drives the study. It should specifically state what is being investigated. Statisticians often convert their research questions to null and alternative hypotheses. The null hypothesis states that no relationship (correlation study) or difference (experimental study) exists. Converting research questions to hypotheses is a simple task. Take the questions and make it a positive statement that says a relationship exists (correlation studies) or a difference exists (experiment study) between the groups and we have the alternative hypothesis. Write a statement that a relationship does not exist or a difference does not exist and we have the null hypothesis.
Format for sample research questions and accompanying hypotheses:
Research Question for Relationships: Is there a relationship between height and weight? Null Hypothesis: There is no relationship between height and weight. Alternative Hypothesis: There is a relationship between height and weight.
When a researcher states a nondirectional hypothesis in a study that compares the performance of two groups, she doesn’t state which group she believes will perform better. If the word “more” or “less” appears in the hypothesis, there is a good chance that we are reading a directional hypothesis. A directional hypothesis is one where the researcher states which group she believes will perform better. Most researchers use nondirectional hypotheses.
We usually write the alternative hypothesis (what we believe might happen) before we write the null hypothesis (saying it won’t happen).
Directional Research Question for Differences: Do boys like reading more than girls? Null Hypothesis: Boys do not like reading more than girls. Alternative Hypothesis: Boys do like reading more than girls.
Nondirectional Research Question for Differences: Is there a difference between boys’ and girls’ attitude towards reading? –or– Do boys’ and girls’ attitude towards reading differ? Null Hypothesis: There is no difference between boys’ and girls’ attitude towards reading. –or– Boys’ and girls’ attitude towards reading do not differ. Alternative Hypothesis: There is a difference between boys’ and girls’ attitude towards reading. –or– Boys’ and girls’ attitude towards reading differ.
Del Siegle, Ph.D. Neag School of Education – University of Connecticut [email protected] www.delsiegle.com
- How it works

Types of Variables – A Comprehensive Guide
Published by Carmen Troy at August 14th, 2021 , Revised On October 26, 2023
A variable is any qualitative or quantitative characteristic that can change and have more than one value, such as age, height, weight, gender, etc.
Before conducting research, it’s essential to know what needs to be measured or analysed and choose a suitable statistical test to present your study’s findings.
In most cases, you can do it by identifying the key issues/variables related to your research’s main topic.
Example: If you want to test whether the hybridisation of plants harms the health of people. You can use the key variables like agricultural techniques, type of soil, environmental factors, types of pesticides used, the process of hybridisation, type of yield obtained after hybridisation, type of yield without hybridisation, etc.
Variables are broadly categorised into:
- Independent variables
- Dependent variable
- Control variable
Independent Vs. Dependent Vs. Control Variable
The research includes finding ways:
- To change the independent variables.
- To prevent the controlled variables from changing.
- To measure the dependent variables.
Note: The term dependent and independent is not applicable in correlational research as this is not a controlled experiment. A researcher doesn’t have control over the variables. The association and between two or more variables are measured. If one variable affects another one, then it’s called the predictor variable and outcome variable.
Example: Correlation between investment (predictor variable) and profit (outcome variable)
What data collection best suits your research?
- Find out by hiring an expert from ResearchProspect today!
- Despite how challenging the subject may be, we are here to help you.

Types of Variables Based on the Types of Data
A data is referred to as the information and statistics gathered for analysis of a research topic. Data is broadly divided into two categories, such as:
Quantitative/Numerical data is associated with the aspects of measurement, quantity, and extent.
Categorial data is associated with groupings.
A qualitative variable consists of qualitative data, and a quantitative variable consists of a quantitative variable.

Quantitative Variable
The quantitative variable is associated with measurement, quantity, and extent, like how many . It follows the statistical, mathematical, and computational techniques in numerical data such as percentages and statistics. The research is conducted on a large group of population.
Example: Find out the weight of students of the fifth standard studying in government schools.
The quantitative variable can be further categorised into continuous and discrete.
Categorial Variable
The categorical variable includes measurements that vary in categories such as names but not in terms of rank or degree. It means one level of a categorical variable cannot be considered better or greater than another level.
Example: Gender, brands, colors, zip codes
The categorical variable is further categorised into three types:
Note: Sometimes, an ordinal variable also acts as a quantitative variable. Ordinal data has an order, but the intervals between scale points may be uneven.
Example: Numbers on a rating scale represent the reviews’ rank or range from below average to above average. However, it also represents a quantitative variable showing how many stars and how much rating is given.
Not sure which statistical tests to use for your data?
Let the experts at researchprospect do the daunting work for you..
Using our approach, we illustrate how to collect data, sample sizes, validity, reliability, credibility, and ethics, so you won’t have to do it all by yourself!
Other Types of Variables
It’s important to understand the difference between dependent and independent variables and know whether they are quantitative or categorical to choose the appropriate statistical test.
There are many other types of variables to help you differentiate and understand them.
Also, read a comprehensive guide written about inductive and deductive reasoning .
- Entertainment
- Online education
- Database management, storage, and retrieval
Frequently Asked Questions
What are the 10 types of variables in research.
The 10 types of variables in research are:
- Independent
- Confounding
- Categorical
- Extraneous.
What is an independent variable?
An independent variable, often termed the predictor or explanatory variable, is the variable manipulated or categorized in an experiment to observe its effect on another variable, called the dependent variable. It’s the presumed cause in a cause-and-effect relationship, determining if changes in it produce changes in the observed outcome.
What is a variable?
In research, a variable is any attribute, quantity, or characteristic that can be measured or counted. It can take on various values, making it “variable.” Variables can be classified as independent (manipulated), dependent (observed outcome), or control (kept constant). They form the foundation for hypotheses, observations, and data analysis in studies.
What is a dependent variable?
A dependent variable is the outcome or response being studied in an experiment or investigation. It’s what researchers measure to determine the effect of changes in the independent variable. In a cause-and-effect relationship, the dependent variable is presumed to be influenced or caused by the independent variable.
What is a variable in programming?
In programming, a variable is a symbolic name for a storage location that holds data or values. It allows data storage and retrieval for computational operations. Variables have types, like integer or string, determining the nature of data they can hold. They’re fundamental in manipulating and processing information in software.
What is a control variable?
A control variable in research is a factor that’s kept constant to ensure that it doesn’t influence the outcome. By controlling these variables, researchers can isolate the effects of the independent variable on the dependent variable, ensuring that other factors don’t skew the results or introduce bias into the experiment.
What is a controlled variable in science?
In science, a controlled variable is a factor that remains constant throughout an experiment. It ensures that any observed changes in the dependent variable are solely due to the independent variable, not other factors. By keeping controlled variables consistent, researchers can maintain experiment validity and accurately assess cause-and-effect relationships.
How many independent variables should an investigation have?
Ideally, an investigation should have one independent variable to clearly establish cause-and-effect relationships. Manipulating multiple independent variables simultaneously can complicate data interpretation.
However, in advanced research, experiments with multiple independent variables (factorial designs) are used, but they require careful planning to understand interactions between variables.
You May Also Like
This article provides the key advantages of primary research over secondary research so you can make an informed decision.
The authenticity of dissertation is largely influenced by the research method employed. Here we present the most notable research methods for dissertation.
A meta-analysis is a formal, epidemiological, quantitative study design that uses statistical methods to generalise the findings of the selected independent studies.
USEFUL LINKS
LEARNING RESOURCES

COMPANY DETAILS

- How It Works
Variables: Definition, Examples, Types of Variables in Research

What is a Variable?
Within the context of a research investigation, concepts are generally referred to as variables. A variable is, as the name applies, something that varies.
Examples of Variable
These are all examples of variables because each of these properties varies or differs from one individual to another.
- income and expenses,
- family size,
- country of birth,
- capital expenditure,
- class grades,
- blood pressure readings,
- preoperative anxiety levels,
- eye color, and
- vehicle type.
What is Variable in Research?
A variable is any property, characteristic, number, or quantity that increases or decreases over time or can take on different values (as opposed to constants, such as n , that do not vary) in different situations.
When conducting research, experiments often manipulate variables. For example, an experimenter might compare the effectiveness of four types of fertilizers.
In this case, the variable is the ‘type of fertilizers.’ A social scientist may examine the possible effect of early marriage on divorce. Her early marriage is variable.
A business researcher may find it useful to include the dividend in determining the share prices . Here, the dividend is the variable.
Effectiveness, divorce, and share prices are variables because they also vary due to manipulating fertilizers, early marriage, and dividends.
11 Types of Variables in Research
Qualitative variables.
An important distinction between variables is the qualitative and quantitative variables.
Qualitative variables are those that express a qualitative attribute, such as hair color, religion, race, gender, social status, method of payment, and so on. The values of a qualitative variable do not imply a meaningful numerical ordering.
The value of the variable ‘religion’ (Muslim, Hindu.., etc..) differs qualitatively; no ordering of religion is implied. Qualitative variables are sometimes referred to as categorical variables.
For example, the variable sex has two distinct categories: ‘male’ and ‘female.’ Since the values of this variable are expressed in categories, we refer to this as a categorical variable.
Similarly, the place of residence may be categorized as urban and rural and thus is a categorical variable.
Categorical variables may again be described as nominal and ordinal.
Ordinal variables can be logically ordered or ranked higher or lower than another but do not necessarily establish a numeric difference between each category, such as examination grades (A+, A, B+, etc., and clothing size (Extra large, large, medium, small).
Nominal variables are those that can neither be ranked nor logically ordered, such as religion, sex, etc.
A qualitative variable is a characteristic that is not capable of being measured but can be categorized as possessing or not possessing some characteristics.
Quantitative Variables
Quantitative variables, also called numeric variables, are those variables that are measured in terms of numbers. A simple example of a quantitative variable is a person’s age.
Age can take on different values because a person can be 20 years old, 35 years old, and so on. Likewise, family size is a quantitative variable because a family might be comprised of one, two, or three members, and so on.
Each of these properties or characteristics referred to above varies or differs from one individual to another. Note that these variables are expressed in numbers, for which we call quantitative or sometimes numeric variables.
A quantitative variable is one for which the resulting observations are numeric and thus possess a natural ordering or ranking.
Discrete and Continuous Variables
Quantitative variables are again of two types: discrete and continuous.
Variables such as some children in a household or the number of defective items in a box are discrete variables since the possible scores are discrete on the scale.
For example, a household could have three or five children, but not 4.52 children.
Other variables, such as ‘time required to complete an MCQ test’ and ‘waiting time in a queue in front of a bank counter,’ are continuous variables.
The time required in the above examples is a continuous variable, which could be, for example, 1.65 minutes or 1.6584795214 minutes.
Of course, the practicalities of measurement preclude most measured variables from being continuous.
Discrete Variable
A discrete variable, restricted to certain values, usually (but not necessarily) consists of whole numbers, such as the family size and a number of defective items in a box. They are often the results of enumeration or counting.
A few more examples are;
- The number of accidents in the twelve months.
- The number of mobile cards sold in a store within seven days.
- The number of patients admitted to a hospital over a specified period.
- The number of new branches of a bank opened annually during 2001- 2007.
- The number of weekly visits made by health personnel in the last 12 months.
Continuous Variable
A continuous variable may take on an infinite number of intermediate values along a specified interval. Examples are:
- The sugar level in the human body;
- Blood pressure reading;
- Temperature;
- Height or weight of the human body;
- Rate of bank interest;
- Internal rate of return (IRR),
- Earning ratio (ER);
- Current ratio (CR)
No matter how close two observations might be, if the instrument of measurement is precise enough, a third observation can be found, falling between the first two.
A continuous variable generally results from measurement and can assume countless values in the specified range.
Dependent Variables and Independent Variable
In many research settings, two specific classes of variables need to be distinguished from one another: independent variable and dependent variable.
Many research studies aim to reveal and understand the causes of underlying phenomena or problems with the ultimate goal of establishing a causal relationship between them.
Look at the following statements:
- Low intake of food causes underweight.
- Smoking enhances the risk of lung cancer.
- Level of education influences job satisfaction.
- Advertisement helps in sales promotion.
- The drug causes improvement of health problems.
- Nursing intervention causes more rapid recovery.
- Previous job experiences determine the initial salary.
- Blueberries slow down aging.
- The dividend per share determines share prices.
In each of the above queries, we have two independent and dependent variables. In the first example, ‘low intake of food’ is believed to have caused the ‘problem of being underweight.’
It is thus the so-called independent variable. Underweight is the dependent variable because we believe this ‘problem’ (the problem of being underweight) has been caused by ‘the low intake of food’ (the factor).
Similarly, smoking, dividend, and advertisement are all independent variables, and lung cancer, job satisfaction, and sales are dependent variables.
In general, an independent variable is manipulated by the experimenter or researcher, and its effects on the dependent variable are measured.
Independent Variable
The variable that is used to describe or measure the factor that is assumed to cause or at least to influence the problem or outcome is called an independent variable.
The definition implies that the experimenter uses the independent variable to describe or explain its influence or effect of it on the dependent variable.
Variability in the dependent variable is presumed to depend on variability in the independent variable.
Depending on the context, an independent variable is sometimes called a predictor variable, regressor, controlled variable, manipulated variable, explanatory variable, exposure variable (as used in reliability theory), risk factor (as used in medical statistics), feature (as used in machine learning and pattern recognition) or input variable.
The explanatory variable is preferred by some authors over the independent variable when the quantities treated as independent variables may not be statistically independent or independently manipulable by the researcher.
If the independent variable is referred to as an explanatory variable, then the term response variable is preferred by some authors for the dependent variable.
Dependent Variable
The variable used to describe or measure the problem or outcome under study is called a dependent variable.
In a causal relationship, the cause is the independent variable, and the effect is the dependent variable. If we hypothesize that smoking causes lung cancer, ‘smoking’ is the independent variable and cancer the dependent variable.
A business researcher may find it useful to include the dividend in determining the share prices. Here dividend is the independent variable, while the share price is the dependent variable.
The dependent variable usually is the variable the researcher is interested in understanding, explaining, or predicting.
In lung cancer research, the carcinoma is of real interest to the researcher, not smoking behavior per se. The independent variable is the presumed cause of, antecedent to, or influence on the dependent variable.
Depending on the context, a dependent variable is sometimes called a response variable, regressand, predicted variable, measured variable, explained variable, experimental variable, responding variable, outcome variable, output variable, or label.
An explained variable is preferred by some authors over the dependent variable when the quantities treated as dependent variables may not be statistically dependent.
If the dependent variable is referred to as an explained variable, then the term predictor variable is preferred by some authors for the independent variable.
Levels of an Independent Variable
If an experimenter compares an experimental treatment with a control treatment, then the independent variable (a type of treatment) has two levels: experimental and control.
If an experiment were to compare five types of diets, then the independent variables (types of diet) would have five levels.
In general, the number of levels of an independent variable is the number of experimental conditions.
Background Variable
In almost every study, we collect information such as age, sex, educational attainment, socioeconomic status, marital status, religion, place of birth, and the like. These variables are referred to as background variables.
These variables are often related to many independent variables, so they indirectly influence the problem. Hence they are called background variables.
The background variables should be measured if they are important to the study. However, we should try to keep the number of background variables as few as possible in the interest of the economy.
Moderating Variable
In any statement of relationships of variables, it is normally hypothesized that in some way, the independent variable ’causes’ the dependent variable to occur.
In simple relationships, all other variables are extraneous and are ignored.
In actual study situations, such a simple one-to-one relationship needs to be revised to take other variables into account to explain the relationship better.
This emphasizes the need to consider a second independent variable that is expected to have a significant contributory or contingent effect on the originally stated dependent-independent relationship.
Such a variable is termed a moderating variable.
Suppose you are studying the impact of field-based and classroom-based training on the work performance of health and family planning workers. You consider the type of training as the independent variable.
If you are focusing on the relationship between the age of the trainees and work performance, you might use ‘type of training’ as a moderating variable.
Extraneous Variable
Most studies concern the identification of a single independent variable and measuring its effect on the dependent variable.
But still, several variables might conceivably affect our hypothesized independent-dependent variable relationship, thereby distorting the study. These variables are referred to as extraneous variables.
Extraneous variables are not necessarily part of the study. They exert a confounding effect on the dependent-independent relationship and thus need to be eliminated or controlled for.
An example may illustrate the concept of extraneous variables. Suppose we are interested in examining the relationship between the work status of mothers and breastfeeding duration.
It is not unreasonable in this instance to presume that the level of education of mothers as it influences work status might have an impact on breastfeeding duration too.
Education is treated here as an extraneous variable. In any attempt to eliminate or control the effect of this variable, we may consider this variable a confounding variable.
An appropriate way of dealing with confounding variables is to follow the stratification procedure, which involves a separate analysis of the different levels of lies in confounding variables.
For this purpose, one can construct two crosstables for illiterate mothers and the other for literate mothers.
Suppose we find a similar association between work status and duration of breastfeeding in both the groups of mothers. In that case, we conclude that mothers’ educational level is not a confounding variable.
Intervening Variable
Often an apparent relationship between two variables is caused by a third variable.
For example, variables X and Y may be highly correlated, but only because X causes the third variable, Z, which in turn causes Y. In this case, Z is the intervening variable.
An intervening variable theoretically affects the observed phenomena but cannot be seen, measured, or manipulated directly; its effects can only be inferred from the effects of the independent and moderating variables on the observed phenomena.
We might view motivation or counseling as the intervening variable in the work-status and breastfeeding relationship.
Thus, motive, job satisfaction, responsibility, behavior, and justice are some of the examples of intervening variables.
Suppressor Variable
In many cases, we have good reasons to believe that the variables of interest have a relationship, but our data fail to establish any such relationship. Some hidden factors may suppress the true relationship between the two original variables.
Such a factor is referred to as a suppressor variable because it suppresses the relationship between the other two variables.
The suppressor variable suppresses the relationship by being positively correlated with one of the variables in the relationship and negatively correlated with the other. The true relationship between the two variables will reappear when the suppressor variable is controlled for.
Thus, for example, low age may pull education up but income down. In contrast, a high age may pull income up but education down, effectively canceling the relationship between education and income unless age is controlled for.
4 Relationships Between Variables

In dealing with relationships between variables in research, we observe a variety of dimensions in these relationships.
Positive and Negative Relationship
Symmetrical relationship, causal relationship, linear and non-linear relationship.
Two or more variables may have a positive, negative, or no relationship. In the case of two variables, a positive relationship is one in which both variables vary in the same direction.
However, they are said to have a negative relationship when they vary in opposite directions.
When a change in the other variable does not accompany the change or movement of one variable, we say that the variables in question are unrelated.
For example, if an increase in wage rate accompanies one’s job experience, the relationship between job experience and the wage rate is positive.
If an increase in an individual’s education level decreases his desire for additional children, the relationship is negative or inverse.
If the level of education does not have any bearing on the desire, we say that the variables’ desire for additional children and ‘education’ are unrelated.
Strength of Relationship
Once it has been established that two variables are related, we want to ascertain how strongly they are related.
A common statistic to measure the strength of a relationship is the so-called correlation coefficient symbolized by r. r is a unit-free measure, lying between -1 and +1 inclusive, with zero signifying no linear relationship.
As far as the prediction of one variable from the knowledge of the other variable is concerned, a value of r= +1 means a 100% accuracy in predicting a positive relationship between the two variables, and a value of r = -1 means a 100% accuracy in predicting a negative relationship between the two variables.
So far, we have discussed only symmetrical relationships in which a change in the other variable accompanies a change in either variable.
This relationship does not indicate which variable is the independent variable and which variable is the dependent variable.
In other words, you can label either of the variables as the independent variable.
Such a relationship is a symmetrical relationship. In an asymmetrical relationship, a change in variable X (say) is accompanied by a change in variable Y, but not vice versa.
The amount of rainfall, for example, will increase productivity, but productivity will not affect the rainfall. This is an asymmetrical relationship.
Similarly, the relationship between smoking and lung cancer would be asymmetrical because smoking could cause cancer, but lung cancer could not cause smoking.
Indicating a relationship between two variables does not automatically ensure that changes in one variable cause changes in another.
It is, however, very difficult to establish the existence of causality between variables. While no one can ever be certain that variable A causes variable B , one can gather some evidence that increases our belief that A leads to B.
In an attempt to do so, we seek the following evidence:
- Is there a relationship between A and B? When such evidence exists, it indicates a possible causal link between the variables.
- Is the relationship asymmetrical so that a change in A results in B but not vice-versa? In other words, does A occur before B? If we find that B occurs before A, we can have little confidence that A causes.
- Does a change in A result in a change in B regardless of the actions of other factors? Or, is it possible to eliminate other possible causes of B? Can one determine that C, D, and E (say) do not co-vary with B in a way that suggests possible causal connections?
A linear relationship is a straight-line relationship between two variables, where the variables vary at the same rate regardless of whether the values are low, high, or intermediate.
This is in contrast with the non-linear (or curvilinear) relationships, where the rate at which one variable changes in value may differ for different values of the second variable.
Whether a variable is linearly related to the other variable or not can simply be ascertained by plotting the K values against X values.
If the values, when plotted, appear to lie on a straight line, the existence of a linear relationship between X and Y is suggested.
Height and weight almost always have an approximately linear relationship, while age and fertility rates have a non-linear relationship.
Frequently Asked Questions about Variable
What is a variable within the context of a research investigation.
A variable, within the context of a research investigation, refers to concepts that vary. It can be any property, characteristic, number, or quantity that can increase or decrease over time or take on different values.
How is a variable used in research?
In research, a variable is any property or characteristic that can take on different values. Experiments often manipulate variables to compare outcomes. For instance, an experimenter might compare the effectiveness of different types of fertilizers, where the variable is the ‘type of fertilizers.’
What distinguishes qualitative variables from quantitative variables?
Qualitative variables express a qualitative attribute, such as hair color or religion, and do not imply a meaningful numerical ordering. Quantitative variables, on the other hand, are measured in terms of numbers, like a person’s age or family size.
How do discrete and continuous variables differ in terms of quantitative variables?
Discrete variables are restricted to certain values, often whole numbers, resulting from enumeration or counting, like the number of children in a household. Continuous variables can take on an infinite number of intermediate values along a specified interval, such as the time required to complete a test.
What are the roles of independent and dependent variables in research?
In research, the independent variable is manipulated by the researcher to observe its effects on the dependent variable. The independent variable is the presumed cause or influence, while the dependent variable is the outcome or effect that is being measured.
What is a background variable in a study?
Background variables are information collected in a study, such as age, sex, or educational attainment. These variables are often related to many independent variables and indirectly influence the main problem or outcome, hence they are termed background variables.
How does a suppressor variable affect the relationship between two other variables?
A suppressor variable can suppress or hide the true relationship between two other variables. It does this by being positively correlated with one of the variables and negatively correlated with the other. When the suppressor variable is controlled for, the true relationship between the two original variables can be observed.

- Bipolar Disorder
- Therapy Center
- When To See a Therapist
- Types of Therapy
- Best Online Therapy
- Best Couples Therapy
- Best Family Therapy
- Managing Stress
- Sleep and Dreaming
- Understanding Emotions
- Self-Improvement
- Healthy Relationships
- Student Resources
- Personality Types
- Guided Meditations
- Verywell Mind Insights
- 2024 Verywell Mind 25
- Mental Health in the Classroom
- Editorial Process
- Meet Our Review Board
- Crisis Support
Types of Variables in Psychology Research
Examples of Independent and Dependent Variables
Kendra Cherry, MS, is a psychosocial rehabilitation specialist, psychology educator, and author of the "Everything Psychology Book."
:max_bytes(150000):strip_icc():format(webp)/IMG_9791-89504ab694d54b66bbd72cb84ffb860e.jpg "what are variables of a research study")
James Lacy, MLS, is a fact-checker and researcher.
:max_bytes(150000):strip_icc():format(webp)/James-Lacy-1000-73de2239670146618c03f8b77f02f84e.jpg "what are variables of a research study")
Dependent and Independent Variables
- Intervening Variables
- Extraneous Variables
- Controlled Variables
- Confounding Variables
- Operationalizing Variables
Frequently Asked Questions
Variables in psychology are things that can be changed or altered, such as a characteristic or value. Variables are generally used in psychology experiments to determine if changes to one thing result in changes to another.
Variables in psychology play a critical role in the research process. By systematically changing some variables in an experiment and measuring what happens as a result, researchers are able to learn more about cause-and-effect relationships.
The two main types of variables in psychology are the independent variable and the dependent variable. Both variables are important in the process of collecting data about psychological phenomena.
This article discusses different types of variables that are used in psychology research. It also covers how to operationalize these variables when conducting experiments.
Students often report problems with identifying the independent and dependent variables in an experiment. While this task can become more difficult as the complexity of an experiment increases, in a psychology experiment:
- The independent variable is the variable that is manipulated by the experimenter. An example of an independent variable in psychology: In an experiment on the impact of sleep deprivation on test performance, sleep deprivation would be the independent variable. The experimenters would have some of the study participants be sleep-deprived while others would be fully rested.
- The dependent variable is the variable that is measured by the experimenter. In the previous example, the scores on the test performance measure would be the dependent variable.
So how do you differentiate between the independent and dependent variables? Start by asking yourself what the experimenter is manipulating. The things that change, either naturally or through direct manipulation from the experimenter, are generally the independent variables. What is being measured? The dependent variable is the one that the experimenter is measuring.
Intervening Variables in Psychology
Intervening variables, also sometimes called intermediate or mediator variables, are factors that play a role in the relationship between two other variables. In the previous example, sleep problems in university students are often influenced by factors such as stress. As a result, stress might be an intervening variable that plays a role in how much sleep people get, which may then influence how well they perform on exams.
Extraneous Variables in Psychology
Independent and dependent variables are not the only variables present in many experiments. In some cases, extraneous variables may also play a role. This type of variable is one that may have an impact on the relationship between the independent and dependent variables.
For example, in our previous example of an experiment on the effects of sleep deprivation on test performance, other factors such as age, gender, and academic background may have an impact on the results. In such cases, the experimenter will note the values of these extraneous variables so any impact can be controlled for.
There are two basic types of extraneous variables:
- Participant variables : These extraneous variables are related to the individual characteristics of each study participant that may impact how they respond. These factors can include background differences, mood, anxiety, intelligence, awareness, and other characteristics that are unique to each person.
- Situational variables : These extraneous variables are related to things in the environment that may impact how each participant responds. For example, if a participant is taking a test in a chilly room, the temperature would be considered an extraneous variable. Some participants may not be affected by the cold, but others might be distracted or annoyed by the temperature of the room.
Other extraneous variables include the following:
- Demand characteristics : Clues in the environment that suggest how a participant should behave
- Experimenter effects : When a researcher unintentionally suggests clues for how a participant should behave
Controlled Variables in Psychology
In many cases, extraneous variables are controlled for by the experimenter. A controlled variable is one that is held constant throughout an experiment.
In the case of participant variables, the experiment might select participants that are the same in background and temperament to ensure that these factors don't interfere with the results. Holding these variables constant is important for an experiment because it allows researchers to be sure that all other variables remain the same across all conditions.
Using controlled variables means that when changes occur, the researchers can be sure that these changes are due to the manipulation of the independent variable and not caused by changes in other variables.
It is important to also note that a controlled variable is not the same thing as a control group . The control group in a study is the group of participants who do not receive the treatment or change in the independent variable.
All other variables between the control group and experimental group are held constant (i.e., they are controlled). The dependent variable being measured is then compared between the control group and experimental group to see what changes occurred because of the treatment.
Confounding Variables in Psychology
If a variable cannot be controlled for, it becomes what is known as a confounding variabl e. This type of variable can have an impact on the dependent variable, which can make it difficult to determine if the results are due to the influence of the independent variable, the confounding variable, or an interaction of the two.
Operationalizing Variables in Psychology
An operational definition describes how the variables are measured and defined in the study. Before conducting a psychology experiment , it is essential to create firm operational definitions for both the independent variable and dependent variables.
For example, in our imaginary experiment on the effects of sleep deprivation on test performance, we would need to create very specific operational definitions for our two variables. If our hypothesis is "Students who are sleep deprived will score significantly lower on a test," then we would have a few different concepts to define:
- Students : First, what do we mean by "students?" In our example, let’s define students as participants enrolled in an introductory university-level psychology course.
- Sleep deprivation : Next, we need to operationally define the "sleep deprivation" variable. In our example, let’s say that sleep deprivation refers to those participants who have had less than five hours of sleep the night before the test.
- Test variable : Finally, we need to create an operational definition for the test variable. For this example, the test variable will be defined as a student’s score on a chapter exam in the introductory psychology course.
Once all the variables are operationalized, we're ready to conduct the experiment.
Variables play an important part in psychology research. Manipulating an independent variable and measuring the dependent variable allows researchers to determine if there is a cause-and-effect relationship between them.
A Word From Verywell
Understanding the different types of variables used in psychology research is important if you want to conduct your own psychology experiments. It is also helpful for people who want to better understand what the results of psychology research really mean and become more informed consumers of psychology information .
Independent and dependent variables are used in experimental research. Unlike some other types of research (such as correlational studies ), experiments allow researchers to evaluate cause-and-effect relationships between two variables.
Researchers can use statistical analyses to determine the strength of a relationship between two variables in an experiment. Two of the most common ways to do this are to calculate a p-value or a correlation. The p-value indicates if the results are statistically significant while the correlation can indicate the strength of the relationship.
In an experiment on how sugar affects short-term memory, sugar intake would be the independent variable and scores on a short-term memory task would be the independent variable.
In an experiment looking at how caffeine intake affects test anxiety, the amount of caffeine consumed before a test would be the independent variable and scores on a test anxiety assessment would be the dependent variable.
Just as with other types of research, the independent variable in a cognitive psychology study would be the variable that the researchers manipulate. The specific independent variable would vary depending on the specific study, but it might be focused on some aspect of thinking, memory, attention, language, or decision-making.
American Psychological Association. Operational definition . APA Dictionary of Psychology.
American Psychological Association. Mediator . APA Dictionary of Psychology.
Altun I, Cınar N, Dede C. The contributing factors to poor sleep experiences in according to the university students: A cross-sectional study . J Res Med Sci . 2012;17(6):557-561. PMID:23626634
Skelly AC, Dettori JR, Brodt ED. Assessing bias: The importance of considering confounding . Evid Based Spine Care J . 2012;3(1):9-12. doi:10.1055/s-0031-1298595
- Evans, AN & Rooney, BJ. Methods in Psychological Research. Thousand Oaks, CA: SAGE Publications; 2014.
- Kantowitz, BH, Roediger, HL, & Elmes, DG. Experimental Psychology. Stamfort, CT: Cengage Learning; 2015.
By Kendra Cherry, MSEd Kendra Cherry, MS, is a psychosocial rehabilitation specialist, psychology educator, and author of the "Everything Psychology Book."
The effect of organizational culture, supplier trust and information sharing on supply chain viability
- Published: 17 May 2024
Cite this article

- Mehmet Fatih Acar 1 ,
- Alev Özer Torgalöz 2 ,
- Enes Eryarsoy 3 ,
- Selim Zaim 4 &
- Salomée Ruel ORCID: orcid.org/0000-0002-1688-7422 5
19 Accesses
Explore all metrics
This study investigates the impact of intangible resources such as adhocracy culture (ADC), information sharing with suppliers (IS), and supplier trust (ST) on supply chain viability (SCV) under high inflation environment. To do this, a conceptual model is developed to analyze the associations between these suggested variables. Using on a cross-sectional survey, data are collected from 216 supply chain (SC) and production practitioners based in Türkiye who are medium- to senior-level managers. To analyze our theoretical model, we processed our data and model using lavaan package in R. The results show a significant relationship between ADC and SCV. Additionally, both of IS and ST capabilities are found to have a strong mediating effect on the ADC and SCV relationship. The results of this study will provide insight for managers and researchers to prevent the negative effects of SC disruptions due to the high inflation or other type of stress tests. Extant research has investigated the SCV with different crises like COVID-19 pandemic however, the study is the first research that examines SCV under high inflation stress test. Moreover, ADC, IS and ST have not widely appeared in SCV literature. In this regard, this research also contributes to the ongoing efforts of investigating the antecedents of SCV.
This is a preview of subscription content, log in via an institution to check access.
Access this article
Price includes VAT (Russian Federation)
Instant access to the full article PDF.
Rent this article via DeepDyve
Institutional subscriptions
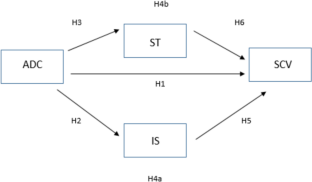
Data availability
Data can be available upon request by email.
Acar MF, Özer Torgalöz A, Eryarsoy E, Zaim S (2022) Did COVID-19 change the rules of the game for supply chain resilience? The effects of learning culture and supplier trust. Int J Phys Distrib Logist Manag 52(7):491–511
Article Google Scholar
Aday S, Aday MS (2020) Impact of COVID-19 on the food supply chain. Food Qual Saf 4(4):167–180
Ali E, Gossaye W (2023) The effects of supply chain viability on supply chain performance and marketing performance in case of large manufacturing firm in Ethiopia. Braz J Oper Prod Manag 20(2):1535–1535
Alzoubi H, Yanamandra R (2020) Investigating the mediating role of information sharing strategy on agile supply chain. Uncertain Supply Chain Manag 8(2):273–284
Andrianu B (2020) Resilient organizational culture: Cluj-Napoca case study. East J Eur Stud 11(1):335–357
Google Scholar
Argyris C, Schön DA (1978) Organizational learning. Addison-Wesley, Reading, MA. https://doi.org/10.5465/amr.1985.4279103
Book Google Scholar
Bagozzi RP, Yi Y (1988) On the evaluation of structural equation model. J Acad Mark Sci 16(1):74–94
Balaji MS, Jiang Y, Singh G, Jha S (2020) Letting go or getting back: how organization culture shapes frontline employee response to customer incivility. J Bus Res 111:1–11
Balezentis T, Zickiene A, Volkov A, Streimikiene D, Morkunas M, Dabkiene V, Ribasauskiene E (2023) Measures for the viable Agri-food supply chains: a multi-criteria approach. J Bus Res 155:113417
Bargshady G, Zahraee SM, Ahmadi M, Parto A (2016) The effect of information technology on the agility of the supply chain in the Iranian power plant industry. J Manuf Technol Manag 27(3):427–442
Baron RM, Kenny AA (1986) The moderator–mediator variable distinction in social psychological research: conceptual, strategic, and statistical considerations. J Pers Soc Psychol 51(6):1173
Bourland K, Stephen P, Pyke D (1996) Exploiting timely demand information to reduce inventories. Eur J Oper Res 92(2):239–253
Boyd NM, Larson S (2023) Organizational cultures that support community: does the competing values framework help us understand experiences of community at work? J Community Psychol 51(4):1695–1715
Braunscheidel MJ, Suresh NC, Boisnier AD (2010) Investigating the impact of organizational culture on supply chain integration. Hum Resour Manag 49(5):883–911
Brusset X, Ivanov D, Jebali A, La Torre D, Repetto M (2023) A dynamic approach to supply chain reconfiguration and ripple effect analysis in an epidemic. Int J Prod Econ 263:108935
Byrne BM (2013) Structural equation modeling with AMOS: basic concepts, applications, and programming, 2nd edn. Routledge Taylor & Francis Group, New York
Cadden T, Marshall D, Cao G (2013) Opposites attract: organisational culture and supply chain performance. Supply Chain Manag 18(1):86–103
Cameron KS, Quinn RE (1999) Diagnosing and changing organisational culture: based on the competing values framework. Addison-Wesley, Reading, MA
Cameron KS, Quinn RE (2011) Diagnosing and changing organizational culture: based on the competing values framework, 3rd edn. Jossey-Bass, San Francisco, CA
Cao M, Zhang Q (2011) Supply chain collaboration: impact on collaborative advantage and firm performance. J Oper Manag 29(3):163–180
Cavaliere V, Lombardi S (2015) Exploring different cultural configurations: how do they affect subsidiaries’ knowledge sharing behaviors? J Knowl Manag 19(2):141–163
Chandra C, Grabis J (2009) Configurable supply chain: framework, methodology and application. Int J Manuf Technol Manag 17(1–2):5–22
Chang V, Xu QA, Hall K, Wang YA, Kamal MM (2023) Digitalization in omnichannel healthcare supply chain businesses: the role of smart wearable devices. J Bus Res 156:113369
Chatterjee S, Hadi AS (2012) Regression analysis by example (5th ed.). Hoboken, NJ: John Wiley & Sons
Chege SW, Gichunge E, Muema W (2022) Analysis of adhocracy culture implementation approach and performance of universities in Kenya. J Strateg Manag 2(3):1–10
Chen F (2003) Information sharing and supply chain coordination. Handbooks Oper Res Manag Sci 11:341–421
Chowdhury P, Paul SK, Kaisar S, Moktadir MA (2021) COVID-19 pandemic related supply chain studies: a systematic review. Transp Res E Logist Transp Rev 148:102271
Ciccullo F, Pero M, Caridi M, Gosling J, Purvis L (2018) Integrating the environmental and social sustainability pillars into the lean and agile supply chain management paradigms: a literature review and future research directions. J Clean Prod 172:2336–2350
Coote LV, Forrest EJ, Tam TW (2003) An investigation into commitment in non-western industrial marketing relationships. Ind Mark Manag 32(7):595–604
Dani SS, Burns ND, Backhouse CJ, Kochhar AK (2006) The implications of organizational culture and trust in the working of virtual teams. Proc Inst Mech Eng B J Eng Manuf 220(6):951–960
Denison DR, Spreitzer GM (1991) Organizational culture and organizational development: a competing values approach. Res Organ Chang Dev 5(1):1–21
Dubey R, Gunasekaran A, Childe SJ, Fosso Wamba S, Roubaud D, Foropon C (2021) Empirical investigation of data analytics capability and organizational flexibility as complements to supply chain resilience. Int J Prod Res 59(1):110–128
Eryarsoy E, Torgalöz AÖ, Acar MF, Zaim S (2022) A resource-based perspective of the ınterplay between organizational learning and supply chain resilience. Int J Phys Distrib Logist Manag 52(8):614–637
Faruquee M, Paulraj A, Irawan CA (2021) Strategic supplier relationships and supply chain resilience: is digital transformation that precludes trust beneficial? Int J Oper Prod Manag 41(7):1192–1219
Fayezi S, Zutshi A, OLoughlin A (2016) Understanding and development of supply chain agility and flexibility: a structured literature review. Int J Manag Rev 19:1–30
Fornell C, Larcker DF (1981) Evaluating structural equation models with unobservable variables and measurement error. J Mark Res 18(1):39–50
Franke G, Sarstedt M (2019) Heuristics versus statistics in discriminant validity testing: a comparison of four procedures. Internet Res 29(3):430–447
Gaál Z, Szabó L, Obermayer-Kovács N, Kovács Z, Csepregi A (2010) Clan, adhocracy, market or hierarchy? Which is the best for knowledge sharing in Hungary. In Proceedings of the 2nd European Conference on Intellectual Capital (1: 249–251)
Galbraith JR (2014) Organizational design challenges resulting from big data. J Organ Des 3(1):2–13
Gezgin E, Huang X, Samal P, Silva I (2017) https://www.mckinsey.com/capabilities/operations/our-insights/digital-transformation-raising-supply-chain-performance-to-new-levels
Grover V, Tseng SL, Pu W (2022) A theoretical perspective on organizational culture and digitalization. Inf Manag 59(4):103639
Gupta B (2011) A comparative study of organizational strategy and culture across industry. Benchmarking 18(4):510–528
Ha BC, Park YK, Cho S (2011) Suppliers’ affective trust and trust in competency in buyers: its effect on collaboration and logistics efficiency. Int J Oper Prod Manag 31(1):56–77
Hair JF, Black WC, Babin BJ, Anderson RE (2010) Multivariate data analysis, 7th edn. Pearson Prentice Hall, New York
Hartnell CA, Ou AY, Kinicki A (2011) Organizational culture and organizational effectiveness: a meta-analytic investigation of the competing values framework’s theoretical suppositions. J Appl Psychol 96(4):677
Herbe A, Estermann Z, Holzwarth V, vom Brocke J (2024) How to effectively use distributed ledger technology in supply chain management? Int J Prod Res 62(7):2522–2547
Hill S, Martin R, Harris M (2000) Decentralization, integration and the post-bureaucratic organization: the case of R&D. J Manag Stud 37(4):563–586
Hippold S (2021) Gartner predicts the future of supply chain technology. Gartner, Inc., USA
Hofmann E, Langner D (2020) The rise of supply chain viability digital solutions as a boosting role. https://www.researchgate.net/profile/Erik-Hofmann/publication/348003760_The_Rise_of_Supply_Chain_Viability_Digital_Solutions_as_a_Boosting_Role/links/5feca3be92851c13fed7b89a/The-Rise-of-Supply-Chain-Viability-Digital-Solutions-as-a-Boosting-Role.pdf
Hou Y, Wang X, Wu YJ, He P (2018) How does the trust affect the topology of supply chain network and its resilience? An agent-based approach. Transp Res E Logist Transp Rev 116:229–241
Hulland J, Baumgartner H, Smith KM (2018) Marketing survey research best practices: evidence and recommendations from a review of JAMS articles. J Acad Mark Sci 46:92–108
Hult T, Ketchen D, Cavusgil T, Calantone R (2006) Knowledge as a strategic resource in supply chains. J Oper Manag 24:458–475
IMF (2022) https://www.imf.org/external/pubs/ft/ar/((2022))/in-focus/covid-19/ . Accessed 23 Jul 2023
IMF (2023) https://www.imf.org/en/Publications/WEO/Issues/(2023)/04/11/world-economic-outlook-april-(2023) . Accessed 23 Jul 2023
ISCM (2023) https://iscm.unisg.ch/en/forschung/aktuelle-forschungsprojekte/supply-chain-viability-studie
Ivanov D (2018) Revealing interfaces of supply chain resilience and sustainability: a simulation study. Int J Prod Res 56(10):3507–3523
Ivanov D (2020) Predicting the impacts of epidemic outbreaks on global supply chains: a simulation-based analysis on the coronavirus outbreak (COVID-19/SARS-CoV-2) case. Transp Res E Logist Transp Rev 136:101922
Ivanov D (2021) Lean resilience: AURA (active usage of resilience assets) framework for post-COVID-19 supply chain management. Int J Logist Manag 33(4):1196–1217
Ivanov D (2022) Viable supply chain model: integrating agility, resilience and sustainability perspectives—lessons from and thinking beyond the COVID-19 pandemic. Ann Oper Res 319(1):1411–1431
Ivanov D, Das A (2020) Coronavirus (COVID-19/SARS-CoV-2) and supply chain resilience: a research note. Int J Integr Supply Manag 13(1):90–102
Ivanov D, Dolgui A (2020) Viability of intertwined supply networks: extending the supply chain resilience angles towards survivability. A position paper motivated by COVID-19 outbreak. Int J Prod Res 58(10):2904–2915
Ivanov D, Dolgui A (2021) OR-methods for coping with the ripple effect in supply chains during Covid-19 pandemic: managerial insights and research implications. Int J Prod Econ 232:107921
Ivanov D, Dolgui A, Blackhurst JV, Choi TM (2023) Toward supply chain viability theory: from lessons learned through COVID-19 pandemic to viable ecosystems. Int J Prod Res 61(8):2402–2415
Ivanov D, Keskin BB (2023) Post-pandemic adaptation and development of supply chain viability theory. Omega 116:102806
Ivanov D, Sokolov B (2013) Control and system-theoretic identification of the supply chain dynamics domain for planning, analysis and adaptation of performance under uncertainty. Eur J Oper Res 224(2):313–323
Jajja MSS, Asif M, Montabon F, Chatha KA (2019) Buyer-supplier relationships and organizational values in supplier social compliance. J Clean Prod 214:331–344
Kim Y, Chen YS, Linderman K (2015) Supply network disruption and resilience: a network structural perspective. J Oper Manag 33-34(1):43–59
Koçoğlu İ, İmamoğlu SZ, İnce H, Keskin H (2011) The effect of supply chain integration on information sharing: enhancing the supply chain performance. Procedia Soc Behav Sci 24:1630–1649
Kumar D, Soni G, Joshi R, Jain V, Sohal A (2022) Modelling supply chain viability during COVID-19 disruption: a case of an Indian automobile manufacturing supply chain. Oper Manag Res 15(3–4):1224–1240
Lee HL, Whang S (2000) Information sharing in a supply chain. Int J Manuf Technol Manag 1(1):79–93
Linnenluecke MK, Griffiths A (2010) Corporate sustainability and organizational culture. J World Bus 45(4):357–366
Liu KP, Chiu W (2021) Supply Chain 4.0: the impact of supply chain digitalization and integration on firm performance. Asian J Bus Ethics 10(2):371–389
Liu H, Han Y, Zhu A (2022) Modeling supply chain viability and adaptation against underload cascading failure during the COVID-19 pandemic. Nonlinear Dyn 110(3):2931–2947
Lotfi R, Weber GW (2022) An introduction to the special issue ‘recent advances on supply chain network design’. Found Comput Dec Sci 47(4):323–326
Lu G, Ding XD, Peng DX, Chuang HHC (2018) Addressing endogeneity in operations management research: recent developments, common problems, and directions for future research. J Oper Manag 64:53–64
Malhotra NK, Kim SS, Patil A (2006) Common method variance in IS research: a comparison of alternative approaches and a reanalysis of past research. Manag Sci 52(12):1865–1883
Mandal S (2017) The influence of organizational culture on healthcare supply chain resilience: moderating role of technology orientation. J Bus Ind Mark 32(8):1021–1037
McDermott CM, Stock GN (1999) Organizational culture and advanced manufacturing technology implementation. J Oper Manag 17(5):521–533
Mikušová M, Klabusayová N, Meier V (2023) Evaluation of organisational culture dimensions and their change due to the pandemic. Eval Program Plan 97:102246
Min S, Mentzer JT (2004) Developing and measuring supply chain management concepts. J Bus Logist 25(1):63–99
Mintzberg H (1979) The structuring of organizations: a synthesis of the research. Prentice-Hall, Inc., Englewood Cliffs, NJ
Mintzberg H (1989) Mintzberg on management: inside our strange world of organizations. Simon and Schuster
Misbauddin SM, Alam MJ, Karmaker CL, Nabi MNU, Hasan MM (2023) Exploring the antecedents of supply chain viability in a pandemic context: an empirical study on the commercial flower supply chain of an emerging economy. Sustainability 15(3):2146
Misigo GK, Were S, Odhiambo R (2019) Influence of adhocracy culture on performance of public water companies in Kenya. Int Acad J Human Resour Bus Adm 3(5):84–103
Mustafid KSA, Jie F (2018) Supply chain agility information systems with key factors for fashion industry competitiveness. Int J Intell Syst Manag 11(1):1–22
Nasir SB, Ahmed T, Karmaker CL, Ali SM, Paul SK, Majumdar A (2022) Supply chain viability in the context of COVID-19 pandemic in small and medium-sized enterprises: implications for sustainable development goals. J Enterp Inf Manag 35(1):100–124
Ng KYN (2023) Effects of organizational culture, affective commitment and trust on knowledge-sharing tendency. J Knowl Manag 27(4):1140–1164
Noone BM, Lin MS, Sharma A (2024) Firm performance during a crisis: effects of adhocracy culture, incremental product innovation, and firm size. J Hosp Tour Res 48(1):153–183
Norman S, Luthans B, Luthans K (2005) The proposed contagion effect of hopeful leaders on the resiliency of employees and organizations. J Leadersh Org Stud 12(2):55–64
OECD (2023) Türkiye Economic Snapshot. Access: https://www.oecd.org/economy/turkiye-economic-snapshot/
Ogbonna E, Harris LC (2000) Leadership style, organizational culture and performance: empirical evidence from UK companies. Int J Hum Resour Manag 11(4):766–788
Owusu D (2019) Effect of corporate culture on organizational performance of star-rated hotels in Ghana. Afr J Hosp Tour Manag 1(2):81–97
Penrose R (1959) The apparent shape of a relativistically moving sphere. Math Proc Camb Philos Soc 55(1):137–139 Cambridge University Press
Pereira V, Mohiya M (2021) Share or hide? Investigating positive and negative employee intentions and organizational support in the context of knowledge sharing and hiding. J Bus Res 129:368–381
Podsakoff PM, Organ DW (1986) Self-reports in organizational research: problems and prospects. J Manag 12(4):531–544
Porter M (2019) Supply chain integration: does organizational culture matter? Int J Supply Chain Manag 12(1):49–59
Puddu M (2023) https://www.consizos.com/strategy/adhocracy-culture/#implementation
Quinn RE, Rohrbaugh J (1983) A spatial model of effectiveness criteria: towards a competing values approach to organizational analysis. Manag Sci 29(3):363–377
Ramakrishna Y (2016) Supply chain management: large vs. small and medium enterprises (SMEs). In: Innovative solutions for implementing global supply chains in emerging markets. IGI Global, pp 141–151
Chapter Google Scholar
Rostami O, Tavakoli M, Tajally A, Ghanavati Nejad M (2023) A goal programming-based fuzzy best–worst method for the viable supplier selection problem: a case study. Soft Comput 27(6):2827–2852
Ruel S, El Baz J (2023) Disaster readiness’ ınfluence on the ımpact of supply chain resilience and robustness on firms’ financial performance: a COVID-19 empirical ınvestigation. Int J Prod Res 61(8):2594–2612
Ruel S, El Baz J, Ivanov D et al (2024) Supply chain viability: conceptualization, measurement, and nomological validation. Ann Oper Res 335:1107–1136
Sabahi S, Parast MM (2020) Firm innovation and supply chain resilience: a dynamic capability perspective. Int J Log Res Appl 23(3):254–269
Sakikawa T (2022) Organizational resilience and organizational culture. J Strat Manag Stud 13(2):89–101
Sambasivan M, Nget Yen C (2010) Strategic alliances in a manufacturing supply chain: influence of organizational culture from the manufacturer's perspective. Int J Phys Distrib Logist Manag 40(6):456–474
Sardesai S, Klingebiel K (2023) Maintaining viability by rapid supply chain adaptation using a process capability index. Omega 115:102778
Sawik T (2023) A stochastic optimisation approach to maintain supply chain viability under the ripple effect. Int J Prod Res 61(8):2452–2469
Schleimer SC, Pedersen T (2013) The driving forces of subsidiary absorptive capacity. J Manag Stud 50(4):646–672
Schumacker E, Lomax G (2016) A Beginner’s Guide to Structural Equation Modelling (4th edtn)
Sezen B (2008) Relative effects of design, integration and information sharing on supply chain performance. Supply Chain Manag 13(3):233–240
Sharma A, Adhikary A, Borah S (2020) Covid-19′s impact on supply chain decisions: strategic insights from NASDAQ 100 firms using twitter data. J Bus Res 117:443–449
Sharma M, Luthra S, Joshi S, Kumar A (2022) Developing a framework for enhancing survivability of sustainable supply chains during and post-COVID-19 pandemic. Int J Log Res Appl 25(4–5):433–453
Shi X, Liao Z (2013) Managing supply chain relationships in the hospitality services: an empirical study of hotels and restaurants. Int J Hosp Manag 35:112–121
Simchi-Levi D, Simchi-Levi E (2020) We need a stress test for critical supply chains. Harv Bus Rev, 28 April. https://hbr.org/(2020)/04/we-need-a-stress-test-for-critical-supply-chains
Sombultawee K, Lenuwat P, Aleenajitpong N, Boon-itt S (2022) COVID-19 and supply chain management: a review with bibliometric. Sustainability 14(6):3538
Tan WJ, Cai W, Zhang AN (2020) Structural-aware simulation analysis of supply chain resilience. Int J Prod Res 58(17):5175–5195
Templeton GF (2011) A two-step approach for transforming continuous variables to normal: implications and recommendations for IS research. Commun Assoc Inf Syst 28(1):41–58
Torgaloz AO, Acar MF, Kuzey C (2023) The effects of organizational learning culture and decentralization upon supply chain collaboration: analysis of Covid-19 period. Oper Manag Res 16(1):511–530
Umar M, Wilson M, Heyl J (2021) The structure of knowledge management in inter-organisational exchanges for resilient supply chains. J Knowl Manag 25(4):826–846
UN (2023) https://www.un.org/en/desa/fragile-economic-recovery-covid-19-pandemic-upended-war-ukraine
Venkatraman N (1989) Strategic orientation of business enterprises: the construct, dimensionality, and measurement. Manag Sci 35(8):942–962
Vitasek K, Manrodt K, Ledlow G (2022) 3 ways to build trust with your suppliers. Harvard Business Review November 04
Wernerfelt B (1984) A resource-based view of the firm. Strateg Manag J 5(2):171–180
Whiteside J, Dani S (2020) Influence of organisational culture on supply chain resilience: a power and situational strength conceptual perspective. J Risk Financial Manag 13(7):147
Woikicki K (2019) Flexibility and adaptability of the system of study: underrated aspects of quality in higher education. In: Wnuk-Lipifiska E, Wojcicka M (eds) Quality review in higher education. TEPICS Publ. House, Warsaw, pp 223–250
Yin W, Ran W (2021) Theoretical exploration of supply chain viability utilizing blockchain technology. Sustainability 13(15):8231
Yu W, Chavez R, Liu Q, Cadden T (2023) Examining the effects of digital supply chain practices on supply chain viability and operational performance: a practice-based view. IEEE Trans Eng Manag. https://doi.org/10.1109/TEM.2023.3294670
Zahari MK, Zakuan N, Yusoff ME, Mat Saman MZ, Ali Khan MNA, Muharam FM, Yaacob TZ (2023) Viable supply chain management toward company sustainability during Covid-19 pandemic in Malaysia. Sustainability 15(5):3989
Zaim H (2005) Bilginin artan önemi ve bilgi yönetimi. İşaret Yayınları, İstanbul
Zammuto RF, Krakower JY (1991) Quantitative and qualitative studies of organizational culture. In: Woodman RW, Pasmore WA (eds) Research in organizational change and development, 5 (83): 114. JAI Press, Greenwich, CT
Zammuto RF, O'Connor EJ (1992) Gaining advanced manufacturing technologies' benefits: the roles of organization design and culture. Acad Manag Rev 17(4):701–728
Zekhnini K, Cherrafi A, Bouhaddou I, Benabdellah AC (2021) Suppliers selection ontology for viable digital supply chain performance. In Advances in production management systems. Artificial intelligence for sustainable and resilient production systems: IFIP WG 5.7 International Conference, APMS (2021) Nantes, France, September 5–9, (2021), Proceedings, Part IV (pp. 622–631). Springer International Publishing
Zhao N, Hong J, Lau KH (2023) Impact of supply chain digitalization on supply chain resilience and performance: a multi-mediation model. Int J Prod Econ 259:108817
Zhou H, Benton WC Jr (2007) Supply chain practice and information sharing. J Oper Manag 25(6):1348–1365
Zhu A, Han Y, Liu H (2024) Effects of adaptive cooperation among heterogeneous manufacturers on supply chain viability under fluctuating demand in post-COVID-19 era: an agent-based simulation. Int J Prod Res 62(4):1162–1188
Download references
Author information
Authors and affiliations.
Department of International Trade and Business, İzmir Katip Çelebi University, Balatçık, Havaalanı Şosesi Cd. No:33/2, 35620, Atatürk Osb, Çiğli, İzmir, Türkiye
Mehmet Fatih Acar
Department of Business Administration, İzmir University of Economics, Fevzi Çakmak, Sakarya Cd. No:156, 35330, Balçova, İzmir, Türkiye
Alev Özer Torgalöz
Department of Management, Sabanci Business School, Sabancı University Orta Mahalle, Tuzla, 34956, İstanbul, Türkiye
Enes Eryarsoy
Department of Management, School of Business, Ibn Haldun University, Başak Mahalle, Başakşehir, 34480, İstanbul, Türkiye
SPP Department - CERIIM Research Centre, Excelia Business School, 102 Rue de Courcelles, 17024, La Rochelle, France
Salomée Ruel
You can also search for this author in PubMed Google Scholar
Corresponding author
Correspondence to Salomée Ruel .
Ethics declarations
Competing interests.
The authors report there are no competing interests to declare.
Additional information
Publisher’s note.
Springer Nature remains neutral with regard to jurisdictional claims in published maps and institutional affiliations.
Appendix 1 Measurement of constructs*
- *Seven-point Likert, ranging from 1 (strongly disagree) to 7 (strongly agree) for SCV, ADC and SCD, five-point Likert, ranging from 1 (strongly disagree) to 5 (strongly agree) for ST and IS
Rights and permissions
Springer Nature or its licensor (e.g. a society or other partner) holds exclusive rights to this article under a publishing agreement with the author(s) or other rightsholder(s); author self-archiving of the accepted manuscript version of this article is solely governed by the terms of such publishing agreement and applicable law.
Reprints and permissions
About this article
Acar, M.F., Torgalöz, A.Ö., Eryarsoy, E. et al. The effect of organizational culture, supplier trust and information sharing on supply chain viability. Oper Manag Res (2024). https://doi.org/10.1007/s12063-024-00491-3
Download citation
Received : 25 September 2023
Revised : 05 March 2024
Accepted : 23 April 2024
Published : 17 May 2024
DOI : https://doi.org/10.1007/s12063-024-00491-3
Share this article
Anyone you share the following link with will be able to read this content:
Sorry, a shareable link is not currently available for this article.
Provided by the Springer Nature SharedIt content-sharing initiative
- Supply chain viability
- Adhocracy culture
- Information sharing
- Supplier trust
- Find a journal
- Publish with us
- Track your research
- Open access
- Published: 16 May 2024
Magnitude of intestinal parasitic infections and its determinants among HIV/AIDS patients attending at antiretroviral treatment centers in East and West Gojam Zones, Northwest, Ethiopia: institution based cross-sectional study
- Mengistu Endalamaw 1 ,
- Abel Alemneh 1 ,
- Gashaw Azanaw Amare 1 ,
- Abebe Fenta 1 &
- Habtamu Belew 1
AIDS Research and Therapy volume 21 , Article number: 32 ( 2024 ) Cite this article
51 Accesses
1 Altmetric
Metrics details
Intestinal parasitic infections (IP) are a major source of morbidity in people living with Human immunodeficiency virus (HIV), particularly in resource-limited settings, mostly as a result of high viral load. Hence, this study aimed to investigate the magnitude of intestinal parasitic infections and its determinants among patients with HIV/AIDS attending public health facilities in East and West Gojam Zones in Ethiopia.
Institution-based cross-sectional study was conducted on 327 people living with HIV visiting public health facilities from December 2022 to May 2023. A simple random sampling technique was used to recruit participants. Face-to-face interviews were used to collect socio-demographics and determinants. The fresh stool was collected from each patient, transported, and tested in accordance with laboratory standard operating procedures of wet mount, formol-ether concentration technique, and modified acid-fast staining. Data were entered and analyzed in the statistical package for Social Science (SPSS) version 20. A 95% CI with p-value < 0.05 was considered statistically significant.
The overall prevalence of IP in patients with HIV/AIDS was 19.3% (63/327). Hookworm was the most identified parasite 33.3% (21/63) followed by E.histolytica 17% (11/63) and G. lamblia 14.3% (9/63). Parasitic infections were significantly higher among viral load > 1000cps/ml ( p = 0.035), WHO stage 4 ( p = 0.002), CD4 < 200 cell/mm 3 ( p = 0.001), and bare foot walking ( p = 0.001).
IP infections are moderately high among patients with HIV/AIDS in the study area. The proportion of parasites was greatly affected by high viral load, WHO stage 4, CD4 < 200 cell/mm 3 , and being barefoot; this gives valuable insight to health professionals, health planners and community health workers. As a result, viral load monitoring, and WHO stage controlling were periodically assessed in patients with HIV/AIDS. Health education, awareness creation, routine stool examination, and environmental hygiene were regularly advocated to increase the life of patients with HIV/AIDS.
Introduction
Human immune deficiency virus HIV) is the most fatal virus causing the disease called acquired immunodeficiency syndrome (AIDS), this disease is known to depress the immune system of the infected individual, which favors other infectious organisms to cause disease including IP infections ( 1 ). Parasitic infections are the frequent cause of morbidity and mortality associated with AIDS patients by causing diarrhea, Cryptosporidium parvum and Isospora belli are the most common opportunistic infectious parasites ( 2 ). In Ethiopia, HIV/AIDS remains a significant public health concern, with a high prevalence and substantial impact on the population ( 3 ). In Ethiopia, the total number of people with HIV/AIDS is 617,921, comprising 235,550 males and 382,371 females across all age groups, with 40, 528 children ( 4 ). Despite progress in the prevention and treatment of HIV/AIDS, co-infections with intestinal parasites continue to pose a significant public burden on affected individuals ( 5 ). Ongoing replication of HIV leads to a constant state of immune activation that persists during the chronic phase. This immune activation is characterized by heightened activity of immune cells and the release of proinflammatory cytokines. It occurs due to the effects of various HIV gene products as well as the immune response triggered by continuous HIV replication. Furthermore, the depletion of mucosal CD4 + T cells in the early stage of the disease disrupts the immune surveillance system of the intestinal barrier, contributing to immune activation ( 6 , 7 ). Intestinal parasite infections have been shown to exacerbate the immunosuppression associated with HIV/AIDS, resulting in increasing susceptibility of opportunistic infections leading to decreased life expectancy rates among people living with HIV/ADIS ( 8 ).
The burden of IP among HIV patients in Africa was found to be more prevalent from 20.9% to 65.3% ( 9 , 10 , 11 , 12 , 13 ), and in Ethiopia, the magnitude of IP in people with HIV from 2011 to 2020 was 39.15% ( 14 ). The East and West Gojam Zones, located in the Northwest region of Ethiopia, are known for the high prevalence of HIV/AIDS ( 15 ). However, limited research has been conducted to assess the magnitude of intestinal parasite infections among patients with HIV in East and West Gojam Zones. Understanding the prevalence and associated factors of intestinal parasite infections in this vulnerable population is crucial for developing targeted interventions and improving the overall health outcomes of patients with HIV ( 5 ).
This research aims to determine the magnitude of intestinal parasite infections and their associated factors among patients with HIV attending antiretroviral therapy in the East and West Gojam Zones of Northwest Ethiopia. By assessing the prevalence of intestinal parasite infections and identifying the factors contributing to their occurrence, this study seeks to provide valuable insights for policymakers, healthcare providers, and researchers working toward the control and prevention of these infections.
Study area and study design
A cross-sectional study was conducted from December 2022 to May 2023 at selected public health institutions from East and West Gojam zones in North-western Ethiopia. Debre Markos Comprehensive Specialized Hospital (DMCSH) provides service for 1340, Yejube Primary Hospital (YPH) 385 and Lumamie Primary Hospital (LPH) 221 from the East Gojam zone, and Finote Selam General Hospital (FSGH) 620 from the West Gojam.
Study population
All HIV-positive patients who attended ART clinics at selected public health facilities.
Exclusion criteria
People living with HIV/AIDS who had a mental illness, because they were unable to provide consent and patients who received anti-parasitic drugs within two weeks were excluded.
Sample size determination
The sample size was determined by using the single population proportion formula, with the formula n = (Z a/2 ) 2 *P (1-P)/d 2 , where n is the minimum required sample size, P is the prevalence of intestinal parasite among HIV patients from a previous study ( p = 24.2%) ( 16 ), d is the marginal error between the sample and the population ( d = 0.05), and Z is the critical value at 95% certainty (1.96). Then n = (1.96) 2 (0.242) (0.799)/(0.05) 2 = 297.
The final sample size, including a 10% non-responding rate, was 327.
Sampling technique and sampling procedure
A simple random sampling with a computer-generated technique was used to select study participants in each selected health institution and proportionally allocated in each facility. From DMCSH ( n = 171), FSGH ( n = 79), LPH ( n = 49), and YPH ( n = 28) were collected.
Data collection, processing, and analysis
Data collection.
Socio-demographic and clinical data were collected through a face-to-face interviewer-administered structured questionnaire.
Stool sample collection
A fresh stool sample was collected with clean and wide-mouthed plastic containers and was preserved by formalin for the direct wet mount, formal-ether concentration, and modified acid-fast staining, if not processed immediately.
Stool sample direct microscopy
A fresh stool sample was collected in labeled cups from all study participants and a direct saline wet mount of each sample was done at the laboratory for motile trophozoite, ova, cyst, and larval stages of intestinal parasites. The wet mounts were examined under the light microscope at 10X and 40X objectives.
Formol-Ether concentration technique
The formol-ether sedimentation technique was performed from fresh and preserved stool samples as follows. A suspension of stool was made from a gram of stool sample with 7 ml of formalin in a 15 ml conical centrifuge tube and filtered through the sieve, then 3 ml of diethyl ether was added into and centrifuged at 3200 rpm for 3 min. After that, the smear was made from the sediment for microscopic examination under 10 × and 40 × objectives.
Modified Ziehl Neelson method
A small portion of the fresh stool sample was processed for the detection of opportunistic parasites using the modified Ziehl-Neelson method. A thin smear was prepared directly from the sediment of concentrated stool and allowed to air dry. Then the slide was fixed with methanol for 5 min and it was stained with 1% carbol-fuchsine for 30 min. After washing the slide in tap water, the slide was decolorized with 1% acid alcohol for 2 min and stained in 0.5% methylene blue for 1 min. The slide was then washed in tap water and observed under a light microscope with a magnification of 1000X.
Data analysis
Data was entered and analyzed by using the SPSS version 20 software package. Univariate and multivariate logistic regression were used to assess the associations of independent variables and dependent variables. All variables with p-values less than 0.25 in the Univariate analysis were candidates for multivariable logistic regression analysis to resolve the confounding effects. The association between independent variables and dependent variables was considered to be statistically significant only if the P value was less than < 0.05 at a 95% confidence level.
Socio-demographic characteristics of the study population
A total of 327 individuals living with HIV/AIDS were enrolled in the study. Most of the participants, 52% ( n = 170) were urban residents. The majority (54.2%) of the study participant’s age group was from 21 to 40 years and 63% were married. Regarding the educational status of the study participants, 38.2% were illiterate and 31.8% had high school (Table 1 ).
Prevalence and distribution of intestinal parasites
The overall prevalence of IP among people living with HIV/AIDS was 19.3% ( n = 63). Of which 33.3% ( n = 21) were Hookworm , which was the highest prevalent followed by 17% ( n = 11) E. histolytica . Distribution of helminthic parasites 58.7% ( n = 37) were more prevalent than protozoan parasites 41.3% ( n = 26) (Fig. 1 ).

Intesting parasite distribution among people living with HIV/AIDS in West and East Gojam, Ethiopia, 2023
Association of intestinal parasites with socio-demographic and other risk factors
Out of the total 63 IP-positive participants, 69.8% ( n = 44) were female, and 30.2% ( n = 19) were male. The majority, 28.6% of infected individuals were aged 31–40, and individuals aged 51–60 had less probability of being infected with IP (6.3%), regarding the marriage status the majority of infected participants 71.4% ( n = 45) were married. Of patients with HIV diagnosed with IP infection, 58.7% (n = 37) had latrines, and 45.9% (n = 17) of participants used them always, whereas 35.2% (n = 13) didn’t use them at all. Of co-infected 98.4% had regular hand-washing habits before meals (Table 2 ).
Multivariate analysis was done to determine the further association of the potential confounding factors such as sex, age, educational status, marital status, income, presence of latrine, viral load, and World Health Organization (WHO) stage with intestinal parasitosis. As a result, viral load level, WHO stage 4 of HIV/AIDS (the severely symptomatic stage) ( 17 ), and availability of latrine showed significant association. People living with HIV who had viral load count 20–1000 cps/ml were more likely to develop a parasitic infection than those having a viral load count results of target not detected (TND) (AOR = 2.37, 95% CI 1.92, 20.1) and those who did not have latrine were 1.2 times more likely acquire intestinal parasite infection than those who had latrine (AOR = 1.21, 95% CI 1.1, 3.4). Patients who had WHO stage 4 of HIV/AIDS were more likely infected with parasitic infection than those who had stage 1. (AOR = 3.83, 95% CI 1.23, 11.54) (Table 2 ).
The present study investigated the socio-demographic characteristics and prevalence of IPs among individuals living with HIV/AIDS in East and West Gojam Zones, Amhara region, Ethiopia. The findings of this study provide important insights into the factors associated with IP infections in this specific geographic area.
The socio-demographic characteristics of the study population revealed that most participants were urban residents (52%), aged between 21 and 40 (54.2%), and 38.2% couldn’t read and write, while 31.8% had completed high school. This finding is consistent with previous reports in different parts of Ethiopia. The higher rates of HIV/AIDS in urban areas due to factors such as increased mobility, higher population density, and greater access to healthcare services, and the global HIV/AIDS epidemiology reported that young adults are often at higher risk of HIV infection due to behavioral factors, including engaging in risky sexual behaviors and substance abuse. Low educational attainment is often associated with limited health literacy, which can hinder individuals' ability to understand and adopt preventive measures against parasitic infections ( 18 , 19 , 20 , 21 , 22 , 23 ).
The overall prevalence of IPs among people living with HIV/AIDS attending the study areas was 19.3%. This finding is consistent with some previous studies conducted in Amhara region, Ethiopia, which have reported a high burden of IP infections among HIV-positive individuals ( 19 , 24 ). However, our finding was much lower than the expected prevalence obtained from the systematic review and meta-analysis research in Ethiopia (39.15%) ( 14 ). This might be due to in the study area people living with HIV/AIDS have a strong adherence to ART drugs, counseling, improved knowledge through health education, and good sanitation practices. The prevalence of specific parasites in this study revealed that hookworms were the most prevalent (33.3%), followed by E. histolytica (17%). These findings are consistent with the literature, as hookworm infection is known to be highly prevalent in Ethiopia, particularly in rural areas with poor sanitation and hygiene practices ( 25 ).
The association analysis between intestinal parasitosis and socio-demographic and other risk factors revealed several important findings. Female participants had a higher likelihood of being infected with intestinal parasites compared to males. This finding is consistent with previous studies in Ethiopia, which have reported a higher prevalence of intestinal parasites among females living with HIV/AIDS ( 26 ). This might be due to biological factors like immunosuppression and gastrointestinal changes, socially limited access to healthcare, stigma, and discrimination associated with HIV/AIDS, poor nutritional status, and cultural like menstrual hygiene practices and traditional practices (herbal medicine usage) differences in hygiene practices, may contribute to this gender disparity. The presence of a latrine/toilet was found to be a significant protective factor against intestinal parasitic infections. Participants who did not have access to a latrine were 1.2 times more likely to acquire such infections compared to those who had access. This finding highlights the importance of proper sanitation and hygiene practices in preventing parasitic infections, particularly in resource-limited settings like East and West Gojam Zones. Lack of access to adequate sanitation facilities increases the risk of fecal–oral transmission of parasites ( 27 , 28 ).
Furthermore, the viral load level and the WHO stage of HIV/AIDS were significantly associated with intestinal parasitosis. Individuals with a viral load count between 20 and 1000 cps/ml were more likely to develop parasitic infections compared to those with undetectable viral load counts. This finding suggests that individuals with higher viral loads may have compromised immune systems, making them more susceptible to opportunistic infections, including intestinal parasites ( 23 , 29 ). Additionally, patients in WHO stage 4 of HIV/AIDS had a higher likelihood of being infected with parasitic infections compared to those in stage 1. Advanced HIV/AIDS disease progression weakens the immune system, increasing vulnerability to various infections, including parasitic infections ( 30 ).
Individuals with a CD4 count below 200 cell/mm 3 , indicating advanced HIV/AIDS progression, had a significantly higher likelihood of being infected with intestinal parasites. In this study, the adjusted odds ratio was 5.7 (95% CI 2.77–11.7). Even individuals with a CD4 count between 200 and 500 cells/mm 3 showed an increased risk of parasitic infections compared to those with higher CD4 counts, with an adjusted odds ratio of 4.6 (95% CI 1.80–11.7, p-value = 0.001). Walking barefoot was also significantly associated with a higher risk of parasitic infections, with an adjusted odds ratio of 6.6 (95% CI 2.7–16.4, p-value = 0.001). These findings emphasize the importance of monitoring CD4 counts, promoting preventive measures, and improving hygiene practices, including the use of footwear, to reduce the burden of intestinal parasitic infections among individuals living with HIV/AIDS.
The findings of this study have important implications for public health interventions in East and West Gojam Zones, Amhara region, Ethiopia. Targeted interventions should focus on improving health literacy and promoting proper sanitation and hygiene practices among individuals living with HIV/AIDS. Efforts to increase awareness about the importance of regular screening and appropriate treatment for intestinal parasitic infections are crucial. Integration of interventions targeting both HIV/AIDS and parasitic infections is recommended to improve the overall health outcomes of individuals living with HIV/AIDS. This can include providing comprehensive healthcare services that address both HIV/AIDS management and the prevention and treatment of parasitic infections. The strength of this study was used different parasitological diagnostic modalities to detect IPs in people living with HIV/AIDS, however, there was a delayance in sample transportation to the reference laboratory which performed formol-ether concentration technique and modified acid-fast staining, this issue could affect the prevalence of IPs among the participants.
This study highlights the high prevalence of intestinal parasitic infections among individuals living with HIV/AIDS in East and West Gojam Zones, Amhara region, Ethiopia. The findings underscore the importance of addressing socio-demographic factors, such as gender and educational status, as well as improving sanitation and hygiene practices among this vulnerable population. Integrated interventions that target both HIV/AIDS and parasitic infections are essential to improve the overall health and well-being of individuals living with HIV/AIDS in this region.
Availability of data and materials
The datasets used and/or analysed during the current study are in the manuscript and available from the corresponding author on reasonable request.
Abbreviations
Acid fast bacilli
Acquired immuno deficiency syndrome
Anti retro viral treatment
Cluster for differentiation
Debre markos compressive specialized hospital
Finote selam general hospital
Lumamie distirict hospital
Yejuba district hospital
Central nervous system
Human immunodeficiency virus
People living with human immunodeficiency virus
Human thymus lymphocyte virus
- Intestinal parasite
Ministry of Health
Stastical package of social science
Revolution per minute
United Nation on ADIS Program
Highly active antiretroviral therapy
People living with HIV/ADIS
WHO. HIV and AIDS. 2023. https://www.who.int/news-room/fact-sheets/detail/hiv-aids . Accessed 13 July 2023.
Nsagha DS, Njunda AL, Assob NJC, Ayima CW, Tanue EA, Kibu OD, et al. Intestinal parasitic infections in relation to CD4+ T cell counts and diarrhea in HIV/AIDS patients with or without antiretroviral therapy in Cameroon. BMC Infect Dis. 2015;16:1–10.
Article Google Scholar
Mirkuzie AH, Ali S, Abate E, Worku A, Misganaw AJBPH. Progress towards the 2020 fast track HIV/AIDS reduction targets across ages in Ethiopia as compared to neighboring countries using global burden of diseases 2017 data. BMC Public Health. 2021;21:1–10.
EPHI. HIV Related Estimats and Projections in Ethiopia for the Year-2020. 2021. https://ephi.gov.et/research/hiv-and-tb/ .
Akalu TY, Aynalem YA, Shiferaw WS, Merkeb Alamneh Y, Getnet A, Abebaw A, et al. National burden of intestinal parasitic infections and its determinants among people living with HIV/AIDS on anti-retroviral therapy in Ethiopia: a systematic review and meta-analysis. SAGE Open Med. 2022;10:20503121221082450.
Article PubMed PubMed Central Google Scholar
Lv T, Cao W, Li T. HIV-related immune activation and inflammation: current understanding and strategies. J Immunol Res. 2021;2021:7316456.
Klatt NR, Chomont N, Douek DC, Deeks SG. Immune activation and HIV persistence: implications for curative approaches to HIV infection. Immunol Rev. 2013;254(1):326–42.
Missaye A, Dagnew M, Alemu A, Alemu AJAR. Prevalence of intestinal parasites and associated risk factors among HIV/AIDS patients with pre-ART and on-ART attending dessie hospital ART clinic, Northeast Ethiopia. AIDS Res Ther. 2013;10(1):1–9.
Tay SC, Aryee EN, Badu K. Intestinal parasitemia and HIV/AIDS co-infections at varying CD4+ T-cell levels. HIV/AIDS Res Treat Open J. 2017;4(1):40–8.
Udeh EO, Obiezue RN, Okafor FC, Ikele CB, Okoye IC, Otuu CA. Gastrointestinal parasitic infections and immunological status of HIV/AIDS coinfected individuals in Nigeria. Annals Global Health. 2019. https://doi.org/10.5334/aogh.2554 .
Kipyegen CK, Shivairo RS, Odhiambo RO. Prevalence of intestinal parasites among HIV patients in Baringo, Kenya. Pan Afr Med J. 2012;13:37.
PubMed PubMed Central Google Scholar
Vouking MZ, Enoka P, Tamo CV, Tadenfok CN. Prevalence of intestinal parasites among HIV patients at the Yaoundé Central Hospital, Cameroon. Pan Afr Med J. 2014;18:136. https://doi.org/10.11604/pamj.2014.18.136.3052 .
Sangaré I, Bamba S, Cissé M, Zida A, Bamogo R, Sirima C, et al. Prevalence of intestinal opportunistic parasites infections in the University hospital of Bobo-Dioulasso. Burkina Faso. 2015;4:1–6.
Google Scholar
Wondmieneh A, Gedefaw G, Alemnew B, Getie A, Bimerew M, Demis A. Intestinal parasitic infections and associated factors among people living with HIV/AIDS in Ethiopia: a systematic review and meta-analysis. PLoS ONE. 2020;15(12):e0244887.
Article CAS PubMed PubMed Central Google Scholar
Worku ED, Asemahagn MA, Endalifer ML. Epidemiology of HIV infection in the Amhara Region of Ethiopia, 2015 to 2018 surveillance data analysis. HIV AIDS (Auckl). 2020;12:307–14. https://doi.org/10.2147/HIV.S253194 .
Article PubMed Google Scholar
Gietaneh W, Agegne A, Gedif G. Prevalence of intestinal parasites and associated factors among HIV patients who had follow up at Debre Markos referral hospital, Northwest Ethiopia, from 2015–2019. 2019.
Weinberg JL, Kovarik CL. The WHO clinical staging system for HIV/AIDS. AMA J Ethics. 2010;12(3):202–6.
Mulugeta SS, Wassihun SG. Prevalence of HIV/AIDS infection among sexually active women in Ethiopia further analysis of 2016 EDHS. AIDS Res Treat. 2022. https://doi.org/10.1155/2022/8971654 .
Feleke DG, Ali A, Bisetegn H, Andualem M. Intestinal parasitic infections and associated factors among people living with HIV attending Dessie referral hospital, Dessie town, North-east Ethiopia: a cross-sectional study. AIDS Res Ther. 2022;19(1):1–6.
Govender RD, Hashim MJ, Khan MA, Mustafa H, Khan HMG. Global epidemiology of HIV/AIDS: a resurgence in North America and Europe. J Epidemiol Glob Health. 2021;11(3):296.
Nigussie T, Aferu T, Mamo Y, Feyisa MJHA-R, Care P. Patient Satisfaction with HIV and AIDS Services in Mizan-Tepi University Teaching Hospital, Southwest Ethiopia. HIV/AIDS Res Palliat Care. 2020. https://doi.org/10.2147/HIV.S254744 .
Badacho AS, Chama A, Darebo TD, Woltamo DD. Client satisfaction with antiretroviral treatment services in South Ethiopian public health facilities: an institution-based cross-sectional survey. Global Health Act. 2023;16(1):2212949.
Dereb E, Negash M, Teklu T, Damtie D, Abere A, Kebede F, et al. Intestinal parasitosis and its association with CD4+ T cell count and viral load among people living with HIV in parasite endemic settings of Northwest Ethiopia. HIV/AIDS. 2021;13:1055–65.
CAS Google Scholar
Alemayehu E, Gedefie A, Adamu A, Mohammed J, Kassanew B, Kebede B, et al. Intestinal parasitic infections among HIV-infected patients on antiretroviral therapy attending debretabor general hospital, Northern Ethiopia: a cross-sectional study. HIV/AIDS Res Palliat Care. 2020. https://doi.org/10.2147/HIV.S275358 .
Miressa R, Dufera M. Prevalence and predisposing factors of intestinal parasitic infections among HIV positive patients visiting Nekemte Specialized Hospital, Western Ethiopia. HIV AIDS (Auckl). 2021;13:505–12. https://doi.org/10.2147/HIV.S304294 .
Alemayehu E, Gedefie A, Adamu A, Mohammed J, Kassanew B, Kebede B, et al. Intestinal parasitic infections among HIV-infected patients on antiretroviral therapy attending Debretabor general hospital, Northern Ethiopia: a cross-sectional study. HIV/AIDS. 2020;12:647–55.
Zacharia F, Silvestri V, Mushi V, Ogweno G, Makene T, Mhamilawa LE. Burden and factors associated with ongoing transmission of soil-transmitted helminths infections among the adult population: a community-based cross-sectional survey in Muleba district, Tanzania. PLoS ONE. 2023;18(7):e0288936.
Masaku J, Okoyo C, Araka S, Musuva R, Njambi E, Njomo DW, et al. Understanding factors responsible for the slow decline of soil-transmitted helminthiasis following seven rounds of annual mass drug administration (2012–2018) among school children in endemic counties of Kenya: a mixed method study. PLoS Negl Trop Dis. 2023;17(5):e0011310.
Feleke DG, Ali A, Bisetegn H, Andualem M. Intestinal parasitic infections and associated factors among people living with HIV attending Dessie Referral Hospital, Dessie town, North-east Ethiopia: a cross-sectional study. AIDS Res Ther. 2022;19(1):19.
World Health Organization. Interim WHO clinical staging of HVI/AIDS and HIV/AIDS case definitions for surveillance African Region. Geneva: World Health Organization; 2005.
Download references
Acknowledgements
We express our gratitude to the Department of Medical Laboratory Sciences, Health Science College, Debre Markos University for facilitating the study. We would also like to extend our deepest appreciation to the staff of hospitals and health centers, particularly those in the ART department, as well as the study participants who were involved in the research.
None applicable.
Author information
Authors and affiliations.
Department of Medical Laboratory Science, College of Health Sciences, Debre Markos University, P.O. Box 269, Debre Markos, Ethiopia
Mengistu Endalamaw, Abel Alemneh, Gashaw Azanaw Amare, Abebe Fenta & Habtamu Belew
You can also search for this author in PubMed Google Scholar
Contributions
ME and AA were responsible for designing the study, collecting, analysing the data, a interpreting the results, and writing the initial manuscript. GAA and AF were involved in analysing and critically reviewing the manuscript. HB supervised the data collection process and ensured the quality of the data. All authors actively participated in preparing and revising the final manuscript, and they all read and approved the final version of the manuscript.
Corresponding authors
Correspondence to Gashaw Azanaw Amare or Habtamu Belew .
Ethics declarations
Ethics approval and consent to participate.
This research has been performed by the Declaration of Helsinki. Ethical clearance was obtained from the ethical review committee of the Department of Medical and Laboratory Sciences, College of Medicine and Health Sciences, Debre Markos University, Ethiopia (DMLS/ser/104/2022). Support letters and permission were obtained from the respective hospitals as well.
Consent for publication
Not applicable.
Competing interests
All authors declare that they have no any competing interests exists.
Additional information
Publisher's note.
Springer Nature remains neutral with regard to jurisdictional claims in published maps and institutional affiliations.
Rights and permissions
Open Access This article is licensed under a Creative Commons Attribution 4.0 International License, which permits use, sharing, adaptation, distribution and reproduction in any medium or format, as long as you give appropriate credit to the original author(s) and the source, provide a link to the Creative Commons licence, and indicate if changes were made. The images or other third party material in this article are included in the article's Creative Commons licence, unless indicated otherwise in a credit line to the material. If material is not included in the article's Creative Commons licence and your intended use is not permitted by statutory regulation or exceeds the permitted use, you will need to obtain permission directly from the copyright holder. To view a copy of this licence, visit http://creativecommons.org/licenses/by/4.0/ . The Creative Commons Public Domain Dedication waiver ( http://creativecommons.org/publicdomain/zero/1.0/ ) applies to the data made available in this article, unless otherwise stated in a credit line to the data.
Reprints and permissions
About this article
Cite this article.
Endalamaw, M., Alemneh, A., Amare, G.A. et al. Magnitude of intestinal parasitic infections and its determinants among HIV/AIDS patients attending at antiretroviral treatment centers in East and West Gojam Zones, Northwest, Ethiopia: institution based cross-sectional study. AIDS Res Ther 21 , 32 (2024). https://doi.org/10.1186/s12981-024-00618-3
Download citation
Received : 05 February 2024
Accepted : 16 April 2024
Published : 16 May 2024
DOI : https://doi.org/10.1186/s12981-024-00618-3
Share this article
Anyone you share the following link with will be able to read this content:
Sorry, a shareable link is not currently available for this article.
Provided by the Springer Nature SharedIt content-sharing initiative
AIDS Research and Therapy
ISSN: 1742-6405
- Submission enquiries: [email protected]
- Open access
- Published: 08 May 2024
CD163 + macrophages in the triple-negative breast tumor microenvironment are associated with improved survival in the Women’s Circle of Health Study and the Women’s Circle of Health Follow-Up Study
- Angela R. Omilian 1 ,
- Rikki Cannioto 1 ,
- Lucas Mendicino 1 ,
- Leighton Stein 2 ,
- Wiam Bshara 2 ,
- Bo Qin 3 , 4 ,
- Elisa V. Bandera 3 , 4 ,
- Nur Zeinomar 3 , 4 ,
- Scott I. Abrams 5 ,
- Chi-Chen Hong 1 ,
- Song Yao 1 ,
- Thaer Khoury 2 &
- Christine B. Ambrosone 1
Breast Cancer Research volume 26 , Article number: 75 ( 2024 ) Cite this article
336 Accesses
Metrics details
Tumor-associated macrophages (TAMs) are a prominent immune subpopulation in the tumor microenvironment that could potentially serve as therapeutic targets for breast cancer. Thus, it is important to characterize this cell population across different tumor subtypes including patterns of association with demographic and prognostic factors, and breast cancer outcomes.
We investigated CD163 + macrophages in relation to clinicopathologic variables and breast cancer outcomes in the Women’s Circle of Health Study and Women’s Circle of Health Follow-up Study populations of predominantly Black women with breast cancer. We evaluated 611 invasive breast tumor samples (507 from Black women, 104 from White women) with immunohistochemical staining of tissue microarray slides followed by digital image analysis. Multivariable Cox proportional hazards models were used to estimate hazard ratios for overall survival (OS) and breast cancer-specific survival (BCSS) for 546 cases with available survival data (median follow-up time 9.68 years (IQR: 7.43–12.33).
Women with triple-negative breast cancer showed significantly improved OS in relation to increased levels of tumor-infiltrating CD163 + macrophages in age-adjusted (Q3 vs. Q1: HR = 0.36; 95% CI 0.16–0.83) and fully adjusted models (Q3 vs. Q1: HR = 0.30; 95% CI 0.12–0.73). A similar, but non-statistically significant, association was observed for BCSS. Macrophage infiltration in luminal and HER2+ tumors was not associated with OS or BCSS. In a multivariate regression model that adjusted for age, subtype, grade, and tumor size, there was no significant difference in CD163 + macrophage density between Black and White women (RR = 0.88; 95% CI 0.71–1.10).
Conclusions
In contrast to previous studies, we observed that higher densities of CD163 + macrophages are independently associated with improved OS and BCSS in women with invasive triple-negative breast cancer.
Trial registration
Not applicable.
The tumor-immune microenvironment (TIME) has a key role in pathologic complete response and patient survival in breast cancer [ 1 , 2 , 3 , 4 ]. While tumor-infiltrating lymphocytes (TILs) in aggregate and various T cell subpopulations have been routinely examined, tumor-associated macrophages (TAMs) and other cells of the myeloid lineage have received less attention, despite being a prevalent immune subpopulation in breast carcinoma. Typically, high macrophage counts in breast tumors are regarded as being associated with tumor progression and poorer survival [ 5 , 6 , 7 , 8 ]. However, much prior work on macrophage markers in relation to breast cancer outcomes had small study samples that precluded analyses stratified by subtype, or adequately powered analyses adjusted for prognostic factors that are known to influence breast cancer survival. Moreover, most of these earlier studies were overwhelmingly conducted in populations of White or Asian women, and representation of Black women on this topic is poor, with only a handful of studies to date [ 9 , 10 , 11 ].
Novel therapeutic approaches that target macrophages are an increasingly important area of clinical study, and thus it is important to understand how specific macrophage markers vary in accordance with demographic and clinical factors [ 12 , 13 ]. As part of our ongoing work that investigates the breast TIME in relation to aggressive disease and poorer outcomes in Black women, we investigated the macrophage marker CD163 among women participating in the Women’s Circle of Health Study and Women’s Circle of Health Follow-up Study. Our objective was to compare macrophage infiltration between Black and White women and to investigate the association of CD163 + cells with overall and breast cancer-specific survival in a study sample that was large enough to allow stratification by subtype and adjustment for known prognostic factors in breast cancer.
Study population
We used data and tissue samples from women participating in the Women’s Circle of Health Study (WCHS), a multi-site, case–control study designed to evaluate the risk factors for aggressive breast cancer in Black and White women, and the Women’s Circle of Health Follow-up Study (WCHFS), a population-based cohort study of Black breast cancer survivors, both of which have been described extensively in our previous work and in the Additional file 1 : Methods [ 14 , 15 , 16 , 17 ]. The WCHS and WCHFS used the same methods for recruitment, interviews, and eligibility. Briefly, participants were 20–75 years old; self-identified as Black or White (for WCHS); had primary, histologically confirmed invasive breast cancer or ductal carcinoma in situ (DCIS); and had no previous history of cancer other than non-melanoma skin cancer. Women in WCHS were diagnosed between 2001 and 2013 and included Black and White cases from New York City and New Jersey; while cases in WCHFS included only Black women diagnosed from 2013 to 2019 in New Jersey. Clinical and tumor pathology variables were extracted from the pathology reports. All women provided informed consent and the study protocol was approved by the Institutional Review Boards at Rutgers Cancer Institute of New Jersey and Roswell Park Comprehensive Cancer Center.
Tissue samples
Formalin-fixed and paraffin-embedded (FFPE) invasive breast tumor tissues were built into tissue microarrays (TMAs) under the guidance of an experienced breast pathologist (TK). TMA cores ranged in size from 0.6 to 1.2 mm in diameter, and the majority of patient tumors (67.2%) were represented by at least 3 TMA cores (range 1–6 cores). We aimed to include both tumor nests and stromal regions when selecting regions for coring and avoid the tumor margins. TMA construction was completed in 2017 from patients recruited up until this point with incident, primary, and treatment-naïve invasive breast cancer. As the WCHS and WCHFS focused on recruiting Black women, the number of cases from Black women in our dataset exceeds the number of White cases (Black: N = 507, White: N = 104).
Immunohistochemical staining and image analysis
CD163 has long been established as a clinical antibody for detecting histiocytes that has greater specificity than CD68 [ 18 ], and is commonly used to represent immunosuppressive macrophages in the TIME in research studies [ 19 ]. Immunohistochemistry (IHC) was performed by the Pathology Network Shared Resource at Roswell Park following standard procedures. To reduce staining variability that can occur with IHC, we used an automated staining platform, clinical-grade reagents, and stained all TMAs in a single batch. Briefly, TMA sections were cut at 4 μm, placed on charged slides, dried, and deparaffinized. Bond Epitope Retrieval 2 (Leica AR9640) was used for antigen retrieval. Slides were stained on the Leica Bond Rx autostainer with the CD163 antibody (Leica Biosystems, clone 10D6) and the Bond Polymer Refine Detection kit (Leica DS9800). Diaminobenzidine (DAB) was used for marker visualization. TMA cores were excluded if the tumor could not be reliably scored for CD163 marker expression (e.g., the tissue was folded or damaged) or there was insufficient tumor cellularity (cutoff set at 100 tumor cells).
Slides were digitally scanned using Aperio AT2 (Leica Biosystems, Inc., Buffalo Grove, IL) with 20X bright-field microscopy. Aperio ImageScope version 12.4.3.8007 (Leica Biosystems, Inc., Buffalo Grove, IL) was used for image analysis. Slide image data fields were populated, and images were visually examined for quality and amended as necessary (e.g., core excluded if there was excessive folding or damage). An annotation layer was created for each core and our study pathologist who was blinded to sample characteristics made an image analysis algorithm macro that was used to quantify the number of cells that were positive for CD163 stain. Details pertaining to the algorithm and scoring are described in the Additional file 1 : Methods. The number of CD163 + cells in each patient sample were reported per square millimeter of tumor tissue and the average CD163 + cell density across multiple cores from each patient was used for analyses.
Epidemiological and tumor variables
Women self-identified their race in the baseline questionnaire. Tumor and clinicopathological factors were abstracted from the patient pathology report and included AJCC stage, grade, tumor size, node status, and treatment (surgery, chemotherapy, radiation therapy, and/or hormone therapy). Breast cancer subtypes were inferred from estrogen receptor (ER), progesterone receptor (PR), and human epidermal growth factor receptor 2 (HER2) status information from the pathology reports as follows: luminal (HR+/HER2−), HER2-positive (HR+/HER2+ or HR-/HER2+), and triple-negative (HR-/HER2−), where hormone receptor (HR+) refers to ER+ and/or PR+. Other factors, including age and body mass index (BMI), were obtained by interviewer- and self-administered questionnaires at baseline and have been previously described [ 20 ].
Breast cancer outcomes
Data on vital status, including dates and causes of death, were ascertained through linkage with the New Jersey State Cancer Registry files, and were available for 546 cases. Primary outcomes of interest in the study were overall survival (OS) and breast cancer-specific survival (BCSS). The ICD-10 code (C50) was used to identify breast cancer mortality. Time to follow-up was calculated from the date of diagnosis until the date of last follow-up (August 2023) or death from any cause or death from breast cancer.
Statistical analyses
Demographic and clinical factors were summarized using the mean and standard deviation for normally distributed continuous variables and the median and interquartile range (IQR) otherwise, and number and percentage for categorical variables. A negative binomial regression model was used to resolve overdispersion of CD163 + cell density and non-normally distributed residuals seen with a linear model. A zero-inflation parameter was included due to underfitting of zero values and an offset term for the log of total cell density to account for tumor cellularity differences across patients. Model assumptions were verified graphically. Beta coefficients were exponentiated to obtain Rate Ratios (RR) and 95% Confidence Intervals (CI) representing the change in CD163 + cell density in terms of percentage increase or decrease. Separate models were used to model CD163 + cell density as a function of race and clinical/tumor factors. F tests about the appropriate contrasts of model estimates were used to evaluate, within race, the association between CD163 + cell density and each factor. A multivariable model was formulated to assess the association between race and CD163 + macrophage density, adjusted for age, subtype, grade, and tumor size.
Multivariable Cox regression models were used to compute hazard ratios (HRs) and 95% confidence intervals (CIs) for the association of CD163 + cell density with OS and BCSS for each breast cancer subtype. As there are currently no established cutoffs in the literature, CD163 + cell density was divided into tertiles. Other cutoffs were examined, including dividing CD163 + cell density at the median, and by quantiles and quintiles. Variables that were significantly associated with CD163 + cell density or survival in the univariate setting were added to a multivariable model and sequentially removed while assessing model fit using a likelihood ratio test (Additional file 1 : Tables S1 and S2). Covariates were retained in the final model if their inclusion improved model fit. Model covariates differed by breast cancer subtype. Model 1 was adjusted for age at diagnosis. For OS, Model 2 was adjusted for age, BMI, stage, and tumor size in the luminal subtype; age plus tumor size for the HER2+ subtype; and age, stage, grade, and node status for the triple-negative subtype. For BCSS, Model 2 was adjusted for age and BMI in the luminal subtype; no additional covariates were retained for the HER2+ subtype; and age and stage for the triple-negative subtype. The proportional hazards assumption was verified graphically by analyzing the correlation between time and scaled Schoenfeld residuals. All statistical analyses were conducted in R (version 4.2.0) and two-sided p values ≤ 0.05 were considered statistically significant. Analyses are reported according to REMARK guidelines [ 21 ].
Characteristics of the cohort
Cohort characteristics are shown in Table 1 and the study sampling schema is shown in Additional file 1 : Figure S1. In total, there were 611 women with invasive breast cancer (507 Black and 104 White); of these 546 women had available survival data. Compared with White women, Black women were significantly more likely to have higher BMI (30.5 vs 26.6 kg/m 2 ), have tumors that were ER-negative (33.5 vs 21.2, p = 0.01), triple-negative (25.5 vs 14.4, p = 0.04), and tumors with higher grade (54.1 grade 3 vs 35.6 p = 0.003). Black women were also more likely than White women to have received radiation therapy (68.5 vs 46.5, p < 0.001). There were no statistically significant differences between Black and White women in age, the distribution of breast cancer stage, mean tumor size, node status, and the receipt of surgery, chemotherapy, or hormone therapy.
Macrophage densities, race, and clinical prognostic factors
Staining is shown for cores representative of low, intermediate, and high levels of CD163 + macrophage infiltration in Fig. 1 . Almost all women in the WCHS had macrophages in their tumors; CD163 + macrophages were not detected in only 6 out of 611 women. In univariate analyses, Black women had a significantly higher density of CD163 + cells ( p = 0.0099, Fig. 2 a). CD163 + macrophage densities were also higher in triple-negative tumors ( p < 0.0001, Fig. 2 b), and higher-grade tumors ( p < 0.0001, Fig. 2 c). Black women with the triple-negative subtype (median 574.3 cells/μm 2 , p < 0.001), Black women with the HER2 + subtype (314.6 cells/μm 2 , p < 0.001), and White women with the HER2 + subtype (281.5 cells/μm 2 , p = 0.035) had significantly higher densities of CD163 + macrophages compared to White women with the luminal subtype (Fig. 2 d). In the overall study population, CD163 + macrophage density was significantly associated with age ( p = 0.025), breast cancer subtype ( p < 0.001), stage ( p < 0.001), grade ( p < 0.001), and tumor size ( p = 0.002); similar associations were observed when the Black population was examined separately (Table 2 ). In a multivariate negative binomial regression model that adjusted for age, subtype, grade, and tumor size, there were no significant differences in CD163 + macrophage densities between Black and White women (RR = 0.88; 95% CI 0.71–1.10). To investigate a possible cohort effect given that recruitment for White women ended earlier than that for Black women, we compared Black and White cases up until the last timepoint that White women were enrolled and observed similar results (RR = 0.88; 95% CI 0.67–1.16).

Representative CD163 immunohistochemical staining in breast tissue microarray cores. Two representative cores are shown from each of three categories of infiltration: a low, b intermediate, c high

Boxplots comparing CD163 + cell density by a race, b breast cancer subtype, c tumor grade, and d combination of race and breast cancer subtype. Comparisons tested using negative binomial regression. ns non-significant, * p < 0.05, ** p < 0.01, *** p < 0.001, **** p < 0.0001
Survival outcomes and CD163 + macrophages
Data for survival analyses were available for 546 women, with 127 deaths, 66 of which were due to breast cancer. The median follow-up time was 9.68 years (IQR: 7.43–12.33) years. For the overall cohort, increasing tertiles of CD163 + macrophage density were not associated with a significant improvement in OS or BCSS in the age-adjusted models (Table 3 ). For the fully adjusted models, there was a significant association for OS (Q3 vs. Q1: HR = 0.59; 95% CI 0.37–0.94), but not BCSS (Q3 vs. Q1: HR = 0.59; 95% CI 0.30–1.14; Table 3 ). In both age-adjusted and fully adjusted models stratified by subtype, increasing tertiles of CD163 + macrophage density were associated with a significant improvement in OS (Q3 vs. Q1: HR = 0.30; 95% CI 0.12–0.73; Table 4 ) in the triple-negative subtype. A statistically significant association between CD163 + macrophage densities and OS was not observed for the luminal and HER2+ subtypes. A similar pattern was observed for BCSS, in which increasing CD163 + macrophage densities were associated with better survival in the triple-negative subtype only (Q3 vs. Q1: HR = 0.38; 95% CI 0.10–1.44), although the associations were not significant (Table 4 ).
To ensure that race and grade were not confounding the associations that we observed in the triple-negative subtype, additional multivariable analyses that added race and grade as variables in the fully adjusted models were investigated. Again, we observed that increasing CD163 + macrophage density was associated with a significant improvement in OS for the triple-negative subtype (Q3 vs. Q1: HR = 0.28; 95% CI 0.11–0.69), but not for the luminal or HER2+ subtypes (Additional file 1 : Table S3). Several additional sensitivity analyses were performed to ensure our results were robust. Additional cut points of CD163 marker density were examined, such as dividing at the cohort median to differentiate high vs low CD163 density, as well as quantiles and quintiles (Additional file 1 : Tables S4 and S5). We stratified by ER status rather than breast cancer subtype (Additional file 1 : Table S6). Lastly, we performed the analysis in Black patients only (Additional file 1 : Table S7). For all these additional analyses, we observed that increasing levels of CD163 + macrophage infiltration were associated with improved OS in the triple-negative subtype (or ER-negative group for analyses stratified by ER status), and this effect was not observed for the luminal or HER2 + subtypes.
In this study, we found that increasing densities of CD163 + macrophages in the breast TIME were associated with a pronounced and significant improvement in OS for women with the triple-negative subtype. Prior studies investigating the association between TAMs and breast cancer prognosis have contributed to a general consensus that high levels of TAMs in the breast TIME, especially M2-like macrophages, are associated with adverse survival outcomes [ 5 , 6 , 7 , 9 , 22 ]. So, what might explain the differing results in our study? First, we have a relatively large population of Black women allowing us to stratify by subtype and adjust for confounding factors. As subtypes of breast cancer differ in their patterns of short and long-term survival, stratification by subtype can reveal different associations in relation to prognostic or risk factors [ 23 , 24 , 25 ]. This holds true for patterns of immune infiltration in the breast TIME that are known to vary by subtype and show differing associations with survival [ 1 , 26 , 27 ]. The majority of prior studies that examined TAM infiltration in breast carcinoma were underpowered for subtype-specific associations, especially for the triple-negative subtype, in which sample sizes were extremely small [ 5 , 6 , 9 , 11 ].
Second, macrophages are a complex immune cell population with a variety of phenotypes and functional states that can be tissue specific and dependent on microenvironmental cues and/or spatial proximity to other immune subsets [ 28 , 29 , 30 ]. Moreover, there are no standardized methods for macrophage detection and different studies have used different markers (e.g., CD68, CD163, or CD206) and staining platforms to make conclusions about the prognostic value of macrophages in invasive breast cancer. Methods for quantifying macrophages in the breast TIME are also heterogeneous (e.g., density, percentage) as well as the tissue compartment in which macrophages are assessed (e.g., tumor compartment vs. stroma or both). The cutoff values for what constitute high versus low macrophage infiltration also varies by study, as well as what factors are included in multivariable models.
We conducted several quality controls and performed several sensitivity analyses to ensure that our findings were robust. First, we used a clinical-grade CD163 antibody that is approved for in vitro diagnostic purposes. Second, quality control for staining specificity was performed by an experienced breast pathologist. Third, automated image analysis was performed ensuring that the quantification of CD163 positive cells was standardized and objective across each TMA core. Fourth, all TMAs were stained in a single batch to eliminate inter-batch variability that is known to occur with IHC. From an analysis standpoint, we examined different cutoffs for what constitutes high or low CD163 + macrophage infiltration, dividing the cohort at the median, tertiles, quantiles, and quintiles. We examined associations when stratifying by ER status instead of subtype. Lastly, we examined Black women separately. The same general patterns of improved OS and BCSS in the triple-negative subtype (or ER- group) were observed across all these additional analyses.
As shown in our results and in the literature, high macrophage infiltration in breast cancer is correlated with several factors that indicate poor survival, like the triple-negative subtype, and higher grade and stage [ 5 , 6 , 7 , 8 ]. In prior studies that could not account for these factors, the associations of high macrophage densities with poor survival may have been largely driven by these correlated factors. A recent study that investigated multiple macrophage markers in relation to breast cancer outcomes showed that when examining the ER-positive versus ER-negative groups separately, high expression of CD163 was associated with improved OS in ER− cases, but not in ER+ cancers [ 31 ]. When examining CD163 expression by tumor locations, Fortis et al. found that disease-free survival (DFS) and OS were prolonged in patients with CD163 expression that was low in the tumor center but high at the invasive margins compared to the inverse (i.e., high in tumor center and low in the invasive margin) [ 32 ]. Collectively, these findings together with those reported in our study add to the existing body of evidence suggesting that tumor-associated macrophages have distinct programs that vary by tissue context or breast cancer subtype. While CD163 + macrophages are usually regarded as immune-suppressing and tumor-promoting, human macrophages are likely to concurrently exhibit phenotypic characteristics of both M1-like and M2-like subtypes. Therefore, to gain a broader appreciation of the macrophage response in breast cancer outcomes, phenotypic studies combined with comprehensive functional and transcriptomic analyses may strengthen translational relevance to prognosis.
Univariate analyses showed that CD163 + cell densities differed between Black and White women, but these differences were attenuated in the multivariable analyses that adjusted for age, grade, tumor size, and breast cancer subtype. Earlier work has shown that immune profiles vary in breast tumors from Black and White women [ 14 , 15 , 33 , 34 ]. While other studies have compared macrophage markers in Black and White women, to our knowledge, only a couple studies have compared CD163 marker expression specifically [ 9 , 10 ]. Koru-Sengul et al. reported that Black women had higher levels of CD163 + macrophages, however multivariable analyses were not performed [ 11 ]. In a more recent study, Bauer et al. found that the frequency of CD163 + macrophages varied by region within African populations and a population from Germany; West African women had the highest numbers of CD163 + macrophages [ 35 ].
The strengths of this work are accompanied by some limitations. While our study sample exceeds that of several prior studies of CD163 in relation to breast cancer prognosis, it is nonetheless not as large as some of the more well-characterized T cell populations like CD8 + T cells [ 4 ], and our findings need to be replicated in additional cohorts. As the WCHS and WCHFS prioritized recruitment of Black women, our findings may not be generalizable to more demographically or clinically diverse populations. As the vast majority (89.5%) of our cases were obtained through the New Jersey Cancer registry, our sample is largely population-based. Nonetheless, potential sources of bias include women who agreed to participate verses those who did not. However, the distributions of tumor stage and grade are similar among participants in the WCHFS and all eligible breast cancer cases in the New Jersey State Cancer Registry in the same counties, suggesting that tumor characteristics in our study are representative of Black women diagnosed with breast cancer in New Jersey [ 16 ]. Recall bias is minimized as the data pertaining to the tumor characteristics were obtained by independent review of pathology reports. Despite adjusting for important clinical and demographic prognostic factors, we cannot rule out the possibility of residual confounding due to unmeasured variables. Lastly, although whole sections are ideal for studies of the TIME, a study of this size is not practicable with whole sections, and therefore TMAs are commonly used in large studies of marker expression in breast cancer [ 4 , 36 , 37 ]. Importantly, we cored the interior of the tumor block for TMA construction and thus our results are specific to this region and do not apply to the tumor interface or other non-tumor regions. Macrophages are a complex population and our future work will build on this fundamental finding, making use of multiplexed panels to more fully define macrophage phenotypes in women with invasive breast cancer, as well as their spatial distribution, which could further influence their prognostic relevance [ 32 ].
We observed that higher densities CD163 + macrophages are independently associated with improved OS and BCSS in the triple-negative subtype. Future investigations will expand upon this work in a larger cohort, incorporating more comprehensive multiplexed staining technologies to further define the complexity of macrophage functional states and compare their localization within the TIME to prognosis in women with invasive breast cancer.
Availability of data and materials
Epidemiological data and image data are available from the corresponding author upon reasonable request.
Denkert C, von Minckwitz G, Darb-Esfahani S, et al. Tumour-infiltrating lymphocytes and prognosis in different subtypes of breast cancer: a pooled analysis of 3771 patients treated with neoadjuvant therapy. Lancet Oncol. 2018;19:40–50.
Article PubMed Google Scholar
Fridman WH, Zitvogel L, Sautes-Fridman C, Kroemer G. The immune contexture in cancer prognosis and treatment. Nat Rev Clin Oncol. 2017;14:717–34.
Article CAS PubMed Google Scholar
Savas P, Salgado R, Denkert C, et al. Clinical relevance of host immunity in breast cancer: from TILs to the clinic. Nat Rev Clin Oncol. 2016;13:228–41.
Ali HR, Provenzano E, Dawson SJ, et al. Association between CD8+ T-cell infiltration and breast cancer survival in 12,439 patients. Ann Oncol. 2014;25:1536–43.
Medrek C, Ponten F, Jirstrom K, Leandersson K. The presence of tumor associated macrophages in tumor stroma as a prognostic marker for breast cancer patients. BMC Cancer. 2012;12:306.
Article CAS PubMed PubMed Central Google Scholar
Tiainen S, Tumelius R, Rilla K, et al. High numbers of macrophages, especially M2-like (CD163-positive), correlate with hyaluronan accumulation and poor outcome in breast cancer. Histopathology. 2015;66:873–83.
Ni C, Yang L, Xu Q, et al. CD68- and CD163-positive tumor infiltrating macrophages in non-metastatic breast cancer: a retrospective study and meta-analysis. J Cancer. 2019;10:4463–72.
Jamiyan T, Kuroda H, Yamaguchi R, Abe A, Hayashi M. CD68- and CD163-positive tumor-associated macrophages in triple negative cancer of the breast. Virchows Arch. 2020;477:767–75.
Mukhtar RA, Moore AP, Nseyo O, et al. Elevated PCNA+ tumor-associated macrophages in breast cancer are associated with early recurrence and non-Caucasian ethnicity. Breast Cancer Res Treat. 2011;130:635–44.
Carrio R, Koru-Sengul T, Miao F, et al. Macrophages as independent prognostic factors in small T1 breast cancers. Oncol Rep. 2013;29:141–8.
Koru-Sengul T, Santander AM, Miao F, et al. Breast cancers from black women exhibit higher numbers of immunosuppressive macrophages with proliferative activity and of crown-like structures associated with lower survival compared to non-black Latinas and Caucasians. Breast Cancer Res Treat. 2016;158:113–26.
Mantovani A, Allavena P, Marchesi F, Garlanda C. Macrophages as tools and targets in cancer therapy. Nat Rev Drug Discov. 2022;21:799–820.
Goswami S, Anandhan S, Raychaudhuri D, Sharma P. Myeloid cell-targeted therapies for solid tumours. Nat Rev Immunol. 2023;23:106–20.
Yao S, Cheng TD, Elkhanany A, et al. Breast tumor microenvironment in black women: a distinct signature of CD8+ T-cell exhaustion. J Natl Cancer Inst. 2021;113:1036–43.
Article PubMed PubMed Central Google Scholar
Abdou Y, Attwood K, Cheng TD, et al. Racial differences in CD8(+) T cell infiltration in breast tumors from Black and White women. Breast Cancer Res. 2020;22:62.
Bandera EV, Demissie K, Qin B, et al. The Women’s Circle of Health Follow-Up Study: a population-based longitudinal study of Black breast cancer survivors in New Jersey. J Cancer Surviv. 2020;14:331–46.
Ambrosone CB, Ciupak GL, Bandera EV, et al. Conducting molecular epidemiological research in the age of HIPAA: a multi-institutional case-control study of breast cancer in African-American and European-American Women. J Oncol. 2009;2009:871250.
Lau SK, Chu PG, Weiss LM. CD163: a specific marker of macrophages in paraffin-embedded tissue samples. Am J Clin Pathol. 2004;122:794–801.
Mantovani A, Marchesi F, Malesci A, Laghi L, Allavena P. Tumour-associated macrophages as treatment targets in oncology. Nat Rev Clin Oncol. 2017;14:399–416.
Bandera EV, Qin B, Lin Y, et al. Association of body mass index, central obesity, and body composition with mortality among black breast cancer survivors. JAMA Oncol. 2021;7:1–10.
McShane LM, Altman DG, Sauerbrei W, et al. Reporting recommendations for tumor marker prognostic studies (REMARK). J Natl Cancer Inst. 2005;97:1180–4.
Sousa S, Brion R, Lintunen M, et al. Human breast cancer cells educate macrophages toward the M2 activation status. Breast Cancer Res. 2015;17:101.
Ambrosone CB, Zirpoli G, Ruszczyk M, et al. Parity and breastfeeding among African-American women: differential effects on breast cancer risk by estrogen receptor status in the Women’s Circle of Health Study. Cancer Causes Control. 2014;25:259–65.
Millikan RC, Newman B, Tse CK, et al. Epidemiology of basal-like breast cancer. Breast Cancer Res Treat. 2008;109:123–39.
Blows FM, Driver KE, Schmidt MK, et al. Subtyping of breast cancer by immunohistochemistry to investigate a relationship between subtype and short and long term survival: a collaborative analysis of data for 10,159 cases from 12 studies. PLoS Med. 2010;7:e1000279.
Stanton SE, Adams S, Disis ML. Variation in the incidence and magnitude of tumor-infiltrating lymphocytes in breast cancer subtypes: a systematic review. JAMA Oncol. 2016;2:1354–60.
Hammerl D, Massink MPG, Smid M, et al. Clonality, antigen recognition, and suppression of CD8(+) T cells differentially affect prognosis of breast cancer subtypes. Clin Cancer Res. 2020;26:505–17.
Cassetta L, Fragkogianni S, Sims AH, et al. Human tumor-associated macrophage and monocyte transcriptional landscapes reveal cancer-specific reprogramming, biomarkers, and therapeutic targets. Cancer Cell. 2019;35:588–602.
DeNardo DG, Ruffell B. Macrophages as regulators of tumour immunity and immunotherapy. Nat Rev Immunol. 2019;19:369–82.
Laviron M, Petit M, Weber-Delacroix E, et al. Tumor-associated macrophage heterogeneity is driven by tissue territories in breast cancer. Cell Rep. 2022;39:110865.
Pelekanou V, Villarroel-Espindola F, Schalper KA, Pusztai L, Rimm DL. CD68, CD163, and matrix metalloproteinase 9 (MMP-9) co-localization in breast tumor microenvironment predicts survival differently in ER-positive and -negative cancers. Breast Cancer Res. 2018;20:154.
Fortis SP, Sofopoulos M, Sotiriadou NN, et al. Differential intratumoral distributions of CD8 and CD163 immune cells as prognostic biomarkers in breast cancer. J Immunother Cancer. 2017;5:39.
Martin DN, Boersma BJ, Yi M, et al. Differences in the tumor microenvironment between African-American and European-American breast cancer patients. PLoS ONE. 2009;4:e4531.
Hamilton AM, Hurson AN, Olsson LT, et al. The landscape of immune microenvironments in racially diverse breast cancer patients. Cancer Epidemiol Biomarkers Prev. 2022;31:1341–50.
Bauer M, Vetter M, Stuckrath K, et al. Regional variation in the tumor microenvironment, immune escape and prognostic factors in breast cancer in Sub-Saharan Africa. Cancer Immunol Res. 2023;11:720–31.
Salgado R, Denkert C, Demaria S, et al. The evaluation of tumor-infiltrating lymphocytes (TILs) in breast cancer: recommendations by an International TILs Working Group 2014. Ann Oncol. 2015;26:259–71.
Denkert C, Loibl S, Noske A, et al. Tumor-associated lymphocytes as an independent predictor of response to neoadjuvant chemotherapy in breast cancer. J Clin Oncol. 2010;28:105–13.
Download references
Acknowledgements
Biospecimens or research pathology services for this study were provided by the Pathology Network Shared Resource and the DataBank and Biorepository Shared Resource, which are funded by the National Cancer Institute (NCI P30CA16056) as Cancer Center Support Grant shared resources.
This work was supported by the National Cancer Institute (R01 CA10059, R01 CA185623, R01 CA247281, R01 CA133264, P01 CA151135, R03 CA238792, P30 CA16056). The New Jersey State Cancer Registry, Cancer Epidemiology Services, New Jersey Department of Health are funded by the Surveillance, Epidemiology, and End Results (SEER) Program of the National Cancer Institute under contract No. HHSN261201300021I and No. N01-PC-2013-00021, the National Program of Cancer Registries (NPCR), Centers for Disease Control and Prevention under Grant No. NU5U58DP006279-02-00, and the State of New Jersey and the Rutgers Cancer Institute of New Jersey. Dr. Ambrosone is supported by the Breast Cancer Research Foundation.
Author information
Authors and affiliations.
Department of Cancer Prevention and Control, Roswell Park Comprehensive Cancer Center, Buffalo, NY, USA
Angela R. Omilian, Rikki Cannioto, Lucas Mendicino, Chi-Chen Hong, Song Yao & Christine B. Ambrosone
Department of Pathology, Roswell Park Comprehensive Cancer Center, Buffalo, NY, USA
Leighton Stein, Wiam Bshara & Thaer Khoury
Department of Biostatistics and Epidemiology, Rutgers School of Public Health, Piscataway, NJ, USA
Bo Qin, Elisa V. Bandera & Nur Zeinomar
Cancer Epidemiology and Health Outcomes, Rutgers Cancer Institute of New Jersey, New Brunswick, NJ, USA
Department of Immunology, Roswell Park Comprehensive Cancer Center, Buffalo, NY, USA
Scott I. Abrams
You can also search for this author in PubMed Google Scholar
Contributions
Conception and design of the work: A.R.O., R.C. Acquisition and/or analysis of the data: A.R.O, R.C., L.M., L.S., W.B., B.Q., E.V.B., C.H., T.K., S.Y., C.B.A. Interpretation of data: A.R.O., R.C., L.M., S.I.A., S.Y., T.K., C.B.A., N.Z, E.V.B, B.Q. Drafted the manuscript: A.R.O. Approved the submitted version: All authors. All authors have agreed both to be personally accountable for their contributions and to ensure that questions related to the accuracy or integrity of any part of the work, even ones in which the author was not personally involved, are appropriately investigated, resolved, and the resolution documented in the literature.
Corresponding author
Correspondence to Angela R. Omilian .
Ethics declarations
Ethics approval and consent to participate.
All women provided informed consent and the study protocol was approved by the Institutional Review Boards at Rutgers Cancer Institute of New Jersey and Roswell Park Comprehensive Cancer Center.
Competing interests
The authors declare no competing interests.
Additional information
Publisher's note.
Springer Nature remains neutral with regard to jurisdictional claims in published maps and institutional affiliations.
Supplementary Information
Additional file 1: table s1..
Univariate Cox regression models assessing associations of additional CD163 + cell density cutoffs and cohort characteristics with overall survival (OS) within subtype. Table S2. Univariate Cox regression models assessing associations of additional CD163 + cell density cutoffs and cohort characteristics with breast cancer-specific survival (BCSS) within subtype. Table S3. Multivariable Cox regression models assessing associations between CD163 + cell density tertiles with OS and BCSS within subtype, additionally adjusting for self-identified race and grade in Model 2. Table S4. Multivariable Cox regression models assessing associations of additional CD163 + cell density cutoffs with OS within subtype. Table S5. . Multivariable Cox regression models assessing associations of additional CD163 + cell density cutoffs with BCSS within subtype. Table S6. Multivariable Cox regression models assessing associations between CD163 + cell density tertiles with OS and BCSS by estrogen receptor (ER) status. Table S7. Multivariable Cox regression models assessing associations between CD163 + cell density tertiles with OS and BCSS within Black cases. Figure S1. Diagram of participant availability for CD163 profiling in the Women’s Circle of Health Study.
Rights and permissions
Open Access This article is licensed under a Creative Commons Attribution 4.0 International License, which permits use, sharing, adaptation, distribution and reproduction in any medium or format, as long as you give appropriate credit to the original author(s) and the source, provide a link to the Creative Commons licence, and indicate if changes were made. The images or other third party material in this article are included in the article's Creative Commons licence, unless indicated otherwise in a credit line to the material. If material is not included in the article's Creative Commons licence and your intended use is not permitted by statutory regulation or exceeds the permitted use, you will need to obtain permission directly from the copyright holder. To view a copy of this licence, visit http://creativecommons.org/licenses/by/4.0/ . The Creative Commons Public Domain Dedication waiver ( http://creativecommons.org/publicdomain/zero/1.0/ ) applies to the data made available in this article, unless otherwise stated in a credit line to the data.
Reprints and permissions
About this article
Cite this article.
Omilian, A.R., Cannioto, R., Mendicino, L. et al. CD163 + macrophages in the triple-negative breast tumor microenvironment are associated with improved survival in the Women’s Circle of Health Study and the Women’s Circle of Health Follow-Up Study. Breast Cancer Res 26 , 75 (2024). https://doi.org/10.1186/s13058-024-01831-8
Download citation
Received : 16 February 2024
Accepted : 25 April 2024
Published : 08 May 2024
DOI : https://doi.org/10.1186/s13058-024-01831-8
Share this article
Anyone you share the following link with will be able to read this content:
Sorry, a shareable link is not currently available for this article.
Provided by the Springer Nature SharedIt content-sharing initiative
- Tumor-associated macrophages
- Breast cancer
Breast Cancer Research
ISSN: 1465-542X
- Submission enquiries: [email protected]
- Open access
- Published: 17 May 2024
Nonlinear association of triglyceride-glucose index with hyperuricemia in US adults: a cross-sectional study
- Linjie Qiu 1 na1 ,
- Yan Ren 1 na1 ,
- Jixin Li 1 na1 ,
- Meijie Li 1 ,
- Wenjie Li 2 ,
- Lingli Qin 1 ,
- Chunhui Ning 1 ,
- Jin Zhang 1 &
- Feng Gao 1
Lipids in Health and Disease volume 23 , Article number: 145 ( 2024 ) Cite this article
Metrics details
Despite abundant evidence on the epidemiological risk factors of metabolic diseases related to hyperuricemia, there is still insufficient evidence regarding the nonlinear relationship between triglyceride-glucose (TyG) index and hyperuricemia. Thus, the purpose of this research is to clarify the nonlinear connection between TyG and hyperuricemia.
From 2011 to 2018, a cross-sectional study was carried out using data from the National Health and Nutrition Examination Survey (NHANES). This study had 8572 participants in all. TyG was computed as Ln [triglycerides (mg/dL) × fasting glucose (mg/dL)/2]. The outcome variable was hyperuricemia. The association between TyG and hyperuricemia was examined using weighted multiple logistic regression, subgroup analysis, generalized additive models, smooth fitting curves, and two-piecewise linear regression models.
In the regression model adjusting for all confounding variables, the OR (95% CI) for the association between TyG and hyperuricemia was 2.34 (1.70, 3.21). There is a nonlinear and reverse U-shaped association between TyG and hyperuricemia, with a inflection point of 9.69. The OR (95% CI) before the inflection point was 2.64 (2.12, 3.28), and after the inflection point was 0.32 (0.11, 0.98). The interaction in gender, BMI, hypertension, and diabetes analysis was statistically significant.
Additional prospective studies are required to corroborate the current findings, which indicate a strong positive connection between TyG and hyperuricemia among adults in the United States.
Introduction
Uric acid is produced when purine nucleotides are metabolized. The condition known as hyperuricemia occurs when uric acid levels rise over a certain point due to either excessive uric acid synthesis or inadequate uric acid elimination. It affects patients of all ages and genders, and its prevalence is on the rise globally [ 1 , 2 ]. Up to 2016, the global prevalence of hyperuricemia has reached 21% [ 3 ], and the prevalence of hyperuricemia varies by geographic region. For example, in South Korea, it is 11.4% [ 4 ], and a survey conducted among adults aged 18–59 in China showed a prevalence of 15% for hyperuricemia [ 5 ]. Data from the 2007–2016 National Health and Nutrition Examination Survey (NHANES) show that 14.6–20% of Americans suffer with hyperuricemia [ 6 ]. Furthermore, hyperuricemia poses a serious threat to public health as numerous epidemiological studies have confirmed that it is a significant risk factor for a number of chronic diseases, including gout, cardiovascular diseases, chronic kidney disease, hypertension, metabolic syndrome, and many others [ 7 , 8 , 9 , 10 ], posing a serious threat to public health.
Insulin resistance (IR) is a physiological and pathological process closely associated with hyperuricemia [ 8 ]. Epidemiological studies have confirmed the close association between IR and serum urate concentration [ 11 , 12 ]. High insulin levels induced by IR lead to reduced uric acid excretion and increased production, resulting in uric acid accumulation [ 13 ]. Reducing IR has been shown in studies to lower uric acid levels and lower the chance of developing gout [ 14 ]. An animal experimental study from Japan also found that insulin can promote uric acid reabsorption through urate transporter 1 and ATP-binding cassette sub-family G member 2 [ 15 ]. Additionally, a nationwide cohort study confirmed a significant association between insulin resistance and an increased risk of hyperuricemia [ 16 ]. When assessing IR, the glucose clamp method is regarded as the gold standard. However, the use of this detection technology in clinical practice is restricted because of its complexity and comparatively expensive cost. The body’s level of IR can be determined simply using the triglyceride-glucose (TyG) index [ 17 ]. The two main factors used to compute TyG are fasting triglycerides (TG) and fasting glucose (FPG). Multiple studies have confirmed its reliability in predicting various diseases related to IR [ 18 , 19 , 20 ]. TyG and hyperuricemia are significantly correlated in individuals with non-alcoholic fatty liver disease, diabetic nephropathy, and primary hypertension, according to earlier Chinese research [ 21 , 22 , 23 ]. Li et al. discovered that TyG might predict the coexistence of hypertension and hyperuricemia in the elderly population [ 24 ]. An additional cross-sectional study conducted in Northeast China examined the validity of TyG in determining the risk of hyperuricemia in people 40 years of age and older [ 25 ]. While prior research has indicated a connection between hyperuricemia and TyG index, these investigations mostly examined the Chinese population and had rather small sample sizes. The relationship between the TyG index and hyperuricemia is understudied in the US population. Wang et al. found a positive correlation between hyperuricemia and the TyG index in non-diabetic populations in the United States [ 26 ]. Furthermore, there are no reports on the relationship between the TyG index and hyperuricemia in the general adult population in the United States.
Therefore, for this cross-sectional analysis, NHANES data from 2011 to 2018 were used. This study aims to explore the relationship between TyG and adult Americans’ hyperuricemia.
Study design and population
This study made use of cross-sectional data from the National Center for Health Statistics (NCHS) 2011–2018 NHANES, a nationwide survey that used a sophisticated sampling design. The survey, conducted biennially since 1999, covers demographic, dietary, examination, laboratory, and questionnaire data [ 27 , 28 ]. All participants completed informed permission forms, and the NHANES survey procedures and detailed data are available on the official website after being approved by NCHS.
After excluding 16,539 participants under the age of 20, 247 pregnant participants, 2,440 participants with missing FPG and TG data, and 11,358 participants with missing data on uric acid BMI, blood glucose, hypertension and related covariates, the final analysis includes 8,572 participants in total (Fig. 1 ).

From chart of sample selection from the NHANES 2011–2018
Definitions of the exposure and outcome variables
Employing an automatic analyzer, blood samples from individuals fasting for at least 8 h but less than 24 h were measured for TG and FPG using enzymatic methods. The TyG can be computed using the formula Ln [TG (mg/dL) × FPG (mg/dL)/2] [ 29 ]. By using uricase and H 2 O 2 to undergo enzymatic oxidation, the concentration of uric acid in serum was determined and reported in milligrams per deciliter (mg/dL). This can be multiplied by 59.48 to get micromoles per liter (µmol/L). Serum uric acid levels ≥ 416 µmol/L (7 mg/dL) in men and ≥ 357 µmol/L (6 mg/dL) in women are classified as hyperuricemia, given the diagnostic criteria for the condition [ 30 ].
Definition of covariates
To examine the distinct link between hyperuricemia and TyG, we adjusted for potential confounding factors, including demographics, lifestyle, anthropometric measurements, laboratory examinations, and health conditions. Age, gender, race, marital status, degree of education, and the ratio of household income to poverty were the main demographic factors; lifestyle mainly encompassed smoking status, alcohol consumption, and physical activity; anthropometric measurements primarily incorporated BMI; laboratory examination data mainly included HbA1c, LDL, HDL, eGFR, and serum creatinine; health conditions comprised hypertension, diabetes, arthritis, stroke, and coronary heart disease.
According to survey findings, “Yes” indicates that a person has smoked at least 100 cigarettes in their lifetime, whereas “no” indicates that they have smoked fewer than 100 [ 31 ]. Similarly, alcohol consumption is classified as “yes” (consuming at least 12 drinks per year) or “no” (consuming fewer than 12 drinks per year) [ 32 ]. Physical activity is grouped into three categories—active, moderately active, and inactive—following the guidelines for physical activity [ 33 ]. Three categories are used to classify education levels: below high school, high school, and above high school. Parameters such as HDL, LDL, HbA1c, and serum creatinine are measured from each participant’s fasting venous blood using an automated analyzer. Conditions like high blood pressure, heart disease, stroke, and arthritis are categorized based on self-reported medical diagnosis. The three factors used to identify diabetes are a self-reported medical diagnosis, a glycosylated hemoglobin (HbA1c) of 6.5% or above, or a fasting blood glucose level of 7.0 mmol/L or higher. The widely accepted algorithm developed by the Chronic Kidney Disease Epidemiology Collaboration is used to calculate the estimated glomerular filtration rate (eGFR) [ 34 ].
Statistical analyses
Sample weights were appropriately applied in statistical analyses to account for complex sampling designs, following guidelines from the NHANES official website. All of the study population’s descriptive statistics were calculated, and the TyG index was divided into quartiles. The categorical data were reported as percentages, and the continuous variables were shown as mean ± standard deviation (SD). To examine differences between continuous and categorical data, weighted chi-square tests and weighted linear regression models were employed, respectively. In accordance with the STROBE statement [ 35 ], three distinct multivariate logistic regressions were run to investigate the relationship between TyG and hyperuricemia. While Model 2 and Model 3 adjusted for age, gender, and race, educational level, marital status, RIP, smoking, alcohol consumption, physical activity, BMI, HDL, LDL, HbA1c, serum creatinine, eGFR, hypertension, diabetes, arthritis, stroke, and coronary heart disease, Model 1 left covariates unadjusted. Relationship consistency was verified by a linear trend test, and nonlinear relationships were investigated using a Generalized Additive Model (GAM) with smooth curve fitting. In the presence of nonlinearity, a recursive algorithm identified significant turning points in the TyG and hyperuricemia relationship. Threshold effect analysis assessed differences between logistic regression models and two-part logistic regression models. Additionally, subgroup analyses and interaction tests were performed for age, gender, BMI, hypertension, diabetes, stroke, arthritis, and coronary heart disease, with adjustments for corresponding confounding factors. The results were considered credible if the interaction P -value was not significant; if it was, then likely subgroup variations were considered. EmpowerStats ( http://www.empowerstats.com ) and R (version 4.2.2) were used for all statistical analyses, with a P -value < 0.05 denoting statistical significance.
Baseline characteristics of participants
Table 1 displays the baseline attributes of the individuals in the TyG index. Compared to the lowest TyG quartile, individuals in the TyG Q4 group exhibited a tendency towards older age, male gender, Mexican American ethnicity, lower educational attainment, marital status, non-smoking behavior, lower RIP levels, lower HDL, lower eGFR, and higher prevalence of hypertension, diabetes, coronary heart disease, arthritis, stroke. Additionally, they displayed higher levels of BMI, HbA1c, FPG, TG, LDL, serum creatinine, and uric acid (all P < 0.05). Notably, there was a significantly increased frequency of hyperuricemia ( P < 0.05) in participants with high TyG levels.
Association between TyG and its components and hyperuricemia
Table 2 displays the relationship between TyG and its components and hyperuricemia. After adjusting for potential confounding variables (Model 3), the study found a significant positive correlation between TG and hyperuricemia (OR = 1.68, 95% CI: 1.38, 2.04). Further dividing TG into quartiles, in Model 3, participants in the highest quartile of TG had a 1.95-fold higher risk of hyperuricemia compared to those in the lowest quartile (OR: 2.95, 95% CI: 1.83, 4.75). Additionally, a significant dose-response relationship was found ( P < 0.05). However, after adjusting for potential confounding variables (Model 3), the study did not find a significant association between FPG and hyperuricemia (OR = 1.00, 95% CI: 0.99, 1.01). Further dividing FPG into quartiles, in Model 3, participants in quartile 4 of FPG had a significantly positive correlation with hyperuricemia compared to Q1 (OR = 1.84, 95% CI: 1.14, 2.99). Our study also found a significant dose-response relationship ( P < 0.05). Moreover, the investigation’s findings demonstrated a positive correlation between TyG and the likelihood of hyperuricemia. Variable adjustments bolstered this association, and all multivariate logistic regression models (model 1: OR = 1.70, 95% CI: 1.51,1.91; model 2: OR = 1.69, 95% CI: 1.50,1.92; model 3: OR = 2.34, 95% CI: 1.70,3.21) showed positive correlations regardless of whether confounding variables were adjusted. It’s interesting to note that a unit increase in the TyG index was linked to a 1.34-fold increase in the risk of hyperuricemia after controlling for possible confounding variables (model 3; Table 2 ). When TyG was further split into quartiles using Q1 as the reference group and different variables were taken into account in model 3, the risk of hyperuricemia was 3.85 times higher for those in the highest quartile of the TyG index than for those in the lowest quartile (OR: 4.85, 95% CI: 3.03, 7.78) (Table 2 ). Furthermore, a noteworthy dose-response correlation ( P < 0.05) was noted.
However, the odds ratios (ORs) for Q2, Q3, and Q4 show that there might be a non-linear correlation; the 95% confidence intervals (CIs) for these three questions are 1.54 (0.98, 2.14), 2.17 (1.44, 3.25), and 4.85 (3.03, 7.78), respectively. Using GAM and smooth curve fitting, a non-linear association between TyG and hyperuricemia was found (Fig. 2 ), adding to the validity of the results. Further exploration through threshold effect analysis revealed a turning point at 9.69 (Table 3 ). Before the turning point, TyG and hyperuricemia exhibited a significant positive correlation, with an OR (95% CI) of 2.64 (2.12, 3.28). Subsequently, after the turning point, TyG and hyperuricemia showed a significant negative correlation, with an OR (95% CI) of 0.32 (0.11, 0.98) (Table 3 ). Additionally, after stratification by age and gender, our results also indicate a non-linear relationship between TyG and hyperuricemia (Figs. 3 and 4 ).

Smooth curve fitting for TyG and hyperuricemia. Non-linear relationship between TyG and hyperuricemia was detected by the generalized additive model. The solid red line represents the smooth curve fit between variables. Blue dotted lines represent the 95% CI from the fit. Adjustment factors included age, sex, race, educational level, marital status, smoking status, alcohol consumption, physical activity, BMI, RIP, LDL, HDL, HbA1c, Serum creatinine, eGFR, hypertension, diabetes, arthritis, coronary heart disease and Stroke

The association between TyG and hyperuricemia stratified by gender. Age, race, educational level, marital status, smoking status, alcohol consumption, physical activity, BMI, RIP, LDL, HDL, HbA1c, Serum creatinine, eGFR, hypertension, diabetes, arthritis, coronary heart disease and Stroke were adjusted

The association between TyG and hyperuricemia stratified by age. Gender, race, educational level, marital status, smoking status, alcohol consumption, physical activity, BMI, RIP, LDL, HDL, HbA1c, Serum creatinine, eGFR, hypertension, diabetes, arthritis, coronary heart disease and Stroke were adjusted
To further evaluate the association between TyG and hyperuricemia in various categories, we also conducted interaction tests and stratified analysis accounting for gender, age, BMI, hypertension, diabetes, coronary heart disease, arthritis, and stroke. The positive link between TyG and hyperuricemia does not appear to be influenced by age, arthritis, coronary heart disease, or stroke, according to the results of our study. However, interactions were observed in gender, BMI, diabetes, and hypertension, with particular significance in female, non-obese, non-hypertensive, and non-diabetic populations (OR: 2.98, 95% CI: 2.27, 3.92), (OR: 3.33, 95% CI: 2.56, 4.33), (OR: 2.62, 95% CI: 2.05, 3.35), (OR: 2.92, 95% CI: 2.32, 3.69) (Fig. 5 ). Therefore, we further explored the non-linear relationship between TyG and hyperuricemia through stratification. After stratification by gender, we found that their non-linear relationship still exists (Fig. 3 ). Furthermore, after stratification by BMI, hypertension, and diabetes, we still observed a non-linear association (Supplementary Figs. 1 , 2 and 3 ).

Subgroup and interaction analyses of the TyG index and hyperuricemia. Adjustment factors included age, sex, race, educational level, marital status, smoking status, alcohol consumption, physical activity, BMI, RIP, LDL, HDL, HbA1c, Serum creatinine, eGFR, hypertension, diabetes, arthritis, coronary heart disease and Stroke
Based on NHANES data from 2011 to 2018, our large-sample cross-sectional analysis demonstrates a strong correlation between elevated TyG and a higher risk of hyperuricemia. Even when categorizing the TyG into quartiles (Q1-Q4), this positive correlation persists. In the adult population in the United States, we found a non-linear association between hyperuricemia and the TyG index after applying a smooth curve. There is a segmented inhibitory effect between the TyG index and hyperuricemia, with 9.69 as a significant inflection point. Before this point, a significant increase in hyperuricemia risk was reported with the increasing TyG, and after this point, a significant decrease in hyperuricemia risk was observed with increasing TyG index. Additionally, our study presents the most detailed stratified analysis.
The TyG index and hyperuricemia had a linear positive connection, according to a prior cross-sectional study from northeastern China, with a 54.1% rise in the probability of hyperuricemia for every unit increase in the TyG [ 25 ]. A cross-sectional study conducted in Thailand also found that among Royal Thai Army members, the TyG index and hyperuricemia had a substantial positive connection that persisted regardless of the soldiers’ obesity condition [ 36 ]. Qing et al. evaluated the relationship between TyG and hyperuricemia in a cohort study involving 42,387 Chinese patients having physical exams. The findings demonstrated a favorable relationship between hyperuricemia and the TyG index [ 37 ]. These studies support our findings. In addition, our research revealed a strong positive association between TyG and hyperuricemia, with each unit rise in TyG associated with a 1.34-fold increase in the risk of hyperuricemia. It was also discovered that interactions occurred regardless of obesity, however in non-obese people this link was stronger.
In addition, after conducting subgroup analyses and interaction tests, our study found that gender, hypertension, and diabetes interacted with the relationship between TyG and hyperuricemia, especially in females, and this association was more pronounced in non-hypertensive and non-diabetic populations. Gender variations have been observed in the TyG index’s ability to detect hyperuricemia in the past, particularly in females [ 38 ], which is consistent with our study results. This may be because estrogen is a uric acid generator and is associated with complex metabolic endocrine factors, thereby affecting lipid metabolism and causing gender differences in lipid metabolism [ 39 ]. In hypertensive people with an average age of 63.81 years, a study in China demonstrated a positive connection between TyG and hyperuricemia (OR = 2.04; 95%CI: 1.87 to 2.24) [ 40 ]. An additional cross-sectional study conducted in Chinese hospitals investigated the relationship between hyperuricemia and TyG in patients with hypertension. TyG and hyperuricemia were shown to positively correlate in hypertensive individuals; this correlation was more pronounced in patients with grade 1–2 hypertension than in those with grade 3 hypertension [ 22 ]. This is consistent with the trend observed in our study. Regardless of the existence of hypertension, we discovered a favorable connection between TyG and hyperuricemia, but this correlation was more pronounced in non-hypertensive individuals. Differences in demographic characteristics and research methods may explain this discrepancy. Further research is needed to uncover these underlying factors. Through a retrospective analysis, Han et al. [ 41 ] discovered a substantial positive connection between TyG and hyperuricemia in patients with diabetes, whereas our study discovered an interaction between TyG and hyperuricemia in patients without diabetes. The observed occurrence could potentially be attributed to variations in the study population, ethnicity, and sample size. More study is required to validate these findings because there is a dearth of information regarding the connection between TyG and hyperuricemia in both diabetic and non-diabetic groups.
The mechanism of TyG in hyperuricemia is not yet clear, but the following biological mechanisms can be explained. Since TyG is computed by summing up TG and FPG, there is a strong correlation between the pathophysiology of hyperuricemia and TG and FPG levels in the human body. Abnormalities in lipid metabolism result from the breakdown of elevated quantities of TG into free fatty acids, which are then transferred to different parts of the body and speed up the breakdown of adenosine triphosphate. Lipid metabolism abnormalities cause kidney damage, reduce uric acid excretion, and consequently increase serum uric acid levels [ 42 ]. Furthermore, high TG levels inhibit insulin receptor activity and quantity on adipocytes, competing with glucose to block insulin’s ability to bind to receptors and cause IR [ 43 ]. Excessive accumulation of glucose leads to hyperglycemia, alters the expression and activity of glucose transporter proteins in tissues, and reduces insulin sensitivity [ 44 , 45 ]. Notably, with an inflection point of 9.69, our study discovered a strong segmental inhibitory effect between TyG and hyperuricemia. TyG and hyperuricemia had a substantial positive correlation up to 9.69, whereas a significant negative correlation followed after 9.69. This differs from the results reported in previous studies, and one possible reason is speculated to be racial differences. Previous correlation studies have mainly focused on Asian countries such as China and Thailand, and racial differences have been shown to affect insulin sensitivity [ 46 ]. Also differences in demographic characteristics and research methods may be potential factors. To sum up, additional pertinent research is required to validate our findings, particularly in the US population.
There are various restrictions on this study. First off, because the study is cross-sectional, we are unable to determine if TyG and hyperuricemia are causally related. The conclusions reached must be supported by further research. Second, although we included many relevant covariates and adjusted accordingly, there may still be interference from other confounding factors, such as hyperthyroidism, alcoholism, renal insufficiency, drugs, tumors, and other factors that affect uric acid levels. To substantiate the connection between hyperuricemia and the TyG index, more intervention studies ought to be carried out. Additionally, serum uric acid levels are influenced by diets rich in purines, and the data on dietary questionnaires in NHANES are very limited, so we cannot determine whether participants have a high-purine diet.
In general, hyperuricemia and the TyG index have a reverse U-shaped connection. In patients with TyG < 9.69, a higher risk of hyperuricemia is significantly correlated with a greater TyG. On the other hand, a higher TyG is substantially linked to a decreased risk of hyperuricemia in patients with TyG > 9.69. These results imply that the prevention and treatment of hyperuricemia may benefit from reducing or raising TyG levels within a specific range. Confirming the causal relationship and underlying mechanisms between them will require more investigation.
Data availability
Data is provided within the supplementary information files.
Smith E, Hoy D, Cross M, Merriman TR, Vos T, Buchbinder R, Woolf A, March L. The global burden of gout: estimates from the global burden of Disease 2010 study. Ann Rheum Dis. 2014;73:1470–6.
Article PubMed Google Scholar
Zhu Y, Pandya BJ, Choi HK. Comorbidities of gout and hyperuricemia in the US general population: NHANES 2007–2008. Am J Med. 2012;125:679–e687671.
Fang XY, Qi LW, Chen HF, Gao P, Zhang Q, Leng RX, Fan YG, Li BZ, Pan HF, Ye DQ. The Interaction between Dietary Fructose and Gut Microbiota in Hyperuricemia and gout. Front Nutr. 2022;9:890730.
Article PubMed PubMed Central Google Scholar
Kim Y, Kang J, Kim GT. Prevalence of hyperuricemia and its associated factors in the general Korean population: an analysis of a population-based nationally representative sample. Clin Rheumatol. 2018;37:2529–38.
Piao W, Zhao L, Yang Y, Fang H, Ju L, Cai S, Yu D. The prevalence of Hyperuricemia and its correlates among adults in China: results from CNHS 2015–2017. Nutrients 2022, 14.
Chen-Xu M, Yokose C, Rai SK, Pillinger MH, Choi HK. Contemporary prevalence of gout and Hyperuricemia in the United States and Decadal trends: the National Health and Nutrition Examination Survey, 2007–2016. Arthritis Rheumatol. 2019;71:991–9.
Dalbeth N, Gosling AL, Gaffo A, Abhishek A. Gout Lancet. 2021;397:1843–55.
Article CAS PubMed Google Scholar
Li C, Hsieh MC, Chang SJ. Metabolic syndrome, diabetes, and hyperuricemia. Curr Opin Rheumatol. 2013;25:210–6.
Nishizawa H, Maeda N, Shimomura I. Impact of hyperuricemia on chronic kidney disease and atherosclerotic cardiovascular disease. Hypertens Res. 2022;45:635–40.
Ruilope LM. Antihypertensives in people with gout or asymptomatic hyperuricaemia. BMJ. 2012;344:d7961.
Facchini F, Chen YD, Hollenbeck CB, Reaven GM. Relationship between resistance to insulin-mediated glucose uptake, urinary uric acid clearance, and plasma uric acid concentration. JAMA. 1991;266:3008–11.
Meshkani R, Zargari M, Larijani B. The relationship between uric acid and metabolic syndrome in normal glucose tolerance and normal fasting glucose subjects. Acta Diabetol. 2011;48:79–88.
Yanai H, Adachi H, Hakoshima M, Katsuyama H. Molecular Biological and Clinical understanding of the pathophysiology and treatments of Hyperuricemia and its Association with Metabolic Syndrome, Cardiovascular diseases and chronic kidney disease. Int J Mol Sci 2021, 22.
McCormick N, O’Connor MJ, Yokose C, Merriman TR, Mount DB, Leong A, Choi HK. Assessing the Causal relationships between insulin resistance and hyperuricemia and gout using bidirectional mendelian randomization. Arthritis Rheumatol. 2021;73:2096–104.
Article CAS PubMed PubMed Central Google Scholar
Toyoki D, Shibata S, Kuribayashi-Okuma E, Xu N, Ishizawa K, Hosoyamada M, Uchida S. Insulin stimulates uric acid reabsorption via regulating urate transporter 1 and ATP-binding cassette subfamily G member 2. Am J Physiol Ren Physiol. 2017;313:F826–34.
Article CAS Google Scholar
Han Y, Zhou Z, Zhang Y, Zhao G, Xu B. The Association of Surrogates of Insulin Resistance with Hyperuricemia among Middle-Aged and Older Individuals: A Population-Based Nationwide Cohort Study. Nutrients 2023, 15.
Simental-Mendía LE, Rodríguez-Morán M, Guerrero-Romero F. The product of fasting glucose and triglycerides as surrogate for identifying insulin resistance in apparently healthy subjects. Metab Syndr Relat Disord. 2008;6:299–304.
Navarro-González D, Sánchez-Íñigo L, Pastrana-Delgado J, Fernández-Montero A, Martinez JA. Triglyceride-glucose index (TyG index) in comparison with fasting plasma glucose improved diabetes prediction in patients with normal fasting glucose: the vascular-metabolic CUN cohort. Prev Med. 2016;86:99–105.
Sánchez-Íñigo L, Navarro-González D, Fernández-Montero A, Pastrana-Delgado J, Martínez JA. The TyG index may predict the development of cardiovascular events. Eur J Clin Invest. 2016;46:189–97.
Zheng R, Mao Y. Triglyceride and glucose (TyG) index as a predictor of incident hypertension: a 9-year longitudinal population-based study. Lipids Health Dis. 2017;16:175.
Li Q, Shao X, Zhou S, Cui Z, Liu H, Wang T, Fan X, Yu P. Triglyceride-glucose index is significantly associated with the risk of hyperuricemia in patients with diabetic kidney disease. Sci Rep. 2022;12:19988.
Liu S, Zhou Z, Wu M, Zhang H, Xiao Y. Association between the Triglyceride Glucose Index and Hyperuricemia in Patients with Primary Hypertension: A Cross-Sectional Study. Int J Endocrinol 2023, 2023:5582306.
Qi J, Ren X, Hou Y, Zhang Y, Zhang Y, Tan E, Wang L. Triglyceride-glucose index is significantly Associated with the risk of Hyperuricemia in patients with nonalcoholic fatty liver disease. Diabetes Metab Syndr Obes. 2023;16:1323–34.
Li Y, You A, Tomlinson B, Yue L, Zhao K, Fan H, Zheng L. Insulin resistance surrogates predict hypertension plus hyperuricemia. J Diabetes Investig. 2021;12:2046–53.
Shi W, Xing L, Jing L, Tian Y, Liu S. Usefulness of triglyceride-glucose index for estimating Hyperuricemia risk: insights from a general Population. Postgrad Med. 2019;131:348–56.
Wang H, Zhang J, Pu Y, Qin S, Liu H, Tian Y, Tang Z. Comparison of different insulin resistance surrogates to predict hyperuricemia among U.S. non-diabetic adults. Front Endocrinol (Lausanne). 2022;13:1028167.
Ahluwalia N, Dwyer J, Terry A, Moshfegh A, Johnson C. Update on NHANES Dietary Data: Focus on Collection, Release, Analytical considerations, and uses to inform Public Policy. Adv Nutr. 2016;7:121–34.
Zou Q, Wang H, Su C, Du W, Ouyang Y, Jia X, Wang Z, Ding G, Zhang B. Longitudinal association between physical activity and blood pressure, risk of hypertension among Chinese adults: China Health and Nutrition Survey 1991–2015. Eur J Clin Nutr. 2021;75:274–82.
Guerrero-Romero F, Simental-Mendía LE, González-Ortiz M, Martínez-Abundis E, Ramos-Zavala MG, Hernández-González SO, Jacques-Camarena O, Rodríguez-Morán M. The product of triglycerides and glucose, a simple measure of insulin sensitivity. Comparison with the euglycemic-hyperinsulinemic clamp. J Clin Endocrinol Metab. 2010;95:3347–51.
de Oliveira EP, Burini RC. High plasma uric acid concentration: causes and consequences. Diabetol Metab Syndr. 2012;4:12.
Qi X, Wang S, Huang Q, Chen X, Qiu L, Ouyang K, Chen Y. The association between non-high-density lipoprotein cholesterol to high-density lipoprotein cholesterol ratio (NHHR) and risk of depression among US adults: a cross-sectional NHANES study. J Affect Disord. 2024;344:451–7.
Gong R, Luo G, Wang M, Ma L, Sun S, Wei X. Associations between TG/HDL ratio and insulin resistance in the US population: a cross-sectional study. Endocr Connect. 2021;10:1502–12.
Piercy KL, Troiano RP, Ballard RM, Carlson SA, Fulton JE, Galuska DA, George SM, Olson RD. The physical activity guidelines for americans. JAMA. 2018;320:2020–8.
Levey AS, Stevens LA, Schmid CH, Zhang YL, Castro AF 3rd, Feldman HI, Kusek JW, Eggers P, Van Lente F, Greene T, Coresh J. A new equation to estimate glomerular filtration rate. Ann Intern Med. 2009;150:604–12.
Vandenbroucke JP, von Elm E, Altman DG, Gøtzsche PC, Mulrow CD, Pocock SJ, Poole C, Schlesselman JJ, Egger M. Strengthening the reporting of Observational studies in Epidemiology (STROBE): explanation and elaboration. PLoS Med. 2007;4:e297.
Lertsakulbunlue S, Sangkool T, Bhuriveth V, Mungthin M, Rangsin R, Kantiwong A, Sakboonyarat B. Associations of triglyceride-glucose index with hyperuricemia among Royal Thai Army personnel. BMC Endocr Disord. 2024;24:17.
Gu Q, Hu X, Meng J, Ge J, Wang SJ, Liu XZ. Associations of Triglyceride-Glucose Index and Its Derivatives with Hyperuricemia Risk: A Cohort Study in Chinese General Population. Int J Endocrinol 2020, 2020:3214716.
Kahaer M, Zhang B, Chen W, Liang M, He Y, Chen M, Li R, Tian T, Hu C, Sun Y. Triglyceride glucose index is more closely related to Hyperuricemia Than obesity indices in the Medical Checkup Population in Xinjiang, China. Front Endocrinol (Lausanne). 2022;13:861760.
Lakoski SG, Herrington DM. Effects of oestrogen receptor-active compounds on lipid metabolism. Diabetes Obes Metab. 2005;7:471–7.
Yu C, Wang T, Zhou W, Zhu L, Huang X, Bao H, Cheng X. Positive Association between the Triglyceride-Glucose Index and Hyperuricemia in Chinese Adults with Hypertension: An Insight from the China H-Type Hypertension Registry Study. Int J Endocrinol 2022, 2022:4272715.
Han R, Zhang Y, Jiang X. Relationship between four non-insulin-based indexes of insulin resistance and serum uric acid in patients with type 2 diabetes: a cross-sectional study. Diabetes Metab Syndr Obes. 2022;15:1461–71.
Cui N, Cui J, Sun J, Xu X, Aslam B, Bai L, Li D, Wu D, Ma Z, Gu H, Baloch Z. Triglycerides and Total Cholesterol Concentrations in Association with Hyperuricemia in Chinese adults in Qingdao, China. Risk Manag Healthc Policy. 2020;13:165–73.
Goodpaster BH, Kelley DE. Skeletal muscle triglyceride: marker or mediator of obesity-induced insulin resistance in type 2 diabetes mellitus? Curr Diab Rep. 2002;2:216–22.
Hoy AJ, Bruce CR, Cederberg A, Turner N, James DE, Cooney GJ, Kraegen EW. Glucose infusion causes insulin resistance in skeletal muscle of rats without changes in Akt and AS160 phosphorylation. Am J Physiol Endocrinol Metab. 2007;293:E1358–1364.
Shannon C, Merovci A, Xiong J, Tripathy D, Lorenzo F, McClain D, Abdul-Ghani M, Norton L, DeFronzo RA. Effect of chronic hyperglycemia on glucose metabolism in subjects with normal glucose tolerance. Diabetes. 2018;67:2507–17.
DeLany JP, Dubé JJ, Standley RA, Distefano G, Goodpaster BH, Stefanovic-Racic M, Coen PM, Toledo FG. Racial differences in peripheral insulin sensitivity and mitochondrial capacity in the absence of obesity. J Clin Endocrinol Metab. 2014;99:4307–14.
Download references
Acknowledgements
The authors thank all team members and participants in the NHANES study.
This study was funded by the Science and Technology Innovation Project of the Chinese Academy of Traditional Chinese Medicine (CI2021A03005).
Author information
Linjie Qiu, Yan Ren and Jixin Li contributed equally to this work.
Authors and Affiliations
Xiyuan Hospital, China Academy of Chinese Medical Sciences, Beijing, China
Linjie Qiu, Yan Ren, Jixin Li, Meijie Li, Lingli Qin, Chunhui Ning, Jin Zhang & Feng Gao
Shanxi University of Chinese Medicine, Taiyuan, Shanxi, China
You can also search for this author in PubMed Google Scholar
Contributions
LQ, YR, JZ, and FG drafted the manuscript and made substantial contributions to its conception and design. JL, ML and WL extracted the data used for the study from the NHANES official website, while LQ and CN were responsible for the production of photographs and tables for this study. LQ, YR, JZ, and FG were responsible for data analysis and interpretation of the results for this research. All authors have thoroughly reviewed and approved the final manuscript.
Corresponding authors
Correspondence to Jin Zhang or Feng Gao .
Ethics declarations
Ethics statement.
In 2003, the NHANES Institutional Review Board (IRB) changed its name to the NCHS Research Ethics Review Board (ERB). In 2018, the name was changed from NCHS Research Ethics Review Board to NCHS Ethics Review Board. The studies were conducted in accordance with the local legislation and institutional requirements. The participants provided their written informed consent to participate in this study.
Conflict of interest
The authors declare that the research was conducted in the absence of any commercial or financial relationships that could be construed as a potential conflict of interest.
Additional information
Publisher’s note.
Springer Nature remains neutral with regard to jurisdictional claims in published maps and institutional affiliations.
Electronic supplementary material
Below is the link to the electronic supplementary material.
Supplementary Material 1

Supplementary Material 2

Supplementary Material 3

Supplementary Material 4
Rights and permissions.
Open Access This article is licensed under a Creative Commons Attribution 4.0 International License, which permits use, sharing, adaptation, distribution and reproduction in any medium or format, as long as you give appropriate credit to the original author(s) and the source, provide a link to the Creative Commons licence, and indicate if changes were made. The images or other third party material in this article are included in the article’s Creative Commons licence, unless indicated otherwise in a credit line to the material. If material is not included in the article’s Creative Commons licence and your intended use is not permitted by statutory regulation or exceeds the permitted use, you will need to obtain permission directly from the copyright holder. To view a copy of this licence, visit http://creativecommons.org/licenses/by/4.0/ . The Creative Commons Public Domain Dedication waiver ( http://creativecommons.org/publicdomain/zero/1.0/ ) applies to the data made available in this article, unless otherwise stated in a credit line to the data.
Reprints and permissions
About this article
Cite this article.
Qiu, L., Ren, Y., Li, J. et al. Nonlinear association of triglyceride-glucose index with hyperuricemia in US adults: a cross-sectional study. Lipids Health Dis 23 , 145 (2024). https://doi.org/10.1186/s12944-024-02146-5
Download citation
Received : 01 April 2024
Accepted : 13 May 2024
Published : 17 May 2024
DOI : https://doi.org/10.1186/s12944-024-02146-5
Share this article
Anyone you share the following link with will be able to read this content:
Sorry, a shareable link is not currently available for this article.
Provided by the Springer Nature SharedIt content-sharing initiative
- Triglyceride-glucose index
- Hyperuricemia
- Cross-sectional study
Lipids in Health and Disease
ISSN: 1476-511X
- General enquiries: [email protected]

An official website of the United States government
The .gov means it’s official. Federal government websites often end in .gov or .mil. Before sharing sensitive information, make sure you’re on a federal government site.
The site is secure. The https:// ensures that you are connecting to the official website and that any information you provide is encrypted and transmitted securely.
- Publications
- Account settings
Preview improvements coming to the PMC website in October 2024. Learn More or Try it out now .
- Advanced Search
- Journal List
- J Korean Med Sci
- v.37(16); 2022 Apr 25
A Practical Guide to Writing Quantitative and Qualitative Research Questions and Hypotheses in Scholarly Articles
Edward barroga.
1 Department of General Education, Graduate School of Nursing Science, St. Luke’s International University, Tokyo, Japan.
Glafera Janet Matanguihan
2 Department of Biological Sciences, Messiah University, Mechanicsburg, PA, USA.
The development of research questions and the subsequent hypotheses are prerequisites to defining the main research purpose and specific objectives of a study. Consequently, these objectives determine the study design and research outcome. The development of research questions is a process based on knowledge of current trends, cutting-edge studies, and technological advances in the research field. Excellent research questions are focused and require a comprehensive literature search and in-depth understanding of the problem being investigated. Initially, research questions may be written as descriptive questions which could be developed into inferential questions. These questions must be specific and concise to provide a clear foundation for developing hypotheses. Hypotheses are more formal predictions about the research outcomes. These specify the possible results that may or may not be expected regarding the relationship between groups. Thus, research questions and hypotheses clarify the main purpose and specific objectives of the study, which in turn dictate the design of the study, its direction, and outcome. Studies developed from good research questions and hypotheses will have trustworthy outcomes with wide-ranging social and health implications.
INTRODUCTION
Scientific research is usually initiated by posing evidenced-based research questions which are then explicitly restated as hypotheses. 1 , 2 The hypotheses provide directions to guide the study, solutions, explanations, and expected results. 3 , 4 Both research questions and hypotheses are essentially formulated based on conventional theories and real-world processes, which allow the inception of novel studies and the ethical testing of ideas. 5 , 6
It is crucial to have knowledge of both quantitative and qualitative research 2 as both types of research involve writing research questions and hypotheses. 7 However, these crucial elements of research are sometimes overlooked; if not overlooked, then framed without the forethought and meticulous attention it needs. Planning and careful consideration are needed when developing quantitative or qualitative research, particularly when conceptualizing research questions and hypotheses. 4
There is a continuing need to support researchers in the creation of innovative research questions and hypotheses, as well as for journal articles that carefully review these elements. 1 When research questions and hypotheses are not carefully thought of, unethical studies and poor outcomes usually ensue. Carefully formulated research questions and hypotheses define well-founded objectives, which in turn determine the appropriate design, course, and outcome of the study. This article then aims to discuss in detail the various aspects of crafting research questions and hypotheses, with the goal of guiding researchers as they develop their own. Examples from the authors and peer-reviewed scientific articles in the healthcare field are provided to illustrate key points.
DEFINITIONS AND RELATIONSHIP OF RESEARCH QUESTIONS AND HYPOTHESES
A research question is what a study aims to answer after data analysis and interpretation. The answer is written in length in the discussion section of the paper. Thus, the research question gives a preview of the different parts and variables of the study meant to address the problem posed in the research question. 1 An excellent research question clarifies the research writing while facilitating understanding of the research topic, objective, scope, and limitations of the study. 5
On the other hand, a research hypothesis is an educated statement of an expected outcome. This statement is based on background research and current knowledge. 8 , 9 The research hypothesis makes a specific prediction about a new phenomenon 10 or a formal statement on the expected relationship between an independent variable and a dependent variable. 3 , 11 It provides a tentative answer to the research question to be tested or explored. 4
Hypotheses employ reasoning to predict a theory-based outcome. 10 These can also be developed from theories by focusing on components of theories that have not yet been observed. 10 The validity of hypotheses is often based on the testability of the prediction made in a reproducible experiment. 8
Conversely, hypotheses can also be rephrased as research questions. Several hypotheses based on existing theories and knowledge may be needed to answer a research question. Developing ethical research questions and hypotheses creates a research design that has logical relationships among variables. These relationships serve as a solid foundation for the conduct of the study. 4 , 11 Haphazardly constructed research questions can result in poorly formulated hypotheses and improper study designs, leading to unreliable results. Thus, the formulations of relevant research questions and verifiable hypotheses are crucial when beginning research. 12
CHARACTERISTICS OF GOOD RESEARCH QUESTIONS AND HYPOTHESES
Excellent research questions are specific and focused. These integrate collective data and observations to confirm or refute the subsequent hypotheses. Well-constructed hypotheses are based on previous reports and verify the research context. These are realistic, in-depth, sufficiently complex, and reproducible. More importantly, these hypotheses can be addressed and tested. 13
There are several characteristics of well-developed hypotheses. Good hypotheses are 1) empirically testable 7 , 10 , 11 , 13 ; 2) backed by preliminary evidence 9 ; 3) testable by ethical research 7 , 9 ; 4) based on original ideas 9 ; 5) have evidenced-based logical reasoning 10 ; and 6) can be predicted. 11 Good hypotheses can infer ethical and positive implications, indicating the presence of a relationship or effect relevant to the research theme. 7 , 11 These are initially developed from a general theory and branch into specific hypotheses by deductive reasoning. In the absence of a theory to base the hypotheses, inductive reasoning based on specific observations or findings form more general hypotheses. 10
TYPES OF RESEARCH QUESTIONS AND HYPOTHESES
Research questions and hypotheses are developed according to the type of research, which can be broadly classified into quantitative and qualitative research. We provide a summary of the types of research questions and hypotheses under quantitative and qualitative research categories in Table 1 .
Research questions in quantitative research
In quantitative research, research questions inquire about the relationships among variables being investigated and are usually framed at the start of the study. These are precise and typically linked to the subject population, dependent and independent variables, and research design. 1 Research questions may also attempt to describe the behavior of a population in relation to one or more variables, or describe the characteristics of variables to be measured ( descriptive research questions ). 1 , 5 , 14 These questions may also aim to discover differences between groups within the context of an outcome variable ( comparative research questions ), 1 , 5 , 14 or elucidate trends and interactions among variables ( relationship research questions ). 1 , 5 We provide examples of descriptive, comparative, and relationship research questions in quantitative research in Table 2 .
Hypotheses in quantitative research
In quantitative research, hypotheses predict the expected relationships among variables. 15 Relationships among variables that can be predicted include 1) between a single dependent variable and a single independent variable ( simple hypothesis ) or 2) between two or more independent and dependent variables ( complex hypothesis ). 4 , 11 Hypotheses may also specify the expected direction to be followed and imply an intellectual commitment to a particular outcome ( directional hypothesis ) 4 . On the other hand, hypotheses may not predict the exact direction and are used in the absence of a theory, or when findings contradict previous studies ( non-directional hypothesis ). 4 In addition, hypotheses can 1) define interdependency between variables ( associative hypothesis ), 4 2) propose an effect on the dependent variable from manipulation of the independent variable ( causal hypothesis ), 4 3) state a negative relationship between two variables ( null hypothesis ), 4 , 11 , 15 4) replace the working hypothesis if rejected ( alternative hypothesis ), 15 explain the relationship of phenomena to possibly generate a theory ( working hypothesis ), 11 5) involve quantifiable variables that can be tested statistically ( statistical hypothesis ), 11 6) or express a relationship whose interlinks can be verified logically ( logical hypothesis ). 11 We provide examples of simple, complex, directional, non-directional, associative, causal, null, alternative, working, statistical, and logical hypotheses in quantitative research, as well as the definition of quantitative hypothesis-testing research in Table 3 .
Research questions in qualitative research
Unlike research questions in quantitative research, research questions in qualitative research are usually continuously reviewed and reformulated. The central question and associated subquestions are stated more than the hypotheses. 15 The central question broadly explores a complex set of factors surrounding the central phenomenon, aiming to present the varied perspectives of participants. 15
There are varied goals for which qualitative research questions are developed. These questions can function in several ways, such as to 1) identify and describe existing conditions ( contextual research question s); 2) describe a phenomenon ( descriptive research questions ); 3) assess the effectiveness of existing methods, protocols, theories, or procedures ( evaluation research questions ); 4) examine a phenomenon or analyze the reasons or relationships between subjects or phenomena ( explanatory research questions ); or 5) focus on unknown aspects of a particular topic ( exploratory research questions ). 5 In addition, some qualitative research questions provide new ideas for the development of theories and actions ( generative research questions ) or advance specific ideologies of a position ( ideological research questions ). 1 Other qualitative research questions may build on a body of existing literature and become working guidelines ( ethnographic research questions ). Research questions may also be broadly stated without specific reference to the existing literature or a typology of questions ( phenomenological research questions ), may be directed towards generating a theory of some process ( grounded theory questions ), or may address a description of the case and the emerging themes ( qualitative case study questions ). 15 We provide examples of contextual, descriptive, evaluation, explanatory, exploratory, generative, ideological, ethnographic, phenomenological, grounded theory, and qualitative case study research questions in qualitative research in Table 4 , and the definition of qualitative hypothesis-generating research in Table 5 .
Qualitative studies usually pose at least one central research question and several subquestions starting with How or What . These research questions use exploratory verbs such as explore or describe . These also focus on one central phenomenon of interest, and may mention the participants and research site. 15
Hypotheses in qualitative research
Hypotheses in qualitative research are stated in the form of a clear statement concerning the problem to be investigated. Unlike in quantitative research where hypotheses are usually developed to be tested, qualitative research can lead to both hypothesis-testing and hypothesis-generating outcomes. 2 When studies require both quantitative and qualitative research questions, this suggests an integrative process between both research methods wherein a single mixed-methods research question can be developed. 1
FRAMEWORKS FOR DEVELOPING RESEARCH QUESTIONS AND HYPOTHESES
Research questions followed by hypotheses should be developed before the start of the study. 1 , 12 , 14 It is crucial to develop feasible research questions on a topic that is interesting to both the researcher and the scientific community. This can be achieved by a meticulous review of previous and current studies to establish a novel topic. Specific areas are subsequently focused on to generate ethical research questions. The relevance of the research questions is evaluated in terms of clarity of the resulting data, specificity of the methodology, objectivity of the outcome, depth of the research, and impact of the study. 1 , 5 These aspects constitute the FINER criteria (i.e., Feasible, Interesting, Novel, Ethical, and Relevant). 1 Clarity and effectiveness are achieved if research questions meet the FINER criteria. In addition to the FINER criteria, Ratan et al. described focus, complexity, novelty, feasibility, and measurability for evaluating the effectiveness of research questions. 14
The PICOT and PEO frameworks are also used when developing research questions. 1 The following elements are addressed in these frameworks, PICOT: P-population/patients/problem, I-intervention or indicator being studied, C-comparison group, O-outcome of interest, and T-timeframe of the study; PEO: P-population being studied, E-exposure to preexisting conditions, and O-outcome of interest. 1 Research questions are also considered good if these meet the “FINERMAPS” framework: Feasible, Interesting, Novel, Ethical, Relevant, Manageable, Appropriate, Potential value/publishable, and Systematic. 14
As we indicated earlier, research questions and hypotheses that are not carefully formulated result in unethical studies or poor outcomes. To illustrate this, we provide some examples of ambiguous research question and hypotheses that result in unclear and weak research objectives in quantitative research ( Table 6 ) 16 and qualitative research ( Table 7 ) 17 , and how to transform these ambiguous research question(s) and hypothesis(es) into clear and good statements.
a These statements were composed for comparison and illustrative purposes only.
b These statements are direct quotes from Higashihara and Horiuchi. 16
a This statement is a direct quote from Shimoda et al. 17
The other statements were composed for comparison and illustrative purposes only.
CONSTRUCTING RESEARCH QUESTIONS AND HYPOTHESES
To construct effective research questions and hypotheses, it is very important to 1) clarify the background and 2) identify the research problem at the outset of the research, within a specific timeframe. 9 Then, 3) review or conduct preliminary research to collect all available knowledge about the possible research questions by studying theories and previous studies. 18 Afterwards, 4) construct research questions to investigate the research problem. Identify variables to be accessed from the research questions 4 and make operational definitions of constructs from the research problem and questions. Thereafter, 5) construct specific deductive or inductive predictions in the form of hypotheses. 4 Finally, 6) state the study aims . This general flow for constructing effective research questions and hypotheses prior to conducting research is shown in Fig. 1 .

Research questions are used more frequently in qualitative research than objectives or hypotheses. 3 These questions seek to discover, understand, explore or describe experiences by asking “What” or “How.” The questions are open-ended to elicit a description rather than to relate variables or compare groups. The questions are continually reviewed, reformulated, and changed during the qualitative study. 3 Research questions are also used more frequently in survey projects than hypotheses in experiments in quantitative research to compare variables and their relationships.
Hypotheses are constructed based on the variables identified and as an if-then statement, following the template, ‘If a specific action is taken, then a certain outcome is expected.’ At this stage, some ideas regarding expectations from the research to be conducted must be drawn. 18 Then, the variables to be manipulated (independent) and influenced (dependent) are defined. 4 Thereafter, the hypothesis is stated and refined, and reproducible data tailored to the hypothesis are identified, collected, and analyzed. 4 The hypotheses must be testable and specific, 18 and should describe the variables and their relationships, the specific group being studied, and the predicted research outcome. 18 Hypotheses construction involves a testable proposition to be deduced from theory, and independent and dependent variables to be separated and measured separately. 3 Therefore, good hypotheses must be based on good research questions constructed at the start of a study or trial. 12
In summary, research questions are constructed after establishing the background of the study. Hypotheses are then developed based on the research questions. Thus, it is crucial to have excellent research questions to generate superior hypotheses. In turn, these would determine the research objectives and the design of the study, and ultimately, the outcome of the research. 12 Algorithms for building research questions and hypotheses are shown in Fig. 2 for quantitative research and in Fig. 3 for qualitative research.

EXAMPLES OF RESEARCH QUESTIONS FROM PUBLISHED ARTICLES
- EXAMPLE 1. Descriptive research question (quantitative research)
- - Presents research variables to be assessed (distinct phenotypes and subphenotypes)
- “BACKGROUND: Since COVID-19 was identified, its clinical and biological heterogeneity has been recognized. Identifying COVID-19 phenotypes might help guide basic, clinical, and translational research efforts.
- RESEARCH QUESTION: Does the clinical spectrum of patients with COVID-19 contain distinct phenotypes and subphenotypes? ” 19
- EXAMPLE 2. Relationship research question (quantitative research)
- - Shows interactions between dependent variable (static postural control) and independent variable (peripheral visual field loss)
- “Background: Integration of visual, vestibular, and proprioceptive sensations contributes to postural control. People with peripheral visual field loss have serious postural instability. However, the directional specificity of postural stability and sensory reweighting caused by gradual peripheral visual field loss remain unclear.
- Research question: What are the effects of peripheral visual field loss on static postural control ?” 20
- EXAMPLE 3. Comparative research question (quantitative research)
- - Clarifies the difference among groups with an outcome variable (patients enrolled in COMPERA with moderate PH or severe PH in COPD) and another group without the outcome variable (patients with idiopathic pulmonary arterial hypertension (IPAH))
- “BACKGROUND: Pulmonary hypertension (PH) in COPD is a poorly investigated clinical condition.
- RESEARCH QUESTION: Which factors determine the outcome of PH in COPD?
- STUDY DESIGN AND METHODS: We analyzed the characteristics and outcome of patients enrolled in the Comparative, Prospective Registry of Newly Initiated Therapies for Pulmonary Hypertension (COMPERA) with moderate or severe PH in COPD as defined during the 6th PH World Symposium who received medical therapy for PH and compared them with patients with idiopathic pulmonary arterial hypertension (IPAH) .” 21
- EXAMPLE 4. Exploratory research question (qualitative research)
- - Explores areas that have not been fully investigated (perspectives of families and children who receive care in clinic-based child obesity treatment) to have a deeper understanding of the research problem
- “Problem: Interventions for children with obesity lead to only modest improvements in BMI and long-term outcomes, and data are limited on the perspectives of families of children with obesity in clinic-based treatment. This scoping review seeks to answer the question: What is known about the perspectives of families and children who receive care in clinic-based child obesity treatment? This review aims to explore the scope of perspectives reported by families of children with obesity who have received individualized outpatient clinic-based obesity treatment.” 22
- EXAMPLE 5. Relationship research question (quantitative research)
- - Defines interactions between dependent variable (use of ankle strategies) and independent variable (changes in muscle tone)
- “Background: To maintain an upright standing posture against external disturbances, the human body mainly employs two types of postural control strategies: “ankle strategy” and “hip strategy.” While it has been reported that the magnitude of the disturbance alters the use of postural control strategies, it has not been elucidated how the level of muscle tone, one of the crucial parameters of bodily function, determines the use of each strategy. We have previously confirmed using forward dynamics simulations of human musculoskeletal models that an increased muscle tone promotes the use of ankle strategies. The objective of the present study was to experimentally evaluate a hypothesis: an increased muscle tone promotes the use of ankle strategies. Research question: Do changes in the muscle tone affect the use of ankle strategies ?” 23
EXAMPLES OF HYPOTHESES IN PUBLISHED ARTICLES
- EXAMPLE 1. Working hypothesis (quantitative research)
- - A hypothesis that is initially accepted for further research to produce a feasible theory
- “As fever may have benefit in shortening the duration of viral illness, it is plausible to hypothesize that the antipyretic efficacy of ibuprofen may be hindering the benefits of a fever response when taken during the early stages of COVID-19 illness .” 24
- “In conclusion, it is plausible to hypothesize that the antipyretic efficacy of ibuprofen may be hindering the benefits of a fever response . The difference in perceived safety of these agents in COVID-19 illness could be related to the more potent efficacy to reduce fever with ibuprofen compared to acetaminophen. Compelling data on the benefit of fever warrant further research and review to determine when to treat or withhold ibuprofen for early stage fever for COVID-19 and other related viral illnesses .” 24
- EXAMPLE 2. Exploratory hypothesis (qualitative research)
- - Explores particular areas deeper to clarify subjective experience and develop a formal hypothesis potentially testable in a future quantitative approach
- “We hypothesized that when thinking about a past experience of help-seeking, a self distancing prompt would cause increased help-seeking intentions and more favorable help-seeking outcome expectations .” 25
- “Conclusion
- Although a priori hypotheses were not supported, further research is warranted as results indicate the potential for using self-distancing approaches to increasing help-seeking among some people with depressive symptomatology.” 25
- EXAMPLE 3. Hypothesis-generating research to establish a framework for hypothesis testing (qualitative research)
- “We hypothesize that compassionate care is beneficial for patients (better outcomes), healthcare systems and payers (lower costs), and healthcare providers (lower burnout). ” 26
- Compassionomics is the branch of knowledge and scientific study of the effects of compassionate healthcare. Our main hypotheses are that compassionate healthcare is beneficial for (1) patients, by improving clinical outcomes, (2) healthcare systems and payers, by supporting financial sustainability, and (3) HCPs, by lowering burnout and promoting resilience and well-being. The purpose of this paper is to establish a scientific framework for testing the hypotheses above . If these hypotheses are confirmed through rigorous research, compassionomics will belong in the science of evidence-based medicine, with major implications for all healthcare domains.” 26
- EXAMPLE 4. Statistical hypothesis (quantitative research)
- - An assumption is made about the relationship among several population characteristics ( gender differences in sociodemographic and clinical characteristics of adults with ADHD ). Validity is tested by statistical experiment or analysis ( chi-square test, Students t-test, and logistic regression analysis)
- “Our research investigated gender differences in sociodemographic and clinical characteristics of adults with ADHD in a Japanese clinical sample. Due to unique Japanese cultural ideals and expectations of women's behavior that are in opposition to ADHD symptoms, we hypothesized that women with ADHD experience more difficulties and present more dysfunctions than men . We tested the following hypotheses: first, women with ADHD have more comorbidities than men with ADHD; second, women with ADHD experience more social hardships than men, such as having less full-time employment and being more likely to be divorced.” 27
- “Statistical Analysis
- ( text omitted ) Between-gender comparisons were made using the chi-squared test for categorical variables and Students t-test for continuous variables…( text omitted ). A logistic regression analysis was performed for employment status, marital status, and comorbidity to evaluate the independent effects of gender on these dependent variables.” 27
EXAMPLES OF HYPOTHESIS AS WRITTEN IN PUBLISHED ARTICLES IN RELATION TO OTHER PARTS
- EXAMPLE 1. Background, hypotheses, and aims are provided
- “Pregnant women need skilled care during pregnancy and childbirth, but that skilled care is often delayed in some countries …( text omitted ). The focused antenatal care (FANC) model of WHO recommends that nurses provide information or counseling to all pregnant women …( text omitted ). Job aids are visual support materials that provide the right kind of information using graphics and words in a simple and yet effective manner. When nurses are not highly trained or have many work details to attend to, these job aids can serve as a content reminder for the nurses and can be used for educating their patients (Jennings, Yebadokpo, Affo, & Agbogbe, 2010) ( text omitted ). Importantly, additional evidence is needed to confirm how job aids can further improve the quality of ANC counseling by health workers in maternal care …( text omitted )” 28
- “ This has led us to hypothesize that the quality of ANC counseling would be better if supported by job aids. Consequently, a better quality of ANC counseling is expected to produce higher levels of awareness concerning the danger signs of pregnancy and a more favorable impression of the caring behavior of nurses .” 28
- “This study aimed to examine the differences in the responses of pregnant women to a job aid-supported intervention during ANC visit in terms of 1) their understanding of the danger signs of pregnancy and 2) their impression of the caring behaviors of nurses to pregnant women in rural Tanzania.” 28
- EXAMPLE 2. Background, hypotheses, and aims are provided
- “We conducted a two-arm randomized controlled trial (RCT) to evaluate and compare changes in salivary cortisol and oxytocin levels of first-time pregnant women between experimental and control groups. The women in the experimental group touched and held an infant for 30 min (experimental intervention protocol), whereas those in the control group watched a DVD movie of an infant (control intervention protocol). The primary outcome was salivary cortisol level and the secondary outcome was salivary oxytocin level.” 29
- “ We hypothesize that at 30 min after touching and holding an infant, the salivary cortisol level will significantly decrease and the salivary oxytocin level will increase in the experimental group compared with the control group .” 29
- EXAMPLE 3. Background, aim, and hypothesis are provided
- “In countries where the maternal mortality ratio remains high, antenatal education to increase Birth Preparedness and Complication Readiness (BPCR) is considered one of the top priorities [1]. BPCR includes birth plans during the antenatal period, such as the birthplace, birth attendant, transportation, health facility for complications, expenses, and birth materials, as well as family coordination to achieve such birth plans. In Tanzania, although increasing, only about half of all pregnant women attend an antenatal clinic more than four times [4]. Moreover, the information provided during antenatal care (ANC) is insufficient. In the resource-poor settings, antenatal group education is a potential approach because of the limited time for individual counseling at antenatal clinics.” 30
- “This study aimed to evaluate an antenatal group education program among pregnant women and their families with respect to birth-preparedness and maternal and infant outcomes in rural villages of Tanzania.” 30
- “ The study hypothesis was if Tanzanian pregnant women and their families received a family-oriented antenatal group education, they would (1) have a higher level of BPCR, (2) attend antenatal clinic four or more times, (3) give birth in a health facility, (4) have less complications of women at birth, and (5) have less complications and deaths of infants than those who did not receive the education .” 30
Research questions and hypotheses are crucial components to any type of research, whether quantitative or qualitative. These questions should be developed at the very beginning of the study. Excellent research questions lead to superior hypotheses, which, like a compass, set the direction of research, and can often determine the successful conduct of the study. Many research studies have floundered because the development of research questions and subsequent hypotheses was not given the thought and meticulous attention needed. The development of research questions and hypotheses is an iterative process based on extensive knowledge of the literature and insightful grasp of the knowledge gap. Focused, concise, and specific research questions provide a strong foundation for constructing hypotheses which serve as formal predictions about the research outcomes. Research questions and hypotheses are crucial elements of research that should not be overlooked. They should be carefully thought of and constructed when planning research. This avoids unethical studies and poor outcomes by defining well-founded objectives that determine the design, course, and outcome of the study.
Disclosure: The authors have no potential conflicts of interest to disclose.
Author Contributions:
- Conceptualization: Barroga E, Matanguihan GJ.
- Methodology: Barroga E, Matanguihan GJ.
- Writing - original draft: Barroga E, Matanguihan GJ.
- Writing - review & editing: Barroga E, Matanguihan GJ.
- Open access
- Published: 10 May 2024
Mitochondrial DNA in bronchoalveolar lavage fluid is associated with the prognosis of idiopathic pulmonary fibrosis: a single cohort study
- Jun Fukihara 1 , 2 ,
- Koji Sakamoto 2 ,
- Yoshiki Ikeyama 2 ,
- Taiki Furukawa 3 ,
- Ryo Teramachi 2 ,
- Kensuke Kataoka 1 ,
- Yasuhiro Kondoh 1 ,
- Naozumi Hashimoto 4 &
- Makoto Ishii 2
Respiratory Research volume 25 , Article number: 202 ( 2024 ) Cite this article
177 Accesses
Metrics details
Extracellular mitochondrial DNA (mtDNA) is released from damaged cells and increases in the serum and bronchoalveolar lavage fluid (BALF) of idiopathic pulmonary fibrosis (IPF) patients. While increased levels of serum mtDNA have been reported to be linked to disease progression and the future development of acute exacerbation (AE) of IPF (AE-IPF), the clinical significance of mtDNA in BALF (BALF-mtDNA) remains unclear. We investigated the relationships between BALF-mtDNA levels and other clinical variables and prognosis in IPF.
Extracellular mtDNA levels in BALF samples collected from IPF patients were determined using droplet-digital PCR. Levels of extracellular nucleolar DNA in BALF (BALF-nucDNA) were also determined as a marker for simple cell collapse. Patient characteristics and survival information were retrospectively reviewed.
mtDNA levels in serum and BALF did not correlate with each other. In 27 patients with paired BALF samples obtained in a stable state and at the time of AE diagnosis, BALF-mtDNA levels were significantly increased at the time of AE. Elevated BALF-mtDNA levels were associated with inflammation or disordered pulmonary function in a stable state ( n = 90), while being associated with age and BALF-neutrophils at the time of AE ( n = 38). BALF-mtDNA ≥ 4234.3 copies/µL in a stable state (median survival time (MST): 42.4 vs. 79.6 months, p < 0.001) and ≥ 11,194.3 copies/µL at the time of AE (MST: 2.6 vs. 20.0 months, p = 0.03) were associated with shorter survival after BALF collection, even after adjusting for other known prognostic factors. On the other hand, BALF-nucDNA showed different trends in correlation with other clinical variables and did not show any significant association with survival time.
Conclusions
Elevated BALF-mtDNA was associated with a poor prognosis in both IPF and AE-IPF. Of note, at the time of AE, it sharply distinguished survivors from non-survivors. Given the trends shown by analyses for BALF-nucDNA, the elevation of BALF-mtDNA might not simply reflect the impact of cell collapse. Further studies are required to explore the underlying mechanisms and clinical applications of BALF-mtDNA in IPF.
Introduction
Idiopathic pulmonary fibrosis (IPF) is a chronic, progressive, and fibrotic lung disease with a median survival time (MST) of 3–5 years [ 1 ]. Acute exacerbation (AE) is a devastating complication of IPF with an MST of only 3 months [ 2 ]. Although some profibrotic growth factors, cytokines, and chemokines have been identified as contributing to the disease, its pathogenesis remains not fully understood. Given the poor prognosis of patients with IPF and AE-IPF, it is crucial to gain a thorough understanding of their pathogenesis and identify clinically important biomarkers.
Extracellular mitochondrial DNA (mtDNA) is one of the danger-associated molecular pattern molecules (DAMPs) released from stressed cells, binds to pathogen recognition receptors, activates immune systems, and induces an inflammatory response. In IPF, mitochondrial dysfunction and metabolic changes induced by the profibrotic stimuli and mechanical cues are assumed to trigger the release of mtDNA from lung cells such as fibroblasts [ 3 ]. and alveolar epithelial cells [ 4 ]. In accordance with this, mtDNA levels are elevated in both serum [ 3 , 4 , 5 , 6 , 7 ] and bronchoalveolar lavage fluid (BALF) [ 3 , 4 ] in IPF patients. While serum mtDNA levels are associated with survival time [ 3 , 7 ], disease severity or progression [ 4 , 5 , 7 ], and the occurrence of AE [ 6 ], the clinical significance of mtDNA in BALF (BALF-mtDNA) has not been well studied.
In the past 10–20 years, the technique of digital polymerase chain reaction (PCR), a refinement of conventional PCR methods, has become increasingly used for experimental and clinical purposes. Droplet-digital PCR (ddPCR) is one of those novel techniques. This enables precise detection of very small number of targets compared to conventional methods and absolute quantification without need for a standard curve [ 8 , 9 ] using crude clinical samples without the time- and labour-consuming DNA extraction steps [ 10 ].
In this study, we established a protocol for measuring BALF-mtDNA using ddPCR and evaluated its clinical significance in IPF including the value as a possible prognostic biomarker in both stable and AE states.
Study population and data collection
From August 2009 to May 2017, we collected BALF samples from 101 IPF patients who underwent bronchoalveolar lavage (BAL) at Tosei General Hospital. Of those, 90 patients provided BALF samples during a stable state, 38 patients provided at the time of their first AE, and 27 out of them underwent BAL both in a stable state and at the time of AE. A subset of these patients also provided blood samples. During a stable state, 57 out of 90 patients provided blood samples within 3 months before or after undergoing BAL. At the time of the first AE, 36 out of 38 patients provided blood samples at the same time as BAL.
In all patients, the validity of the IPF diagnosis was reconfirmed based on the latest guidelines [ 11 ] through multidisciplinary discussions. The AE diagnosis was also reconfirmed as a clinical event meeting the criteria described in an international report published in 2016 [ 2 ]. The treatment for AE followed a standardised protocol: methylprednisolone pulse therapy (1 g/day for 3 days/week) for two cycles, followed by 1 mg/kg/day of methylprednisolone. The steroid dosage was gradually tapered to 10 mg/day of oral prednisolone within 4–6 weeks after initiating treatment. Cyclosporine or tacrolimus was administered concurrently. Prednisolone and immunosuppressants were continued for at least a few months post-recovery.
Patient characteristics and test results were collected retrospectively from clinical charts. Blood test and pulmonary function test results were recorded within 3 months before BAL for patients in a stable state. Forced vital capacity (FVC) and diffusing capacity of the lung for carbon monoxide (D L CO) were expressed as a percentage of predicted values. To calculate the partial pressure of arterial oxygen (PaO 2 )/fraction of inspiratory oxygen (FiO 2 ), FiO 2 was roughly assumed to be 0.21 + 0.04 × oxygen flow (L/min) when using a nasal cannula, and as 0.60 + 0.10 × (oxygen flow – 6 L/min) when using a non-rebreather mask. For data at the time of AE-IPF, baseline FVC and D L CO had been recorded within 6 months prior to the diagnosis of AE. The final follow-up date of this study was 30th April 2022.
Sample collection
BALF and blood samples were collected from patients who provided informed written consent in accordance with the Declaration of Helsinki. BAL was carried out according to the standardised protocol [ 12 ].
See the Supporting Information for the detail protocol for processing of BALF and blood and subsequent ddPCR.
Statistical analysis
Continuous variables were presented as the median with an interquartile range due to a non-normal distribution, and Wilcoxon signed-rank test and Mann–Whitney’s U test were used for inter-group comparisons, as appropriate. Categorical variables were summarized by number and percentage. Spearman’s rank correlation test was applied to evaluate the correlation between two continuous variables. Benjamini and Hochberg’s method [ 13 ] was used to adjust the false discovery rate for multiple testing.
We measured survival time from the date of BAL to the date of death. Time-dependent receiver operating characteristic (ROC) curve analyses were performed to determine the optimal cut-off values for BALF-mtDNA and BALF- nucDNA to predict survival time and determine the area under the curve (AUC). Cox proportional hazards models were used to evaluate the associations between variables and survival time, adjusting for known demographic factors being associated with survival time.
We used a two-sided test for all statistical analyses and considered p-values < 0.05 as statistically significant. The analyses were conducted with R commander (The R Foundation for Statistical Computing, Vienna, Austria).
Factors correlated with BALF-mtDNA and BALF-nucDNA
Table 1 shows patient characteristics at the time of BAL. Among patients who provided both BALF and serum samples at the same time, we found no significant correlations between mtDNA and nucDNA levels, either in a stable state or at the time of AE (Fig. 1 A, B). Among those who provided BALF samples both in a stable state and at the time of AE, BALF-mtDNA and BALF-nucDNA levels were significantly increased at the time of AE compared to those in a stable state (Fig. 1 C).

Correlation of target genes in BALF with those in serum and the occurrence of AE. A , B Copy numbers of target genes in BALF and serum were not correlated significantly each other either ( A ) in a stable state ( n = 57) or ( B ) at the time of first AE ( n = 36), determined by ddPCR. C mtDNA and nucDNA levels in BALF determined by ddPCR were significantly increased at the time of the first AE compared with those in a stable state ( n = 27). Medians and interquartile ranges for the values of each target were: mtDNA, stable: 5575.7 (4478.6 – 8511.4) vs. AE: 15,441.4 (6467.1 – 29,678.6) copies/µL; nucDNA, stable: 137.1 (79.7 – 201.0) vs. AE: 318.9 (134.1 – 660.0) copies/µL. BALF: bronchoalveolar lavage fluid; mtDNA: mitochondrial DNA; nucDNA: nucleolar DNA, AE acute exacerbation; ddPCR: droplet-digital polymerase chain reaction; ** P < 0.01; **** P < 0.0001
We explored the clinical variables correlated with the levels of BALF-mtDNA and -nucDNA. In a stable state, cigarette smoke exposure (pack-year), D L CO, and PaO 2 /FiO 2 showed a negative correlation with BALF-mtDNA levels, while a positive correlation was observed with serum Krebs von den Lungen-6 (KL-6) levels (Table 2 ). BALF-nucDNA levels were negatively correlated with D L CO, FVC, and PaO 2 /FiO 2 in a stable state, but positively correlated with BALF neutrophil and eosinophil rates, and serum levels of C-reactive protein (CRP), lactate dehydrogenase (LDH), and KL-6 (Table 3 ). On the other hand, at the time of the first AE, BALF-mtDNA levels were positively correlated with BALF neutrophil rates and negatively with age (Table 2 ). However, there were no significant correlations between BALF-nucDNA levels and clinical variables except for serum LDH levels (Table 3 ).
Thus, in a stable state, both BALF-mtDNA and BALF-nucDNA levels were found to be correlated with the degree of lung function impairment and inflammation, whereas cigarette smoking was correlated only with BALF-mtDNA levels. At the time of AE, it showed significant correlation with BALF neutrophils.
BALF-mtDNA and survival of IPF
We investigated the prognostic significance of BALF-mtDNA in comparison with the rates of neutrophils and lymphocytes in BALF, which have been reported as prognostic factors [ 14 , 15 ]. Using time-dependent ROC analyses, we revealed a relatively better prognostic value of BALF-mtDNA than that of the rates of neutrophils or lymphocytes in BALF (Fig. 2 A). A BALF-mtDNA of 4234.3 copies/µL and a BALF-nucDNA of 78.0 copies/µL in a stable state were identified to predict 5-year mortality (Fig. 2 B and Figure S 2 A). After adjusting for age, sex, body mass index (BMI), and baseline FVC and D L CO, BALF-mtDNA ≥ 4234.3 copies/µL in a stable state was significantly correlated with survival time (Fig. 2 C and Table 4 , MST: 79.6 vs. 43.1 months), while BALF-nucDNA ≥ 78.0 copies/µL was not.

Survival prediction by BALF-mtDNA. A ROC curves for BALF-mtDNA, neutrophil rates, and lymphocyte rates for predicting 5-year mortality from a stable state. B Changes in AUC values over time from a stable state for each cutoff value of BALF-mtDNA. C Patients with a higher BALF-mtDNA showed shorter survival time than those with a low BALF-mtDNA in a stable state after adjusting for age, sex, body mass index, and baseline forced vital capacity and diffusing capacity of lung for carbon monoxide (median survival time: 42.4 months in BALF-mtDNA ≥ 4234.3 copies/µL vs. 79.6 months in BALF-mtDNA < 4234.3 copies/µL, p < 0.001). D ROC curves for BALF-mtDNA, neutrophil rates, and lymphocyte rates for predicting 6-month mortality from the time of AE. Since higher lymphocyte rates in BALF at the time of AE tended to be associated with longer survival, the lymphocyte rate values were transformed into negative numbers before conducting the time-dependent ROC analysis. E Changes in AUC values over time from the time of AE for each cutoff value of BALF-mtDNA. F Patients with a higher BALF-mtDNA showed poorer survival times than those with a low BALF-mtDNA at the time of first AE after adjusting for age, sex and partial pressure of arterial oxygen/fraction of inspiratory oxygen (median survival time: 2.6 months in BALF-mtDNA ≥ 11,194.3 copies/µL vs. 20.0 months in BALF-mtDNA < 11,194.3 copies/µL, p = 0.03). Baseline FVC and D L CO data were recorded within 6 months prior to the AE. AUC: area under the curve; 95%CI: 95% confidence interval; mtDNA: mitochondrial DNA; Neu: neutrophils; Lym: lymphocytes; ROC: receiver operating characteristic
BALF-mtDNA and survival from AE-IPF
Because there is no firm predictor for survival of AE-IPF to date, we conducted further analyses to evaluate correlation of BALF-mtDNA at the time of AE-IPF diagnosis with the prognosis. Time-dependent ROC analyses revealed a relatively better prognostic value of BALF-mtDNA than that of the rates of neutrophils or lymphocytes in BALF (Fig. 2 D). A BALF-mtDNA level of 11,194.3 copies/µL and a BALF-nucDNA level of 602.6 copies/µL at the time of AE were identified as optimal cut-off values to predict 6-month mortality (Fig. 2 E and Figure S 2 B). BALF-mtDNA ≥ 11,194.3 copies/µL at the time of AE was significantly correlated with survival time after the diagnosis of AE, even after adjusting for age, sex, and PaO 2 /FiO 2 (Fig. 2 F and Table 4 , MST: 30.3 vs. 2.3 months). The results were similar when using BMI, serum CRP levels, or FVC and D L CO values recorded within 6 months before the diagnosis of AE, as adjusting variables instead of PaO 2 /FiO 2 (Table 4 ). It should be noted that this cut-off value sharply distinguished survivors from non-survivors. Other variables such as BALF-nucDNA, BALF neutrophil ratios, PaO 2 /FiO 2 , and serum biomarkers shown in Table 2 , did not show a significant correlation with survival time. Serum-mtDNA in BALF collected at the time of AE, which did not correlate with BALF-mtDNA, also did not show a correlation with survival time (see the Results in the Supporting Information).
Our study revealed relationships between BALF-mtDNA and lung function, smoking status, inflammatory cells in BALF, and prognosis in patients with IPF. Intriguingly, the results suggested that increased BALF-mtDNA can be a potential indicator of poor prognosis for IPF, being associated with survival time in both stable and acute phases. In particular, it clearly distinguished survivors from non-survivors in patients with AE-IPF in our cohort. Meanwhile, BALF-nucDNA did not show prognostic value in either phase. This is the first study to demonstrate the clinical significance of BALF-mtDNA on IPF, which was measured precisely using ddPCR.
mtDNA is known as a DAMP that triggers inflammatory responses via pathogen recognition receptors, such as Toll-like receptor-9 [ 16 ]. It can be released outside mitochondria through various mechanisms, including cell death and other mechanisms unrelated to cell death (active release), such as mtDNA damage and oxidative stress caused by reactive oxygen species [ 17 , 18 , 19 ]. In the field of IPF, several studies have evaluated the prognostic impact of plasma/serum-mtDNA. Extracellular mtDNA was elevated in plasma or serum from IPF patients, and was associated with shorter survival [ 3 , 7 ], disease progression [ 3 , 5 , 7 ], future development of AE-IPF [ 6 ], and clinical parameters representing disease severity, such as lower D L CO and shorter 6-min walk distance [ 4 , 7 ]. On the other hand, Bruno et al. demonstrated elevated BALF-mtDNA in IPF [ 4 ], although its clinical significance and prognostic impact have not been studied in detail, and how BALF-mtDNA levels alter depending on the disease status has never been investigated. In our study, levels of BALF-mtDNA and serum-mtDNA were poorly correlated with each other in both stable and acute phases. While the levels of BALF-mtDNA are expected to reflect the concentration of mtDNA in the epithelial lining fluid of the lungs, its kinetics, such as half-life, have seldom been studied. On the other hand, the kinetics of mtDNA levels in the bloodstream have been studied in various acute disease states, and its half-life is expected to be short. Circulating mtDNA levels are suggested to be influenced by multiple systemic parameters, including the concentration of DNase in the blood and clearance by organs such as the liver and kidney. Based on these results, we speculate that BALF-mtDNA may sensitively reflect local lung damage and be elevated even in mild disease, while serum-mtDNA may be elevated in more advanced disease and reflect systemic inflammation. To elucidate these hypotheses, further studies are warranted.
Clinical parameters such as baseline lung function [ 14 , 20 , 21 , 22 , 23 ], worse oxygenation [ 14 , 24 ], neutrophils and lymphocytes in BALF [ 14 , 15 ], and blood biomarkers like CRP [ 14 ], LDH [ 24 , 25 ], and KL-6 [ 24 ] have been identified as prognostic factors of AE-IPF, though their impact has varied between studies. Our study results may provide new insights into this area. Given that the MST of AE-IPF is generally recognized as 3–4 months [ 2 , 26 ], our findings indicate that BALF-mtDNA can distinguish between AE-IPF patients with an MST of less than 3 months (non-survivors) and those with an MST of more than 30 months (survivors). Meanwhile, serum-mtDNA was not correlated with survival after the diagnosis of AE-IPF, though the number of the assessed serum samples was limited. This suggests that the dynamics of mtDNA circulating in the local lung are distinct from that in the systemic condition in the acute setting. Given that BALF-mtDNA, but not nucDNA, which is generally released during cell death, was significantly correlated with BALF-neutrophils, active release of mtDNA from cells may be related to acute neutrophilic inflammation.
In stable IPF, age, sex, baseline FVC and D L CO are widely accepted prognostic factors [ 27 ]. Meanwhile, though there are a few reports insisting on the prognostic value of BALF biomarkers such as surfactant protein A and neutrophils [ 28 , 29 ], supporting evidence for them is still lacking. Our study found that BALF-mtDNA was associated with survival of IPF in a stable state. Additionally, it is worth noting that the disease severity in our cohort was relatively mild, as evidenced by a median FVC of approximately 80% predicted. Therefore, BALF-mtDNA may be a sensitive factor correlating with survival, even in the early stages of the disease with preserved lung function.
In this study, BALF-mtDNA levels in a stable state were correlated with the severity of lung function impairment (reduced D L CO and PaO 2 /FiO 2 ) as well as serum KL-6, which has been reported to reflect the extent of lung involvement in IPF. Similar correlations were also observed with BALF-nucDNA. The increases in both BALF-mtDNA and BALF-nucDNA may reflect the increased apoptosis in the lungs. Meanwhile, it is worth noting that, unlike BALF-nucDNA, BALF-mtDNA levels were significantly decreased in smokers compared to non-smokers. A previous study has revealed increased mtDNA damage and deletion, as well as decreased mtDNA in macrophages in BALF from smokers compared with that from non-smokers [ 30 ]. While a number of other studies have demonstrated increased mtDNA levels in blood [ 18 ] or cells exposed to cigarette smoke [ 31 , 32 ], the alteration of extracellular mtDNA levels in BALF has not been extensively studied. Although further studies investigating the effect of smoking on BALF-mtDNA are warranted, our data suggest that the increased BALF-mtDNA observed in IPF patients may reflect the pathological mechanisms correlated with disease severity and progression, rather than non-specific oxidative stress increased in the lungs of smokers.
ddPCR is a highly sensitive gene detection method increasingly used in medical and basic research. Moreover, this novel method has the great advantage of simplifying the sample preparation steps by using crude samples. It has been applied to measure various biomarkers in BALF and bronchial washing fluid, such as lung microbiota [ 33 , 34 , 35 , 36 ] and pathogenic gene mutations in lung cancer [ 37 ]. However, ddPCR has not been used to detect biomarkers of pulmonary fibrosis, and no previous study has evaluated mtDNA levels in BALF using ddPCR. We believe that the preciseness and result reproducibility of ddPCR strengthen the robustness of our findings, and the convenience supports its future application to both clinical practice and basic research.
Some limitations of this study should be acknowledged. First, it is a retrospective study with a limited number of included cases conducted in a single centre without a validation cohort. Therefore, further research is needed to confirm the results. Second, our stable IPF cohort included mainly mild cases, so it is unclear whether our findings can be applied to more severe cases. However, our study suggests that BALF-mtDNA may be prognostic at least in mild cases. Third, due to the invasiveness of BAL and limited diagnostic information which can be obtained from it, it is not routinely recommended for evaluating IPF/AE-IPF. While measuring mtDNA may extend the usefulness of BAL, a less invasive procedure for obtaining samples reflecting information in the alveolar lining fluid is expected and would further enhance the clinical value of mtDNA as a prognostic biomarker. Fourth, due to the lack of information regarding comorbidities, this report could not provide any information regarding the correlation between patients’ comorbidities and BALF-mtDNA levels. Fifth, due to the ethical limitation related with the invasiveness of BAL procedure, we could not obtain BALF samples from healthy controls. This made interpretation of our findings challenging. Lastly, the limited number of patients who provided serum samples may have led to an underestimation of the prognostic impact of serum mtDNA at the time of AE. Further study is needed to reach a conclusion.
Elevated BALF-mtDNA levels were associated with inflammation or disordered pulmonary function in a stable state, and with an elevated neutrophil ratio in BALF at the time of AE. They were also associated with shorter survival in both stable IPF and at the time of AE. Notably, higher BALF-mtDNA levels may help distinguish non-survivors from survivors in AE-IPF. Given the trends shown by analyses for serum-mtDNA and BALF-nucDNA, the elevation of BALF-mtDNA might reflect different underlying aetiology reflected by serum-mtDNA and might not simply reflect the impact of cell collapse. Further research is required to explore the underlying mechanisms and clinical applications of BALF-mtDNA in IPF.
Availability of data and materials
The datasets used and/or analysed during the current study are available from the corresponding author on reasonable request.
Abbreviations
- Acute exacerbation
Area under the curve
- Bronchoalveolar lavage
Bronchoalveolar lavage fluid
Body mass index
C-reactive protein
Danger-associated molecular pattern molecules
Droplet digital polymerase chain reaction
Diffusing capacity of the lung for carbon monoxide
Fraction of inspiratory oxygen
Forced vital capacity
- Idiopathic pulmonary fibrosis
Lactate dehydrogenase
Median survival time
Mitochondrial deoxyribonucleic acid
Nucleolar deoxyribonucleic acid
Partial pressure of arterial oxygen
Polymerase chain reaction
Receiver operating characteristic
Raghu G, Collard HR, Egan JJ, Martinez FJ, Behr J, Brown KK, et al. An official ATS/ERS/JRS/ALAT statement: idiopathic pulmonary fibrosis: evidence-based guidelines for diagnosis and management. Am J Respir Crit Care Med. 2011;183(6):788–824.
Article PubMed PubMed Central Google Scholar
Collard HR, Ryerson CJ, Corte TJ, Jenkins G, Kondoh Y, Lederer DJ, et al. Acute Exacerbation of Idiopathic Pulmonary Fibrosis. An International Working Group Report. Am J Respir Crit Care Med. 2016;194(3):265–75.
Article CAS PubMed Google Scholar
Ryu C, Sun H, Gulati M, Herazo-Maya JD, Chen Y, Osafo-Addo A, et al. Extracellular Mitochondrial DNA Is Generated by Fibroblasts and Predicts Death in Idiopathic Pulmonary Fibrosis. Am J Respir Crit Care Med. 2017;196(12):1571–81.
Article CAS PubMed PubMed Central Google Scholar
Bueno M, Zank D, Buendia-Roldán I, Fiedler K, Mays BG, Alvarez D, et al. PINK1 attenuates mtDNA release in alveolar epithelial cells and TLR9 mediated profibrotic responses. PLoS ONE. 2019;14(6):e0218003.
Yoon HY, Choi K, Kim M, Kim HS, Song JW. Blood mitochondrial DNA as a biomarker of clinical outcomes in idiopathic pulmonary fibrosis. Eur Respir J. 2020;56(5):2001769.
Sakamoto K, Furukawa T, Yamano Y, Kataoka K, Teramachi R, Walia A, et al. Serum mitochondrial DNA predicts the risk of acute exacerbation and progression of idiopathic pulmonary fibrosis. Eur Respir J. 2021;57(1):2001346.
Liang Y, Fan S, Jiang Y, Ji T, Chen R, Xu Q, et al. Elevated serum mitochondrial DNA levels were associated with the progression and mortality in idiopathic pulmonary fibrosis. Int Immunopharmacol. 2023;123:110754.
Hindson BJ, Ness KD, Masquelier DA, Belgrader P, Heredia NJ, Makarewicz AJ, et al. High-throughput droplet digital PCR system for absolute quantitation of DNA copy number. Anal Chem. 2011;83(22):8604–10.
Kuypers J, Jerome KR. Applications of Digital PCR for Clinical Microbiology. J Clin Microbiol. 2017;55(6):1621–8.
Vasudevan HN, Xu P, Servellita V, Miller S, Liu L, Gopez A, et al. Digital droplet PCR accurately quantifies SARS-CoV-2 viral load from crude lysate without nucleic acid purification. Sci Rep. 2021;11(1):780.
Raghu G, Remy-Jardin M, Myers JL, Richeldi L, Ryerson CJ, Lederer DJ, et al. Diagnosis of Idiopathic Pulmonary Fibrosis. An Official ATS/ERS/JRS/ALAT Clinical Practice Guideline. Am J Respir Crit Care Med. 2018;198(5):e44–68.
Article PubMed Google Scholar
Fukihara J, Taniguchi H, Ando M, Kondoh Y, Kimura T, Kataoka K, et al. Hemosiderin-laden macrophages are an independent factor correlated with pulmonary vascular resistance in idiopathic pulmonary fibrosis: a case control study. BMC Pulm Med. 2017;17(1):30.
Benjamini Y, Hochberg Y. Controlling the False Discovery Rate: A Practical and Powerful Approach to Multiple Testing. J R Statst Soc B. 1995;57(1):289–300.
Article Google Scholar
Song JW, Hong SB, Lim CM, Koh Y, Kim DS. Acute exacerbation of idiopathic pulmonary fibrosis: incidence, risk factors and outcome. Eur Respir J. 2011;37(2):356–63.
Kono M, Miyashita K, Hirama R, Oshima Y, Takeda K, Mochizuka Y, et al. Prognostic significance of bronchoalveolar lavage cellular analysis in patients with acute exacerbation of interstitial lung disease. Respir Med. 2021;186:106534.
Zhang Q, Raoof M, Chen Y, Sumi Y, Sursal T, Junger W, et al. Circulating mitochondrial DAMPs cause inflammatory responses to injury. Nature. 2010;464(7285):104–7.
Pérez-Treviño P, Velásquez M, García N. Mechanisms of mitochondrial DNA escape and its relationship with different metabolic diseases. Biochim Biophys Acta Mol Basis Dis. 2020;1866(6):165761.
Giordano L, Gregory AD, Pérez Verdaguer M, Ware SA, Harvey H, DeVallance E, et al. Extracellular release of mitochondrial DNA: triggered by cigarette smoke and detected in COPD. Cells. 2022;11(3):369.
Costa TJ, Potje SR, Fraga-Silva TFC, da Silva-Neto JA, Barros PR, Rodrigues D, et al. Mitochondrial DNA and TLR9 activation contribute to SARS-CoV-2-induced endothelial cell damage. Vascul Pharmacol. 2022;142:106946.
Kondoh Y, Taniguchi H, Katsuta T, Kataoka K, Kimura T, Nishiyama O, et al. Risk factors of acute exacerbation of idiopathic pulmonary fibrosis. Sarcoidosis Vasc Diffuse Lung Dis. 2010;27(2):103–10.
CAS PubMed Google Scholar
Ohshimo S, Ishikawa N, Horimasu Y, Hattori N, Hirohashi N, Tanigawa K, et al. Baseline KL-6 predicts increased risk for acute exacerbation of idiopathic pulmonary fibrosis. Respir Med. 2014;108(7):1031–9.
Arai T, Kagawa T, Sasaki Y, Sugawara R, Sugimoto C, Tachibana K, et al. Heterogeneity of incidence and outcome of acute exacerbation in idiopathic interstitial pneumonia. Respirology. 2016;21(8):1431–7.
Mura M, Porretta MA, Bargagli E, Sergiacomi G, Zompatori M, Sverzellati N, et al. Predicting survival in newly diagnosed idiopathic pulmonary fibrosis: a 3-year prospective study. Eur Respir J. 2012;40(1):101–9.
Kishaba T, Tamaki H, Shimaoka Y, Fukuyama H, Yamashiro S. Staging of acute exacerbation in patients with idiopathic pulmonary fibrosis. Lung. 2014;192(1):141–9.
Simon-Blancal V, Freynet O, Nunes H, Bouvry D, Naggara N, Brillet PY, et al. Acute exacerbation of idiopathic pulmonary fibrosis: outcome and prognostic factors. Respiration. 2012;83(1):28–35.
Suzuki A, Kondoh Y, Brown KK, Johkoh T, Kataoka K, Fukuoka J, et al. Acute exacerbations of fibrotic interstitial lung diseases. Respirology. 2020;25(5):525–34.
Ley B, Ryerson CJ, Vittinghoff E, Ryu JH, Tomassetti S, Lee JS, et al. A multidimensional index and staging system for idiopathic pulmonary fibrosis. Ann Intern Med. 2012;156(10):684–91.
McCormack FX, King TE, Bucher BL, Nielsen L, Mason RJ. Surfactant protein A predicts survival in idiopathic pulmonary fibrosis. Am J Respir Crit Care Med. 1995;152(2):751–9.
Kinder BW, Brown KK, Schwarz MI, Ix JH, Kervitsky A, King TE. Baseline BAL neutrophilia predicts early mortality in idiopathic pulmonary fibrosis. Chest. 2008;133(1):226–32.
Ballinger SW, Bouder TG, Davis GS, Judice SA, Nicklas JA, Albertini RJ. Mitochondrial genome damage associated with cigarette smoking. Cancer Res. 1996;56(24):5692–7.
Masayesva BG, Mambo E, Taylor RJ, Goloubeva OG, Zhou S, Cohen Y, et al. Mitochondrial DNA content increase in response to cigarette smoking. Cancer Epidemiol Biomarkers Prev. 2006;15(1):19–24.
Mori KM, McElroy JP, Weng DY, Chung S, Fadda P, Reisinger SA, et al. Lung mitochondrial DNA copy number, inflammatory biomarkers, gene transcription and gene methylation in vapers and smokers. EBioMedicine. 2022;85:104301.
Dickson RP, Schultz MJ, van der Poll T, Schouten LR, Falkowski NR, Luth JE, et al. Lung Microbiota Predict Clinical Outcomes in Critically Ill Patients. Am J Respir Crit Care Med. 2020;201(5):555–63.
Combs MP, Wheeler DS, Luth JE, Falkowski NR, Walker NM, Erb-Downward JR, et al. Lung microbiota predict chronic rejection in healthy lung transplant recipients: a prospective cohort study. Lancet Respir Med. 2021;9(6):601–12.
Baker JM, Hinkle KJ, McDonald RA, Brown CA, Falkowski NR, Huffnagle GB, et al. Whole lung tissue is the preferred sampling method for amplicon-based characterization of murine lung microbiota. Microbiome. 2021;9(1):99.
Jitmuang A, Nititammaluk A, Boonsong T, Sarasombath PT, Sompradeekul S, Chayakulkeeree M. A novel droplet digital polymerase chain reaction for diagnosis of Pneumocystis pneumonia (PCP)-a clinical performance study and survey of sulfamethoxazole-trimethoprim resistant mutations. J Infect. 2021;83(6):701–8.
Lee SH, Kim EY, Kim T, Chang YS. Compared to plasma, bronchial washing fluid shows higher diagnostic yields for detecting EGFR-TKI sensitizing mutations by ddPCR in lung cancer. Respir Res. 2020;21(1):142.
Download references
Acknowledgements
The authors wish to acknowledge Ms. Moeko Marui and Mr. Tomoyasu Ito from the Division for Medical Research Engineering, Nagoya University Graduate School of Medicine, for technical support in digital droplet PCR analysis.
This work was supported by Grant-in-Aid for Scientific Research (18K15948, 21K08202) and the Hori Sciences and Arts Foundation to K. Sakamoto, and JST-CREST (Core Research for Evolutional Science and Technology; JPMJCR17H3) to N. Hashimoto and K. Sakamoto.
Author information
Authors and affiliations.
Department of Respiratory Medicine and Allergy, Tosei General Hospital, Seto, Aichi, Japan
Jun Fukihara, Kensuke Kataoka & Yasuhiro Kondoh
Department of Respiratory Medicine, Nagoya University Graduate School of Medicine, 65 Tsurumai-Cho, Showa-Ku, Nagoya, Aichi, Japan
Jun Fukihara, Koji Sakamoto, Yoshiki Ikeyama, Ryo Teramachi & Makoto Ishii
Medical IT Center, Nagoya University Hospital, Nagoya, Aichi, Japan
Taiki Furukawa
Department of Respiratory Medicine, Fujita Health University School of Medicine, Toyoake, Aichi, Japan
Naozumi Hashimoto
You can also search for this author in PubMed Google Scholar
Contributions
KS takes responsibility for the content of the manuscript, including the data and analysis; JF was a major contributor in writing the manuscript with assistance from KS. JF and KS designed the study, performed laboratory experiments, and had full access to all the data in the study with technical assistance from YI. JF, TF and RT collected clinical data from clinical charts. JF, KS, YI, TF and KK collected and managed clinical samples; JF was a major contributor in writing the manuscript with assistance from TF. KK, YK, NH and MI contributed to the editing of the manuscript; all authors read and approved the final version of the manuscript.
Corresponding author
Correspondence to Koji Sakamoto .
Ethics declarations
Ethics approval and consent to participate.
This study was approved by the Institutional Review Board of Tosei General Hospital (Seto, Aichi, Japan; Review Board No. 658).
Consent for publication
Not applicable.
Competing interests
The authors declare that they have no competing interests.
Additional information
Publisher’s note.
Springer Nature remains neutral with regard to jurisdictional claims in published maps and institutional affiliations.
Supplementary Information
12931_2024_2828_moesm1_esm.docx.
Additional file 1. Additional methods regarding processing of BALF and blood, and ddPCR, additional results regarding optimisation of ddPCR protocol and correlation between serum-mtDNA and survival from AE-IPF, and Figure S1 and S2.
Rights and permissions
Open Access This article is licensed under a Creative Commons Attribution 4.0 International License, which permits use, sharing, adaptation, distribution and reproduction in any medium or format, as long as you give appropriate credit to the original author(s) and the source, provide a link to the Creative Commons licence, and indicate if changes were made. The images or other third party material in this article are included in the article's Creative Commons licence, unless indicated otherwise in a credit line to the material. If material is not included in the article's Creative Commons licence and your intended use is not permitted by statutory regulation or exceeds the permitted use, you will need to obtain permission directly from the copyright holder. To view a copy of this licence, visit http://creativecommons.org/licenses/by/4.0/ . The Creative Commons Public Domain Dedication waiver ( http://creativecommons.org/publicdomain/zero/1.0/ ) applies to the data made available in this article, unless otherwise stated in a credit line to the data.
Reprints and permissions
About this article
Cite this article.
Fukihara, J., Sakamoto, K., Ikeyama, Y. et al. Mitochondrial DNA in bronchoalveolar lavage fluid is associated with the prognosis of idiopathic pulmonary fibrosis: a single cohort study. Respir Res 25 , 202 (2024). https://doi.org/10.1186/s12931-024-02828-9
Download citation
Received : 01 February 2024
Accepted : 30 April 2024
Published : 10 May 2024
DOI : https://doi.org/10.1186/s12931-024-02828-9
Share this article
Anyone you share the following link with will be able to read this content:
Sorry, a shareable link is not currently available for this article.
Provided by the Springer Nature SharedIt content-sharing initiative
- Droplet digital PCR
- Interstitial lung disease
- Nucleolar DNA
- Mitochondrial DNA
Respiratory Research
ISSN: 1465-993X
- General enquiries: [email protected]
Log in using your username and password
- Search More Search for this keyword Advanced search
- Latest content
- BMJ NPH Collections
- BMJ Journals More You are viewing from: Google Indexer
You are here
- Online First
- Apple cider vinegar for weight management in Lebanese adolescents and young adults with overweight and obesity: a randomised, double-blind, placebo-controlled study
- Article Text
- Article info
- Citation Tools
- Rapid Responses
- Article metrics
- http://orcid.org/0000-0002-0214-242X Rony Abou-Khalil 1 ,
- Jeanne Andary 2 and
- Elissar El-Hayek 1
- 1 Department of Biology , Holy Spirit University of Kaslik , Jounieh , Lebanon
- 2 Nutrition and Food Science Department , American University of Science and Technology , Beirut , Lebanon
- Correspondence to Dr Rony Abou-Khalil, Department of Biology, Holy Spirit University of Kaslik, Jounieh, Lebanon; ronyaboukhalil{at}usek.edu.lb
Background and aims Obesity and overweight have become significant health concerns worldwide, leading to an increased interest in finding natural remedies for weight reduction. One such remedy that has gained popularity is apple cider vinegar (ACV).
Objective To investigate the effects of ACV consumption on weight, blood glucose, triglyceride and cholesterol levels in a sample of the Lebanese population.
Materials and methods 120 overweight and obese individuals were recruited. Participants were randomly assigned to either an intervention group receiving 5, 10 or 15 mL of ACV or a control group receiving a placebo (group 4) over a 12-week period. Measurements of anthropometric parameters, fasting blood glucose, triglyceride and cholesterol levels were taken at weeks 0, 4, 8 and 12.
Results Our findings showed that daily consumption of the three doses of ACV for a duration of between 4 and 12 weeks is associated with significant reductions in anthropometric variables (weight, body mass index, waist/hip circumferences and body fat ratio), blood glucose, triglyceride and cholesterol levels. No significant risk factors were observed during the 12 weeks of ACV intake.
Conclusion Consumption of ACV in people with overweight and obesity led to an improvement in the anthropometric and metabolic parameters. ACV could be a promising antiobesity supplement that does not produce any side effects.
- Weight management
- Lipid lowering
Data availability statement
All data relevant to the study are included in the article or uploaded as supplementary information.
This is an open access article distributed in accordance with the Creative Commons Attribution Non Commercial (CC BY-NC 4.0) license, which permits others to distribute, remix, adapt, build upon this work non-commercially, and license their derivative works on different terms, provided the original work is properly cited, appropriate credit is given, any changes made indicated, and the use is non-commercial. See: http://creativecommons.org/licenses/by-nc/4.0/ .
https://doi.org/10.1136/bmjnph-2023-000823
Statistics from Altmetric.com
Request permissions.
If you wish to reuse any or all of this article please use the link below which will take you to the Copyright Clearance Center’s RightsLink service. You will be able to get a quick price and instant permission to reuse the content in many different ways.
WHAT IS ALREADY KNOWN ON THIS TOPIC
Recently, there has been increasing interest in alternative remedies to support weight management, and one such remedy that has gained popularity is apple cider vinegar (ACV).
A few small-scale studies conducted on humans have shown promising results, with ACV consumption leading to weight loss, reduced body fat and decreased waist circumference.
WHAT THIS STUDY ADDS
No study has been conducted to investigate the potential antiobesity effect of ACV in the Lebanese population. By conducting research in this demographic, the study provides region-specific data and offers a more comprehensive understanding of the impact of ACV on weight loss and metabolic health.
HOW THIS STUDY MIGHT AFFECT RESEARCH, PRACTICE OR POLICY
The results might contribute to evidence-based recommendations for the use of ACV as a dietary intervention in the management of obesity.
The study could stimulate further research in the field, prompting scientists to explore the underlying mechanisms and conduct similar studies in other populations.
Introduction
Obesity is a growing global health concern characterised by excessive body fat accumulation, often resulting from a combination of genetic, environmental and lifestyle factors. 1 It is associated with an increased risk of numerous chronic illnesses such as type 2 diabetes, cardiovascular diseases, several common cancers and osteoarthritis. 1–3
According to the WHO, more than 1.9 billion adults were overweight worldwide in 2016, of whom more than 650 million were obese. 4 Worldwide obesity has nearly tripled since 1975. 4 The World Obesity Federation’s 2023 Atlas predicts that by 2035 more than half of the world’s population will be overweight or obese. 5
According to the 2022 Global Nutrition Report, Lebanon has made limited progress towards meeting its diet-related non-communicable diseases target. A total of 39.9% of adult (aged ≥18 years) women and 30.5% of adult men are living with obesity. Lebanon’s obesity prevalence is higher than the regional average of 10.3% for women and 7.5% for men. 6 In Lebanon, obesity was considered as the most important health problem by 27.6% and ranked fifth after cancer, cardiovascular, smoking and HIV/AIDS. 7
In recent years, there has been increasing interest in alternative remedies to support weight management, and one such remedy that has gained popularity is apple cider vinegar (ACV), which is a type of vinegar made by fermenting apple juice. ACV contains vitamins, minerals, amino acids and polyphenols such as flavonoids, which are believed to contribute to its potential health benefits. 8 9
It has been used for centuries as a traditional remedy for various ailments and has recently gained attention for its potential role in weight management.
In hypercaloric-fed rats, the daily consumption of ACV showed a lower rise in blood sugar and lipid profile. 10 In addition, ACV seems to decrease oxidative stress and reduces the risk of obesity in male rats with high-fat consumption. 11
A few small-scale studies conducted on humans have shown promising results, with ACV consumption leading to weight loss, reduced body fat and decreased waist circumference. 12 13 In fact, It has been suggested that ACV by slowing down gastric emptying, might promote satiety and reduce appetite. 14–16 Furthermore, ACV intake seems to ameliorate the glycaemic and lipid profile in healthy adults 17 and might have a positive impact on insulin sensitivity, potentially reducing the risk of type 2 diabetes. 8 10 18
Unfortunately, the sample sizes and durations of these studies were limited, necessitating larger and longer-term studies for more robust conclusions.
This work aims to study the efficacy and safety of ACV in reducing weight and ameliorating the lipid and glycaemic profiles in a sample of overweight and obese adolescents and young adults of the Lebanese population. To the best of our knowledge, no study has been conducted to investigate the potential antiobesity effect of ACV in the Lebanese population.
Materials and methods
Participants.
A total of 120 overweight and obese adolescents and young adults (46 men and 74 women) were enrolled in the study and assigned to either placebo group or experimental groups (receiving increasing doses of ACV).
The subjects were evaluated for eligibility according to the following inclusion criteria: age between 12 and 25 years, BMIs between 27 and 34 kg/m 2 , no chronic diseases, no intake of medications, no intake of ACV over the past 8 weeks prior to the beginning of the study. The subjects who met the inclusion criteria were selected by convenient sampling technique. Those who experienced heartburn due to vinegar were excluded.
Demographic, clinical data and eating habits were collected from all participants by self-administered questionnaire.
Study design
This study was a double-blind, randomised clinical trial conducted for 12 weeks.
Subjects were divided randomly into four groups: three treatment groups and a placebo group. A simple randomisation method was employed using the randomisation allocation software. Groups 1, 2 and 3 consumed 5, 10 and 15 mL, respectively, of ACV (containing 5% of acetic acid) diluted in 250 mL of water daily, in the morning on an empty stomach, for 12 weeks. The control group received a placebo consisting of water with similar taste and appearance. In order to mimic the taste of vinegar, the placebo group’s beverage (250 mL of water) contained lactic acid (250 mg/100 mL). Identical-looking ACV and placebo bottles were used and participants were instructed to consume their assigned solution without knowing its identity. The subject’s group assignment was withheld from the researchers performing the experiment.
Subjects consumed their normal diets throughout the study. The contents of daily meals and snacks were recorded in a diet diary. The physical activity of the subjects was also recorded. Daily individual phone messages were sent to all participants to remind them to take the ACV or the placebo. A mailing group was also created. Confidentiality was maintained throughout the procedure.
At weeks 0, 4, 8 and 12, anthropometric measurements were taken for all participants, and the level of glucose, triglycerides and total cholesterol was assessed by collecting 5 mL of fasting blood from each subject.
Anthropometric measurements
Body weight was measured in kg, to the nearest 0.01 kg, by standardised and calibrated digital scale. Height was measured in cm, to the nearest 0.1 cm, by a stadiometer. Anthropometric measurements were taken for all participants, by a team of trained field researchers, after 10–12 hours fast and while wearing only undergarments.
Body mass indices (BMIs) were calculated using the following equation:
The waist circumference measurement was taken between the lowest rib margin and the iliac crest while the subject was in a standing position (to the nearest 0.1 cm). Hip circumference was measured at the widest point of the hip (to the nearest 0.1 cm).
The body fat ratio (BFR) was measured by the bioelectrical impedance analysis method (OMRON Fat Loss Monitor, Model No HBF-306C; Japan). Anthropometric variables are shown in table 1 .
- View inline
Baseline demographic, anthropometric and biochemical variables of the three apple cider vinegar groups (group 1, 2 and 3) and the placebo group (group 4)
Blood biochemical analysis
Serum glucose was measured by the glucose oxidase method. 19 Triglyceride levels were determined using a serum triglyceride determination kit (TR0100, Sigma-Aldrich). Cholesterol levels were determined using a cholesterol quantitation kit (MAK043, Sigma-Aldrich). Biochemical variables are shown in table 1 .
Statistical methods and data analysis
Data are presented as mean±SD. Statistical analyses were performed using Statistical Package for the Social Sciences (SPSS) software (version 23.0). Significant differences between groups were determined by using an independent t-test. Statistical significance was set at p<0.05.
Ethical approval
The study protocol was reviewed and approved by the research ethics committee (REC) of the Higher Centre for Research (HCR) at The Holy Spirit University of Kaslik (USEK), Lebanon. The number/ID of the approval is HCR/EC 2023–005. The participants were informed of the study objectives and signed a written informed consent before enrolment. The study was conducted in accordance to the International Conference and Harmonisation E6 Guideline for Good Clinical Practice and the Ethical principles of the Declaration of Helsinki.
Sociodemographic, nutritional and other baseline characteristics of the participants
A total of 120 individuals (46 men and 74 women) with BMIs between 27 and 34 kg/m 2 , were enrolled in the study. The mean age of the subjects was 17.8±5.7 years and 17.6±5.4 years in the placebo and experimental groups respectively.
The majority of participants, approximately 98.3%, were non-vegetarian and 89% of them reported having a high eating frequency, with more than four meals per day. Eighty-seven per cent had no family history of obesity and 98% had no history of childhood obesity. The majority reported not having a regular exercise routine and experiencing negative emotions or anxiety. All participants were non-smokers and non-drinkers. A small percentage (6.7%) were following a therapeutic diet.
Effects of ACV intake on anthropometric variables
The addition of 5 mL, 10 mL or 15 mL of ACV to the diet resulted in significant decreases in body weight and BMI at weeks 4, 8 and 12 of ACV intake, when compared with baseline (week 0) (p<0.05). The decrease in body weight and BMI seemed to be dose-dependent, with the group receiving 15 mL of ACV showing the most important reduction ( table 2 ).
Anthropometric variables of the participants at weeks 0, 4, 8 and 12
The impact of ACV on body weight and BMI seems to be time-dependent as well. Reductions were more pronounced as the study progressed, with the most significant changes occurring at week 12.
The circumferences of the waist and hip, along with the Body Fat Ratio (BFR), decreased significantly in the three treatment groups at weeks 8 and 12 compared with week 0 (p<0.05). No significant effect was observed at week 4, compared with baseline (p>0.05). The effect of ACV on these parameters seems to be time-dependent with the most prominent effect observed at week 12 compared with week 4 and 8. However it does not seem to be dose dependent, as the three doses of ACV showed a similar level of efficacy in reducing the circumferences of the waist/hip circumferences and the BFR at week 8 and 12, compared with baseline ( table 2 ).
The placebo group did not experience any significant changes in the anthropometric variables throughout the study (p>0.05). This highlights that the observed improvements in body weight, BMI, waist and hip circumferences and Body Fat Ratio were likely attributed to the consumption of ACV.
Effects of ACV on blood biochemical parameters
The consumption of ACV also led to a time and dose dependent decrease in serum glucose, serum triglyceride and serum cholesterol levels. ( table 3 ).
Biochemical variables of the participants at weeks 0, 4, 8 and 12
Serum glucose levels decreased significantly by three doses of ACV at week 4, 8 and 12 compared with week 0 (p<0.05) ( table 3 ). Triglycerides and total cholesterol levels decreased significantly at weeks 8 and 12, compared with week 0 (p<0.05). A dose of 15 mL of ACV for a duration of 12 weeks seems to be the most effective dose in reducing these three blood biochemical parameters.
There were no changes in glucose, triglyceride and cholesterol levels in the placebo groups at weeks 4, 8 and 12 compared with week 0 ( table 3 ).
These data suggest that continued intake of 15 mL of ACV for more than 8 weeks is effective in reducing blood fasting sugar, triglyceride and total cholesterol levels in overweight/obese people.
Adverse reactions of ACV
No apparent adverse or harmful effects were reported by the participants during the 12 weeks of ACV intake.
During the past two decades of the last century, childhood and adolescent obesity have dramatically increased healthcare costs. 20 21 Diet and exercise are the basic elements of weight loss. Many complementary therapies have been promoted to treat obesity, but few are truly beneficial.
The present study is the first to investigate the antiobesity effectiveness of ACV, the fermented juice from crushed apples, in the Lebanese population.
A total of 120 overweight and obese adolescents and young adults (46 men and 74 women) with BMIs between 27 and 34 kg/m 2 , were enrolled. Participants were randomised to receive either a daily dose of ACV (5, 10 or 15 mL) or a placebo for a duration of 12 weeks.
Some previous studies have suggested that taking ACV before or with meals might help to reduce postprandial blood sugar levels, 22 23 but in our study, participants took ACV in the morning on an empty stomach. The choice of ACV intake timing was motivated by the aim to study the impact of apple cider vinegar without the confounding variables introduced by simultaneous food intake. In addition, taking ACV before meals could better reduce appetite and increase satiety.
Our findings reveal that the consumption of ACV in people with overweight and obesity led to an improvement in the anthropometric and metabolic parameters.
It is important to note that the diet diary and physical activity did not differ among the three treatment groups and the placebo throughout the whole study, suggesting that the decrease in anthropometric and biochemical parameters was caused by ACV intake.
Studies conducted on animal models often attribute these effects to various mechanisms, including increased energy expenditure, improved insulin sensitivity, appetite and satiety regulation.
While vinegar is composed of various ingredients, its primary component is acetic acid (AcOH). It has been shown that after 15 min of oral ingestion of 100 mL vinegar containing 0.75 g acetic acid, the serum acetate levels increases from 120 µmol/L at baseline to 350 µmol/L 24 ; this fast increase in circulatory acetate is due to its fast absorption in the upper digestive tract. 24 25
Biological action of acetate may be mediated by binding to the G-protein coupled receptors (GPRs), including GPR43 and GPR41. 25 These receptors are expressed in various insulin-sensitive tissues, such as adipose tissue, 26 skeletal muscle, liver, 27 and pancreatic beta cells, 28 but also in the small intestine and colon. 29 30
Yamashita and colleagues have revealed that oral administration of AcOH to type 2 diabetic Otsuka Long-Evans Tokushima Fatty rats, improves glucose tolerance and reduces lipid accumulation in the adipose tissue and liver. This improvement in obesity-linked type 2 diabetes is due to the capacity of AcOH to inhibit the activity of carbohydrate-responsive, element-binding protein, a transcription factor involved in regulating the expression of lipogenic genes such as fatty acid synthase and acetyl-CoA carboxylase. 26 31 Sakakibara and colleagues, have reported that AcOH, besides inhibiting lipogenesis, reduces the expression of genes involved in gluconeogenesis, such as glucose-6-phosphatase. 32 The effect of AcOH on lipogenesis and gluconeogenesis is in part mediated by the activation of 5'-AMP-activated protein kinase in the liver. 32 This enzyme seems to be an important pharmacological target for the treatment of metabolic disorders such as obesity, type 2 diabetes and hyperlipidaemia. 32 33
5'-AMP-activated protein kinase is also known to stimulate fatty acid oxidation, thereby increasing energy expenditure. 32 33 These data suggest that the effect of ACV on weight and fat loss may be partly due to the ability of AcOH to inhibit lipogenesis and gluconeogenesis and activate fat oxidation.
Animal studies suggest that besides reducing energy expenditure, acetate may also reduce energy intake, by regulating appetite and satiety. In mice, an intraperitoneal injection of acetate significantly reduced food intake by activating vagal afferent neurons. 32–34 It is important to note that animal studies done on the effect of acetate on vagal activation are contradictory. This might be due to the site of administration of acetate and the use of different animal models.
In addition, in vitro and in vivo animal model studies suggest that acetate increases the secretion of gut-derived satiety hormones by enter endocrine cells (located in the gut) such as GLP-1 and PYY hormones. 25 32–35
Human studies related to the effect of vinegar on body weight are limited.
In accordance with our study, a randomised clinical trial conducted by Khezri and his colleagues has shown that daily consumption of 30 mL of ACV for 12 weeks significantly reduced body weight, BMI, hip circumference, Visceral Adiposity Index and appetite score in obese subjects subjected to a restricted calorie diet, compared with the control group (restricted calorie diet without ACV). Furthermore, Khezri and his colleagues showed that plasma triglyceride and total cholesterol levels significantly decreased, and high density lipoprotein cholesterol concentration significantly increased, in the ACV group in comparison with the control group. 13 32–34
Similarly, Kondo and his colleagues showed that daily consumption of 15 or 30 mL of ACV for 12 weeks reduced body weight, BMI and serum triglyceride in a sample of the Japanese population. 12 13 32–34
In contrast, Park et al reported that daily consumption of 200 mL of pomegranate vinegar for 8 weeks significantly reduced total fat mass in overweight or obese subjects compared with the control group without significantly affecting body weight and BMI. 36 This contradictory result could be explained by the difference in the percentage of acetate and other potentially bioactive compounds (such as flavonoids and other phenolic compounds) in different vinegar types.
In Lebanon, the percentage of the population with a BMI of 30 kg/m 2 or more is approximately 32%. The results of the present study showed that in obese Lebanese subjects who had BMIs ranging from 27 and 34 kg/m 2 , daily oral intake of ACV for 12 weeks reduced the body weight by 6–8 kg and BMIs by 2.7–3.0 points.
It would be interesting to investigate in future studies the effect of neutralised acetic acid on anthropometric and metabolic parameters, knowing that acidic substances, including acetic acid, could contribute to enamel erosion over time. In addition to promoting oral health, neutralising the acidity of ACV could improve its taste, making it more palatable. Furthermore, studying the effects of ACV on weight loss in young Lebanese individuals provides valuable insights, but further research is needed for a comprehensive understanding of how the effect of ACV might vary across different age groups, particularly in older populations and menopausal women.
The findings of this study indicate that ACV consumption for 12 weeks led to significant reduction in anthropometric variables and improvements in blood glucose, triglyceride and cholesterol levels in overweight/obese adolescents/adults. These results suggest that ACV might have potential benefits in improving metabolic parameters related to obesity and metabolic disorders in obese individuals. The results may contribute to evidence-based recommendations for the use of ACV as a dietary intervention in the management of obesity. The study duration of 12 weeks limits the ability to observe long-term effects. Additionally, a larger sample size would enhance the generalisability of the results.
Ethics statements
Patient consent for publication.
Consent obtained from parent(s)/guardian(s)
Ethics approval
This study involves human participants and was approved by the research ethics committee of the Higher Center for Research (HCR) at The Holy Spirit University of Kaslik (USEK), Lebanon. The number/ID of the approval is HCR/EC 2023-005. Participants gave informed consent to participate in the study before taking part.
- Pandi-Perumal SR , et al
- Poirier P ,
- Bray GA , et al
- World Health Organization
- Global Nutrition Report
- Geagea AG ,
- Jurjus RA , et al
- Liao H-J , et al
- Serafin V ,
- Ousaaid D ,
- Laaroussi H ,
- Bakour M , et al
- Halima BH ,
- Sarra K , et al
- Fushimi T , et al
- Khezri SS ,
- Saidpour A ,
- Hosseinzadeh N , et al
- Montaser R , et al
- Hlebowicz J ,
- Darwiche G ,
- Björgell O , et al
- Santos HO ,
- de Moraes WMAM ,
- da Silva GAR , et al
- Pourmasoumi M ,
- Najafgholizadeh A , et al
- Walker HK ,
- Sanyaolu A ,
- Qi X , et al
- Nosrati HR ,
- Mousavi SE ,
- Sajjadi P , et al
- Johnston CS ,
- Quagliano S ,
- Sugiyama S ,
- Fushimi T ,
- Kishi M , et al
- Hernández MAG ,
- Canfora EE ,
- Jocken JWE , et al
- Le Poul E ,
- Struyf S , et al
- Goldsworthy SM ,
- Barnes AA , et al
- Priyadarshini M ,
- Fuller M , et al
- Karaki S-I ,
- Hayashi H , et al
- Karaki S-I , et al
- Yamashita H ,
- Fujisawa K ,
- Ito E , et al
- Sakakibara S ,
- Yamauchi T ,
- Oshima Y , et al
- Schimmack G ,
- Defronzo RA ,
- Goswami C ,
- Iwasaki Y ,
- Kim J , et al
Supplementary materials
- Press release
Contributors RA-K: conceptualisation, methodology, data curation, supervision, guarantor, project administration, visualisation, writing–original draft. EE-H: conceptualisation, methodology, data curation, visualisation, writing–review and editing. JA: investigation, validation, writing–review and editing.
Funding The authors have not declared a specific grant for this research from any funding agency in the public, commercial or not-for-profit sectors.
Competing interests No, there are no competing interests.
Provenance and peer review Not commissioned; externally peer reviewed.
Read the full text or download the PDF:
IMAGES
VIDEO
COMMENTS
Types of Variables in Research & Statistics | Examples. Published on September 19, 2022 by Rebecca Bevans. Revised on June 21, 2023. In statistical research, a variable is defined as an attribute of an object of study. Choosing which variables to measure is central to good experimental design.
Scientific research: Variables are used in scientific research to understand the relationships between different factors and to make predictions about future outcomes. For example, scientists may study the effects of different variables on plant growth or the impact of environmental factors on animal behavior.
Variables can be categorized based on their role in the study (such as independent and dependent variables), the type of data they represent (quantitative or categorical), and their relationship to other variables (like confounding or control variables). Understanding what constitutes a variable and the various variable types available is a ...
Types of Variables in Research | Definitions & Examples. Published on 19 September 2022 by Rebecca Bevans. Revised on 28 November 2022. In statistical research, a variable is defined as an attribute of an object of study. Choosing which variables to measure is central to good experimental design.
However, it's important that you learn the difference because framing a study using these variables is a common approach to organizing the elements of a social sciences research study in order to discover relevant and meaningful results. Specifically, it is important for these two reasons: ... A variable in research simply refers to a person ...
The Role of Variables in Research. In scientific research, variables serve several key functions: Define Relationships: Variables allow researchers to investigate the relationships between different factors and characteristics, providing insights into the underlying mechanisms that drive phenomena and outcomes. Establish Comparisons: By manipulating and comparing variables, scientists can ...
Suitable statistical design represents a critical factor in permitting inferences from any research or scientific study.[1] Numerous statistical designs are implementable due to the advancement of software available for extensive data analysis.[1] Healthcare providers must possess some statistical knowledge to interpret new studies and provide up-to-date patient care. We present an overview of ...
What is a control variable? In an experimental design, a control variable (or controlled variable) is a variable that is intentionally held constant to ensure it doesn't have an influence on any other variables. As a result, this variable remains unchanged throughout the course of the study. In other words, it's a variable that's not allowed to vary - tough life 🙂
Variables. What is a variable?[1,2] To put it in very simple terms, a variable is an entity whose value varies.A variable is an essential component of any statistical data. It is a feature of a member of a given sample or population, which is unique, and can differ in quantity or quantity from another member of the same sample or population.
In research, the independent variable is manipulated to observe its effect, while the dependent variable is the measured outcome. Essentially, the independent variable is the presumed cause, and the dependent variable is the observed effect. Variables provide the foundation for examining relationships, drawing conclusions, and making ...
Variables in Research. The definition of a variable in the context of a research study is some feature with the potential to change, typically one that may influence or reflect a relationship or ...
A solid understanding of variables is the cornerstone in the conceptualization and preparation of a research protocol, and in the framing of study hypotheses. This subject is presented in two parts. This article, Part 1, explains what independent and dependent variables are, how an understanding of these is important in framing hypotheses, and ...
"In a research study, the independent variable defines a principal focus of research interest. It is the consequent variable that is presumably affected by one or more independent variables that are either manipulated by the researcher or observed by the researcher and regarded as antecedent conditions that determine the value of the ...
Research; Moderator Variable: The moderator variable affects the cause-and-effect relationship between the independent and dependent variables. As a result, the influence of the independent variable is in the presence of the moderator variable. Gender; Race; Class; Suppose you want to conduct a study, educational awareness of a specific area.
A solid understanding of variables is the cornerstone in the conceptualization and preparation of a research protocol, and in the framing of study hypotheses. This subject is presented in two parts. This article, Part 1, explains what independent and dependent variables are, how an understanding of these is important in framing hypotheses, and ...
In many research settings, two specific classes of variables need to be distinguished from one another: independent variable and dependent variable. Many research studies aim to reveal and understand the causes of underlying phenomena or problems with the ultimate goal of establishing a causal relationship between them.
Just as with other types of research, the independent variable in a cognitive psychology study would be the variable that the researchers manipulate. The specific independent variable would vary depending on the specific study, but it might be focused on some aspect of thinking, memory, attention, language, or decision-making.
The study revealed that as assessed by the sports officiating officials when they are grouped according to the study's variables, the results show a "high level" in all areas.Furthermore, the ...
A research design is a strategy for answering your research question using empirical data. Creating a research design means making decisions about: Your overall research objectives and approach. Whether you'll rely on primary research or secondary research. Your sampling methods or criteria for selecting subjects. Your data collection methods.
Be the first to add your personal experience. In business management research, defining variables is a crucial step that sets the stage for clarity and precision in your study. Variables are the ...
This study investigates the impact of intangible resources such as adhocracy culture (ADC), information sharing with suppliers (IS), and supplier trust (ST) on supply chain viability (SCV) under high inflation environment. To do this, a conceptual model is developed to analyze the associations between these suggested variables. Using on a cross-sectional survey, data are collected from 216 ...
Research study design is a framework, or the set of methods and procedures used to collect and analyze data on variables specified in a particular research problem. Research study designs are of many types, each with its advantages and limitations. The type of study design used to answer a particular research question is determined by the ...
Intestinal parasitic infections (IP) are a major source of morbidity in people living with Human immunodeficiency virus (HIV), particularly in resource-limited settings, mostly as a result of high viral load. Hence, this study aimed to investigate the magnitude of intestinal parasitic infections and its determinants among patients with HIV/AIDS attending public health facilities in East and ...
CD163 has long been established as a clinical antibody for detecting histiocytes that has greater specificity than CD68 , and is commonly used to represent immunosuppressive macrophages in the TIME in research studies . Immunohistochemistry (IHC) was performed by the Pathology Network Shared Resource at Roswell Park following standard procedures.
Quantitative research methods. You can use quantitative research methods for descriptive, correlational or experimental research. In descriptive research, you simply seek an overall summary of your study variables.; In correlational research, you investigate relationships between your study variables.; In experimental research, you systematically examine whether there is a cause-and-effect ...
Thus, the purpose of this research is to clarify the nonlinear connection between TyG and hyperuricemia. From 2011 to 2018, a cross-sectional study was carried out using data from the National Health and Nutrition Examination Survey (NHANES). ... After adjusting for potential confounding variables (Model 3), the study found a significant ...
INTRODUCTION. Scientific research is usually initiated by posing evidenced-based research questions which are then explicitly restated as hypotheses.1,2 The hypotheses provide directions to guide the study, solutions, explanations, and expected results.3,4 Both research questions and hypotheses are essentially formulated based on conventional theories and real-world processes, which allow the ...
Background Extracellular mitochondrial DNA (mtDNA) is released from damaged cells and increases in the serum and bronchoalveolar lavage fluid (BALF) of idiopathic pulmonary fibrosis (IPF) patients. While increased levels of serum mtDNA have been reported to be linked to disease progression and the future development of acute exacerbation (AE) of IPF (AE-IPF), the clinical significance of mtDNA ...
The study could stimulate further research in the field, prompting scientists to explore the underlying mechanisms and conduct similar studies in other populations. ... The placebo group did not experience any significant changes in the anthropometric variables throughout the study (p>0.05). This highlights that the observed improvements in ...