
Quantitative Data Analysis 101
The lingo, methods and techniques, explained simply.
By: Derek Jansen (MBA) and Kerryn Warren (PhD) | December 2020
Quantitative data analysis is one of those things that often strikes fear in students. It’s totally understandable – quantitative analysis is a complex topic, full of daunting lingo , like medians, modes, correlation and regression. Suddenly we’re all wishing we’d paid a little more attention in math class…
The good news is that while quantitative data analysis is a mammoth topic, gaining a working understanding of the basics isn’t that hard , even for those of us who avoid numbers and math . In this post, we’ll break quantitative analysis down into simple , bite-sized chunks so you can approach your research with confidence.

Overview: Quantitative Data Analysis 101
- What (exactly) is quantitative data analysis?
- When to use quantitative analysis
- How quantitative analysis works
The two “branches” of quantitative analysis
- Descriptive statistics 101
- Inferential statistics 101
- How to choose the right quantitative methods
- Recap & summary
What is quantitative data analysis?
Despite being a mouthful, quantitative data analysis simply means analysing data that is numbers-based – or data that can be easily “converted” into numbers without losing any meaning.
For example, category-based variables like gender, ethnicity, or native language could all be “converted” into numbers without losing meaning – for example, English could equal 1, French 2, etc.
This contrasts against qualitative data analysis, where the focus is on words, phrases and expressions that can’t be reduced to numbers. If you’re interested in learning about qualitative analysis, check out our post and video here .
What is quantitative analysis used for?
Quantitative analysis is generally used for three purposes.
- Firstly, it’s used to measure differences between groups . For example, the popularity of different clothing colours or brands.
- Secondly, it’s used to assess relationships between variables . For example, the relationship between weather temperature and voter turnout.
- And third, it’s used to test hypotheses in a scientifically rigorous way. For example, a hypothesis about the impact of a certain vaccine.
Again, this contrasts with qualitative analysis , which can be used to analyse people’s perceptions and feelings about an event or situation. In other words, things that can’t be reduced to numbers.
How does quantitative analysis work?
Well, since quantitative data analysis is all about analysing numbers , it’s no surprise that it involves statistics . Statistical analysis methods form the engine that powers quantitative analysis, and these methods can vary from pretty basic calculations (for example, averages and medians) to more sophisticated analyses (for example, correlations and regressions).
Sounds like gibberish? Don’t worry. We’ll explain all of that in this post. Importantly, you don’t need to be a statistician or math wiz to pull off a good quantitative analysis. We’ll break down all the technical mumbo jumbo in this post.
Need a helping hand?
As I mentioned, quantitative analysis is powered by statistical analysis methods . There are two main “branches” of statistical methods that are used – descriptive statistics and inferential statistics . In your research, you might only use descriptive statistics, or you might use a mix of both , depending on what you’re trying to figure out. In other words, depending on your research questions, aims and objectives . I’ll explain how to choose your methods later.
So, what are descriptive and inferential statistics?
Well, before I can explain that, we need to take a quick detour to explain some lingo. To understand the difference between these two branches of statistics, you need to understand two important words. These words are population and sample .
First up, population . In statistics, the population is the entire group of people (or animals or organisations or whatever) that you’re interested in researching. For example, if you were interested in researching Tesla owners in the US, then the population would be all Tesla owners in the US.
However, it’s extremely unlikely that you’re going to be able to interview or survey every single Tesla owner in the US. Realistically, you’ll likely only get access to a few hundred, or maybe a few thousand owners using an online survey. This smaller group of accessible people whose data you actually collect is called your sample .
So, to recap – the population is the entire group of people you’re interested in, and the sample is the subset of the population that you can actually get access to. In other words, the population is the full chocolate cake , whereas the sample is a slice of that cake.
So, why is this sample-population thing important?
Well, descriptive statistics focus on describing the sample , while inferential statistics aim to make predictions about the population, based on the findings within the sample. In other words, we use one group of statistical methods – descriptive statistics – to investigate the slice of cake, and another group of methods – inferential statistics – to draw conclusions about the entire cake. There I go with the cake analogy again…
With that out the way, let’s take a closer look at each of these branches in more detail.

Branch 1: Descriptive Statistics
Descriptive statistics serve a simple but critically important role in your research – to describe your data set – hence the name. In other words, they help you understand the details of your sample . Unlike inferential statistics (which we’ll get to soon), descriptive statistics don’t aim to make inferences or predictions about the entire population – they’re purely interested in the details of your specific sample .
When you’re writing up your analysis, descriptive statistics are the first set of stats you’ll cover, before moving on to inferential statistics. But, that said, depending on your research objectives and research questions , they may be the only type of statistics you use. We’ll explore that a little later.
So, what kind of statistics are usually covered in this section?
Some common statistical tests used in this branch include the following:
- Mean – this is simply the mathematical average of a range of numbers.
- Median – this is the midpoint in a range of numbers when the numbers are arranged in numerical order. If the data set makes up an odd number, then the median is the number right in the middle of the set. If the data set makes up an even number, then the median is the midpoint between the two middle numbers.
- Mode – this is simply the most commonly occurring number in the data set.
- In cases where most of the numbers are quite close to the average, the standard deviation will be relatively low.
- Conversely, in cases where the numbers are scattered all over the place, the standard deviation will be relatively high.
- Skewness . As the name suggests, skewness indicates how symmetrical a range of numbers is. In other words, do they tend to cluster into a smooth bell curve shape in the middle of the graph, or do they skew to the left or right?
Feeling a bit confused? Let’s look at a practical example using a small data set.

On the left-hand side is the data set. This details the bodyweight of a sample of 10 people. On the right-hand side, we have the descriptive statistics. Let’s take a look at each of them.
First, we can see that the mean weight is 72.4 kilograms. In other words, the average weight across the sample is 72.4 kilograms. Straightforward.
Next, we can see that the median is very similar to the mean (the average). This suggests that this data set has a reasonably symmetrical distribution (in other words, a relatively smooth, centred distribution of weights, clustered towards the centre).
In terms of the mode , there is no mode in this data set. This is because each number is present only once and so there cannot be a “most common number”. If there were two people who were both 65 kilograms, for example, then the mode would be 65.
Next up is the standard deviation . 10.6 indicates that there’s quite a wide spread of numbers. We can see this quite easily by looking at the numbers themselves, which range from 55 to 90, which is quite a stretch from the mean of 72.4.
And lastly, the skewness of -0.2 tells us that the data is very slightly negatively skewed. This makes sense since the mean and the median are slightly different.
As you can see, these descriptive statistics give us some useful insight into the data set. Of course, this is a very small data set (only 10 records), so we can’t read into these statistics too much. Also, keep in mind that this is not a list of all possible descriptive statistics – just the most common ones.
But why do all of these numbers matter?
While these descriptive statistics are all fairly basic, they’re important for a few reasons:
- Firstly, they help you get both a macro and micro-level view of your data. In other words, they help you understand both the big picture and the finer details.
- Secondly, they help you spot potential errors in the data – for example, if an average is way higher than you’d expect, or responses to a question are highly varied, this can act as a warning sign that you need to double-check the data.
- And lastly, these descriptive statistics help inform which inferential statistical techniques you can use, as those techniques depend on the skewness (in other words, the symmetry and normality) of the data.
Simply put, descriptive statistics are really important , even though the statistical techniques used are fairly basic. All too often at Grad Coach, we see students skimming over the descriptives in their eagerness to get to the more exciting inferential methods, and then landing up with some very flawed results.
Don’t be a sucker – give your descriptive statistics the love and attention they deserve!

Branch 2: Inferential Statistics
As I mentioned, while descriptive statistics are all about the details of your specific data set – your sample – inferential statistics aim to make inferences about the population . In other words, you’ll use inferential statistics to make predictions about what you’d expect to find in the full population.
What kind of predictions, you ask? Well, there are two common types of predictions that researchers try to make using inferential stats:
- Firstly, predictions about differences between groups – for example, height differences between children grouped by their favourite meal or gender.
- And secondly, relationships between variables – for example, the relationship between body weight and the number of hours a week a person does yoga.
In other words, inferential statistics (when done correctly), allow you to connect the dots and make predictions about what you expect to see in the real world population, based on what you observe in your sample data. For this reason, inferential statistics are used for hypothesis testing – in other words, to test hypotheses that predict changes or differences.

Of course, when you’re working with inferential statistics, the composition of your sample is really important. In other words, if your sample doesn’t accurately represent the population you’re researching, then your findings won’t necessarily be very useful.
For example, if your population of interest is a mix of 50% male and 50% female , but your sample is 80% male , you can’t make inferences about the population based on your sample, since it’s not representative. This area of statistics is called sampling, but we won’t go down that rabbit hole here (it’s a deep one!) – we’ll save that for another post .
What statistics are usually used in this branch?
There are many, many different statistical analysis methods within the inferential branch and it’d be impossible for us to discuss them all here. So we’ll just take a look at some of the most common inferential statistical methods so that you have a solid starting point.
First up are T-Tests . T-tests compare the means (the averages) of two groups of data to assess whether they’re statistically significantly different. In other words, do they have significantly different means, standard deviations and skewness.
This type of testing is very useful for understanding just how similar or different two groups of data are. For example, you might want to compare the mean blood pressure between two groups of people – one that has taken a new medication and one that hasn’t – to assess whether they are significantly different.
Kicking things up a level, we have ANOVA, which stands for “analysis of variance”. This test is similar to a T-test in that it compares the means of various groups, but ANOVA allows you to analyse multiple groups , not just two groups So it’s basically a t-test on steroids…
Next, we have correlation analysis . This type of analysis assesses the relationship between two variables. In other words, if one variable increases, does the other variable also increase, decrease or stay the same. For example, if the average temperature goes up, do average ice creams sales increase too? We’d expect some sort of relationship between these two variables intuitively , but correlation analysis allows us to measure that relationship scientifically .
Lastly, we have regression analysis – this is quite similar to correlation in that it assesses the relationship between variables, but it goes a step further to understand cause and effect between variables, not just whether they move together. In other words, does the one variable actually cause the other one to move, or do they just happen to move together naturally thanks to another force? Just because two variables correlate doesn’t necessarily mean that one causes the other.
Stats overload…
I hear you. To make this all a little more tangible, let’s take a look at an example of a correlation in action.
Here’s a scatter plot demonstrating the correlation (relationship) between weight and height. Intuitively, we’d expect there to be some relationship between these two variables, which is what we see in this scatter plot. In other words, the results tend to cluster together in a diagonal line from bottom left to top right.

As I mentioned, these are are just a handful of inferential techniques – there are many, many more. Importantly, each statistical method has its own assumptions and limitations .
For example, some methods only work with normally distributed (parametric) data, while other methods are designed specifically for non-parametric data. And that’s exactly why descriptive statistics are so important – they’re the first step to knowing which inferential techniques you can and can’t use.

How to choose the right analysis method
To choose the right statistical methods, you need to think about two important factors :
- The type of quantitative data you have (specifically, level of measurement and the shape of the data). And,
- Your research questions and hypotheses
Let’s take a closer look at each of these.
Factor 1 – Data type
The first thing you need to consider is the type of data you’ve collected (or the type of data you will collect). By data types, I’m referring to the four levels of measurement – namely, nominal, ordinal, interval and ratio. If you’re not familiar with this lingo, check out the video below.
Why does this matter?
Well, because different statistical methods and techniques require different types of data. This is one of the “assumptions” I mentioned earlier – every method has its assumptions regarding the type of data.
For example, some techniques work with categorical data (for example, yes/no type questions, or gender or ethnicity), while others work with continuous numerical data (for example, age, weight or income) – and, of course, some work with multiple data types.
If you try to use a statistical method that doesn’t support the data type you have, your results will be largely meaningless . So, make sure that you have a clear understanding of what types of data you’ve collected (or will collect). Once you have this, you can then check which statistical methods would support your data types here .
If you haven’t collected your data yet, you can work in reverse and look at which statistical method would give you the most useful insights, and then design your data collection strategy to collect the correct data types.
Another important factor to consider is the shape of your data . Specifically, does it have a normal distribution (in other words, is it a bell-shaped curve, centred in the middle) or is it very skewed to the left or the right? Again, different statistical techniques work for different shapes of data – some are designed for symmetrical data while others are designed for skewed data.
This is another reminder of why descriptive statistics are so important – they tell you all about the shape of your data.
Factor 2: Your research questions
The next thing you need to consider is your specific research questions, as well as your hypotheses (if you have some). The nature of your research questions and research hypotheses will heavily influence which statistical methods and techniques you should use.
If you’re just interested in understanding the attributes of your sample (as opposed to the entire population), then descriptive statistics are probably all you need. For example, if you just want to assess the means (averages) and medians (centre points) of variables in a group of people.
On the other hand, if you aim to understand differences between groups or relationships between variables and to infer or predict outcomes in the population, then you’ll likely need both descriptive statistics and inferential statistics.
So, it’s really important to get very clear about your research aims and research questions, as well your hypotheses – before you start looking at which statistical techniques to use.
Never shoehorn a specific statistical technique into your research just because you like it or have some experience with it. Your choice of methods must align with all the factors we’ve covered here.
Time to recap…
You’re still with me? That’s impressive. We’ve covered a lot of ground here, so let’s recap on the key points:
- Quantitative data analysis is all about analysing number-based data (which includes categorical and numerical data) using various statistical techniques.
- The two main branches of statistics are descriptive statistics and inferential statistics . Descriptives describe your sample, whereas inferentials make predictions about what you’ll find in the population.
- Common descriptive statistical methods include mean (average), median , standard deviation and skewness .
- Common inferential statistical methods include t-tests , ANOVA , correlation and regression analysis.
- To choose the right statistical methods and techniques, you need to consider the type of data you’re working with , as well as your research questions and hypotheses.

Psst... there’s more!
This post was based on one of our popular Research Bootcamps . If you're working on a research project, you'll definitely want to check this out ...
You Might Also Like:
")
75 Comments

Hi, I have read your article. Such a brilliant post you have created.

Thank you for the feedback. Good luck with your quantitative analysis.

Thank you so much.

Thank you so much. I learnt much well. I love your summaries of the concepts. I had love you to explain how to input data using SPSS

Amazing and simple way of breaking down quantitative methods.

This is beautiful….especially for non-statisticians. I have skimmed through but I wish to read again. and please include me in other articles of the same nature when you do post. I am interested. I am sure, I could easily learn from you and get off the fear that I have had in the past. Thank you sincerely.

Send me every new information you might have.

i need every new information

Thank you for the blog. It is quite informative. Dr Peter Nemaenzhe PhD

It is wonderful. l’ve understood some of the concepts in a more compréhensive manner

Your article is so good! However, I am still a bit lost. I am doing a secondary research on Gun control in the US and increase in crime rates and I am not sure which analysis method I should use?

Based on the given learning points, this is inferential analysis, thus, use ‘t-tests, ANOVA, correlation and regression analysis’

Well explained notes. Am an MPH student and currently working on my thesis proposal, this has really helped me understand some of the things I didn’t know.

I like your page..helpful

wonderful i got my concept crystal clear. thankyou!!

This is really helpful , thank you

Thank you so much this helped

Wonderfully explained

thank u so much, it was so informative

THANKYOU, this was very informative and very helpful

This is great GRADACOACH I am not a statistician but I require more of this in my thesis
Include me in your posts.

This is so great and fully useful. I would like to thank you again and again.

Glad to read this article. I’ve read lot of articles but this article is clear on all concepts. Thanks for sharing.

Thank you so much. This is a very good foundation and intro into quantitative data analysis. Appreciate!

You have a very impressive, simple but concise explanation of data analysis for Quantitative Research here. This is a God-send link for me to appreciate research more. Thank you so much!

Avery good presentation followed by the write up. yes you simplified statistics to make sense even to a layman like me. Thank so much keep it up. The presenter did ell too. i would like more of this for Qualitative and exhaust more of the test example like the Anova.

This is a very helpful article, couldn’t have been clearer. Thank you.

Awesome and phenomenal information.Well done

The video with the accompanying article is super helpful to demystify this topic. Very well done. Thank you so much.

thank you so much, your presentation helped me a lot

I don’t know how should I express that ur article is saviour for me 🥺😍

It is well defined information and thanks for sharing. It helps me a lot in understanding the statistical data.

I gain a lot and thanks for sharing brilliant ideas, so wish to be linked on your email update.

Very helpful and clear .Thank you Gradcoach.

Thank for sharing this article, well organized and information presented are very clear.

VERY INTERESTING AND SUPPORTIVE TO NEW RESEARCHERS LIKE ME. AT LEAST SOME BASICS ABOUT QUANTITATIVE.

An outstanding, well explained and helpful article. This will help me so much with my data analysis for my research project. Thank you!

wow this has just simplified everything i was scared of how i am gonna analyse my data but thanks to you i will be able to do so

simple and constant direction to research. thanks

This is helpful

Great writing!! Comprehensive and very helpful.

Do you provide any assistance for other steps of research methodology like making research problem testing hypothesis report and thesis writing?

Thank you so much for such useful article!

Amazing article. So nicely explained. Wow

Very insightfull. Thanks

I am doing a quality improvement project to determine if the implementation of a protocol will change prescribing habits. Would this be a t-test?

The is a very helpful blog, however, I’m still not sure how to analyze my data collected. I’m doing a research on “Free Education at the University of Guyana”

tnx. fruitful blog!

So I am writing exams and would like to know how do establish which method of data analysis to use from the below research questions: I am a bit lost as to how I determine the data analysis method from the research questions.
Do female employees report higher job satisfaction than male employees with similar job descriptions across the South African telecommunications sector? – I though that maybe Chi Square could be used here. – Is there a gender difference in talented employees’ actual turnover decisions across the South African telecommunications sector? T-tests or Correlation in this one. – Is there a gender difference in the cost of actual turnover decisions across the South African telecommunications sector? T-tests or Correlation in this one. – What practical recommendations can be made to the management of South African telecommunications companies on leveraging gender to mitigate employee turnover decisions?
Your assistance will be appreciated if I could get a response as early as possible tomorrow

This was quite helpful. Thank you so much.

wow I got a lot from this article, thank you very much, keep it up

Thanks for yhe guidance. Can you send me this guidance on my email? To enable offline reading?

Thank you very much, this service is very helpful.

Every novice researcher needs to read this article as it puts things so clear and easy to follow. Its been very helpful.

Wonderful!!!! you explained everything in a way that anyone can learn. Thank you!!

I really enjoyed reading though this. Very easy to follow. Thank you

Many thanks for your useful lecture, I would be really appreciated if you could possibly share with me the PPT of presentation related to Data type?

Thank you very much for sharing, I got much from this article

This is a very informative write-up. Kindly include me in your latest posts.

Very interesting mostly for social scientists

Thank you so much, very helpfull
You’re welcome 🙂

woow, its great, its very informative and well understood because of your way of writing like teaching in front of me in simple languages.

I have been struggling to understand a lot of these concepts. Thank you for the informative piece which is written with outstanding clarity.

very informative article. Easy to understand

Beautiful read, much needed.

Always greet intro and summary. I learn so much from GradCoach

Quite informative. Simple and clear summary.

I thoroughly enjoyed reading your informative and inspiring piece. Your profound insights into this topic truly provide a better understanding of its complexity. I agree with the points you raised, especially when you delved into the specifics of the article. In my opinion, that aspect is often overlooked and deserves further attention.

Absolutely!!! Thank you

Thank you very much for this post. It made me to understand how to do my data analysis.

its nice work and excellent job ,you have made my work easier
Submit a Comment Cancel reply
Your email address will not be published. Required fields are marked *
Save my name, email, and website in this browser for the next time I comment.
- Print Friendly
Quantitative Data Analysis: A Comprehensive Guide
By: Ofem Eteng | Published: May 18, 2022
Related Articles
A healthcare giant successfully introduces the most effective drug dosage through rigorous statistical modeling, saving countless lives. A marketing team predicts consumer trends with uncanny accuracy, tailoring campaigns for maximum impact.
Table of Contents
These trends and dosages are not just any numbers but are a result of meticulous quantitative data analysis. Quantitative data analysis offers a robust framework for understanding complex phenomena, evaluating hypotheses, and predicting future outcomes.
In this blog, we’ll walk through the concept of quantitative data analysis, the steps required, its advantages, and the methods and techniques that are used in this analysis. Read on!
What is Quantitative Data Analysis?
Quantitative data analysis is a systematic process of examining, interpreting, and drawing meaningful conclusions from numerical data. It involves the application of statistical methods, mathematical models, and computational techniques to understand patterns, relationships, and trends within datasets.
Quantitative data analysis methods typically work with algorithms, mathematical analysis tools, and software to gain insights from the data, answering questions such as how many, how often, and how much. Data for quantitative data analysis is usually collected from close-ended surveys, questionnaires, polls, etc. The data can also be obtained from sales figures, email click-through rates, number of website visitors, and percentage revenue increase.
Quantitative Data Analysis vs Qualitative Data Analysis
When we talk about data, we directly think about the pattern, the relationship, and the connection between the datasets – analyzing the data in short. Therefore when it comes to data analysis, there are broadly two types – Quantitative Data Analysis and Qualitative Data Analysis.
Quantitative data analysis revolves around numerical data and statistics, which are suitable for functions that can be counted or measured. In contrast, qualitative data analysis includes description and subjective information – for things that can be observed but not measured.
Let us differentiate between Quantitative Data Analysis and Quantitative Data Analysis for a better understanding.
Data Preparation Steps for Quantitative Data Analysis
Quantitative data has to be gathered and cleaned before proceeding to the stage of analyzing it. Below are the steps to prepare a data before quantitative research analysis:
- Step 1: Data Collection
Before beginning the analysis process, you need data. Data can be collected through rigorous quantitative research, which includes methods such as interviews, focus groups, surveys, and questionnaires.
- Step 2: Data Cleaning
Once the data is collected, begin the data cleaning process by scanning through the entire data for duplicates, errors, and omissions. Keep a close eye for outliers (data points that are significantly different from the majority of the dataset) because they can skew your analysis results if they are not removed.
This data-cleaning process ensures data accuracy, consistency and relevancy before analysis.
- Step 3: Data Analysis and Interpretation
Now that you have collected and cleaned your data, it is now time to carry out the quantitative analysis. There are two methods of quantitative data analysis, which we will discuss in the next section.
However, if you have data from multiple sources, collecting and cleaning it can be a cumbersome task. This is where Hevo Data steps in. With Hevo, extracting, transforming, and loading data from source to destination becomes a seamless task, eliminating the need for manual coding. This not only saves valuable time but also enhances the overall efficiency of data analysis and visualization, empowering users to derive insights quickly and with precision
Hevo is the only real-time ELT No-code Data Pipeline platform that cost-effectively automates data pipelines that are flexible to your needs. With integration with 150+ Data Sources (40+ free sources), we help you not only export data from sources & load data to the destinations but also transform & enrich your data, & make it analysis-ready.
Start for free now!
Now that you are familiar with what quantitative data analysis is and how to prepare your data for analysis, the focus will shift to the purpose of this article, which is to describe the methods and techniques of quantitative data analysis.
Methods and Techniques of Quantitative Data Analysis
Quantitative data analysis employs two techniques to extract meaningful insights from datasets, broadly. The first method is descriptive statistics, which summarizes and portrays essential features of a dataset, such as mean, median, and standard deviation.
Inferential statistics, the second method, extrapolates insights and predictions from a sample dataset to make broader inferences about an entire population, such as hypothesis testing and regression analysis.
An in-depth explanation of both the methods is provided below:
- Descriptive Statistics
- Inferential Statistics
1) Descriptive Statistics
Descriptive statistics as the name implies is used to describe a dataset. It helps understand the details of your data by summarizing it and finding patterns from the specific data sample. They provide absolute numbers obtained from a sample but do not necessarily explain the rationale behind the numbers and are mostly used for analyzing single variables. The methods used in descriptive statistics include:
- Mean: This calculates the numerical average of a set of values.
- Median: This is used to get the midpoint of a set of values when the numbers are arranged in numerical order.
- Mode: This is used to find the most commonly occurring value in a dataset.
- Percentage: This is used to express how a value or group of respondents within the data relates to a larger group of respondents.
- Frequency: This indicates the number of times a value is found.
- Range: This shows the highest and lowest values in a dataset.
- Standard Deviation: This is used to indicate how dispersed a range of numbers is, meaning, it shows how close all the numbers are to the mean.
- Skewness: It indicates how symmetrical a range of numbers is, showing if they cluster into a smooth bell curve shape in the middle of the graph or if they skew towards the left or right.
2) Inferential Statistics
In quantitative analysis, the expectation is to turn raw numbers into meaningful insight using numerical values, and descriptive statistics is all about explaining details of a specific dataset using numbers, but it does not explain the motives behind the numbers; hence, a need for further analysis using inferential statistics.
Inferential statistics aim to make predictions or highlight possible outcomes from the analyzed data obtained from descriptive statistics. They are used to generalize results and make predictions between groups, show relationships that exist between multiple variables, and are used for hypothesis testing that predicts changes or differences.
There are various statistical analysis methods used within inferential statistics; a few are discussed below.
- Cross Tabulations: Cross tabulation or crosstab is used to show the relationship that exists between two variables and is often used to compare results by demographic groups. It uses a basic tabular form to draw inferences between different data sets and contains data that is mutually exclusive or has some connection with each other. Crosstabs help understand the nuances of a dataset and factors that may influence a data point.
- Regression Analysis: Regression analysis estimates the relationship between a set of variables. It shows the correlation between a dependent variable (the variable or outcome you want to measure or predict) and any number of independent variables (factors that may impact the dependent variable). Therefore, the purpose of the regression analysis is to estimate how one or more variables might affect a dependent variable to identify trends and patterns to make predictions and forecast possible future trends. There are many types of regression analysis, and the model you choose will be determined by the type of data you have for the dependent variable. The types of regression analysis include linear regression, non-linear regression, binary logistic regression, etc.
- Monte Carlo Simulation: Monte Carlo simulation, also known as the Monte Carlo method, is a computerized technique of generating models of possible outcomes and showing their probability distributions. It considers a range of possible outcomes and then tries to calculate how likely each outcome will occur. Data analysts use it to perform advanced risk analyses to help forecast future events and make decisions accordingly.
- Analysis of Variance (ANOVA): This is used to test the extent to which two or more groups differ from each other. It compares the mean of various groups and allows the analysis of multiple groups.
- Factor Analysis: A large number of variables can be reduced into a smaller number of factors using the factor analysis technique. It works on the principle that multiple separate observable variables correlate with each other because they are all associated with an underlying construct. It helps in reducing large datasets into smaller, more manageable samples.
- Cohort Analysis: Cohort analysis can be defined as a subset of behavioral analytics that operates from data taken from a given dataset. Rather than looking at all users as one unit, cohort analysis breaks down data into related groups for analysis, where these groups or cohorts usually have common characteristics or similarities within a defined period.
- MaxDiff Analysis: This is a quantitative data analysis method that is used to gauge customers’ preferences for purchase and what parameters rank higher than the others in the process.
- Cluster Analysis: Cluster analysis is a technique used to identify structures within a dataset. Cluster analysis aims to be able to sort different data points into groups that are internally similar and externally different; that is, data points within a cluster will look like each other and different from data points in other clusters.
- Time Series Analysis: This is a statistical analytic technique used to identify trends and cycles over time. It is simply the measurement of the same variables at different times, like weekly and monthly email sign-ups, to uncover trends, seasonality, and cyclic patterns. By doing this, the data analyst can forecast how variables of interest may fluctuate in the future.
- SWOT analysis: This is a quantitative data analysis method that assigns numerical values to indicate strengths, weaknesses, opportunities, and threats of an organization, product, or service to show a clearer picture of competition to foster better business strategies
How to Choose the Right Method for your Analysis?
Choosing between Descriptive Statistics or Inferential Statistics can be often confusing. You should consider the following factors before choosing the right method for your quantitative data analysis:
1. Type of Data
The first consideration in data analysis is understanding the type of data you have. Different statistical methods have specific requirements based on these data types, and using the wrong method can render results meaningless. The choice of statistical method should align with the nature and distribution of your data to ensure meaningful and accurate analysis.
2. Your Research Questions
When deciding on statistical methods, it’s crucial to align them with your specific research questions and hypotheses. The nature of your questions will influence whether descriptive statistics alone, which reveal sample attributes, are sufficient or if you need both descriptive and inferential statistics to understand group differences or relationships between variables and make population inferences.
Pros and Cons of Quantitative Data Analysis
1. Objectivity and Generalizability:
- Quantitative data analysis offers objective, numerical measurements, minimizing bias and personal interpretation.
- Results can often be generalized to larger populations, making them applicable to broader contexts.
Example: A study using quantitative data analysis to measure student test scores can objectively compare performance across different schools and demographics, leading to generalizable insights about educational strategies.
2. Precision and Efficiency:
- Statistical methods provide precise numerical results, allowing for accurate comparisons and prediction.
- Large datasets can be analyzed efficiently with the help of computer software, saving time and resources.
Example: A marketing team can use quantitative data analysis to precisely track click-through rates and conversion rates on different ad campaigns, quickly identifying the most effective strategies for maximizing customer engagement.
3. Identification of Patterns and Relationships:
- Statistical techniques reveal hidden patterns and relationships between variables that might not be apparent through observation alone.
- This can lead to new insights and understanding of complex phenomena.
Example: A medical researcher can use quantitative analysis to pinpoint correlations between lifestyle factors and disease risk, aiding in the development of prevention strategies.
1. Limited Scope:
- Quantitative analysis focuses on quantifiable aspects of a phenomenon , potentially overlooking important qualitative nuances, such as emotions, motivations, or cultural contexts.
Example: A survey measuring customer satisfaction with numerical ratings might miss key insights about the underlying reasons for their satisfaction or dissatisfaction, which could be better captured through open-ended feedback.
2. Oversimplification:
- Reducing complex phenomena to numerical data can lead to oversimplification and a loss of richness in understanding.
Example: Analyzing employee productivity solely through quantitative metrics like hours worked or tasks completed might not account for factors like creativity, collaboration, or problem-solving skills, which are crucial for overall performance.
3. Potential for Misinterpretation:
- Statistical results can be misinterpreted if not analyzed carefully and with appropriate expertise.
- The choice of statistical methods and assumptions can significantly influence results.
This blog discusses the steps, methods, and techniques of quantitative data analysis. It also gives insights into the methods of data collection, the type of data one should work with, and the pros and cons of such analysis.
Gain a better understanding of data analysis with these essential reads:
- Data Analysis and Modeling: 4 Critical Differences
- Exploratory Data Analysis Simplified 101
- 25 Best Data Analysis Tools in 2024
Carrying out successful data analysis requires prepping the data and making it analysis-ready. That is where Hevo steps in.
Want to give Hevo a try? Sign Up for a 14-day free trial and experience the feature-rich Hevo suite first hand. You may also have a look at the amazing Hevo price , which will assist you in selecting the best plan for your requirements.
Share your experience of understanding Quantitative Data Analysis in the comment section below! We would love to hear your thoughts.

Ofem is a freelance writer specializing in data-related topics, who has expertise in translating complex concepts. With a focus on data science, analytics, and emerging technologies.
No-code Data Pipeline for your Data Warehouse
- Data Analysis
- Data Warehouse
- Quantitative Data Analysis
Continue Reading

Riya Bothra
A Guide to Effective Data Cleaning Tools in Python

Data Quality Management Techniques and Best Practices

Data Quality Monitoring: A Guide to Ensure Data Integrity
I want to read this e-book.
Have a language expert improve your writing
Run a free plagiarism check in 10 minutes, automatically generate references for free.
- Knowledge Base
- Methodology
- What Is Quantitative Research? | Definition & Methods
What Is Quantitative Research? | Definition & Methods
Published on 4 April 2022 by Pritha Bhandari . Revised on 10 October 2022.
Quantitative research is the process of collecting and analysing numerical data. It can be used to find patterns and averages, make predictions, test causal relationships, and generalise results to wider populations.
Quantitative research is the opposite of qualitative research , which involves collecting and analysing non-numerical data (e.g. text, video, or audio).
Quantitative research is widely used in the natural and social sciences: biology, chemistry, psychology, economics, sociology, marketing, etc.
- What is the demographic makeup of Singapore in 2020?
- How has the average temperature changed globally over the last century?
- Does environmental pollution affect the prevalence of honey bees?
- Does working from home increase productivity for people with long commutes?
Table of contents
Quantitative research methods, quantitative data analysis, advantages of quantitative research, disadvantages of quantitative research, frequently asked questions about quantitative research.
You can use quantitative research methods for descriptive, correlational or experimental research.
- In descriptive research , you simply seek an overall summary of your study variables.
- In correlational research , you investigate relationships between your study variables.
- In experimental research , you systematically examine whether there is a cause-and-effect relationship between variables.
Correlational and experimental research can both be used to formally test hypotheses , or predictions, using statistics. The results may be generalised to broader populations based on the sampling method used.
To collect quantitative data, you will often need to use operational definitions that translate abstract concepts (e.g., mood) into observable and quantifiable measures (e.g., self-ratings of feelings and energy levels).
Prevent plagiarism, run a free check.
Once data is collected, you may need to process it before it can be analysed. For example, survey and test data may need to be transformed from words to numbers. Then, you can use statistical analysis to answer your research questions .
Descriptive statistics will give you a summary of your data and include measures of averages and variability. You can also use graphs, scatter plots and frequency tables to visualise your data and check for any trends or outliers.
Using inferential statistics , you can make predictions or generalisations based on your data. You can test your hypothesis or use your sample data to estimate the population parameter .
You can also assess the reliability and validity of your data collection methods to indicate how consistently and accurately your methods actually measured what you wanted them to.
Quantitative research is often used to standardise data collection and generalise findings . Strengths of this approach include:
- Replication
Repeating the study is possible because of standardised data collection protocols and tangible definitions of abstract concepts.
- Direct comparisons of results
The study can be reproduced in other cultural settings, times or with different groups of participants. Results can be compared statistically.
- Large samples
Data from large samples can be processed and analysed using reliable and consistent procedures through quantitative data analysis.
- Hypothesis testing
Using formalised and established hypothesis testing procedures means that you have to carefully consider and report your research variables, predictions, data collection and testing methods before coming to a conclusion.
Despite the benefits of quantitative research, it is sometimes inadequate in explaining complex research topics. Its limitations include:
- Superficiality
Using precise and restrictive operational definitions may inadequately represent complex concepts. For example, the concept of mood may be represented with just a number in quantitative research, but explained with elaboration in qualitative research.
- Narrow focus
Predetermined variables and measurement procedures can mean that you ignore other relevant observations.
- Structural bias
Despite standardised procedures, structural biases can still affect quantitative research. Missing data , imprecise measurements or inappropriate sampling methods are biases that can lead to the wrong conclusions.
- Lack of context
Quantitative research often uses unnatural settings like laboratories or fails to consider historical and cultural contexts that may affect data collection and results.
Quantitative research deals with numbers and statistics, while qualitative research deals with words and meanings.
Quantitative methods allow you to test a hypothesis by systematically collecting and analysing data, while qualitative methods allow you to explore ideas and experiences in depth.
In mixed methods research , you use both qualitative and quantitative data collection and analysis methods to answer your research question .
Data collection is the systematic process by which observations or measurements are gathered in research. It is used in many different contexts by academics, governments, businesses, and other organisations.
Operationalisation means turning abstract conceptual ideas into measurable observations.
For example, the concept of social anxiety isn’t directly observable, but it can be operationally defined in terms of self-rating scores, behavioural avoidance of crowded places, or physical anxiety symptoms in social situations.
Before collecting data , it’s important to consider how you will operationalise the variables that you want to measure.
Reliability and validity are both about how well a method measures something:
- Reliability refers to the consistency of a measure (whether the results can be reproduced under the same conditions).
- Validity refers to the accuracy of a measure (whether the results really do represent what they are supposed to measure).
If you are doing experimental research , you also have to consider the internal and external validity of your experiment.
Hypothesis testing is a formal procedure for investigating our ideas about the world using statistics. It is used by scientists to test specific predictions, called hypotheses , by calculating how likely it is that a pattern or relationship between variables could have arisen by chance.
Cite this Scribbr article
If you want to cite this source, you can copy and paste the citation or click the ‘Cite this Scribbr article’ button to automatically add the citation to our free Reference Generator.
Bhandari, P. (2022, October 10). What Is Quantitative Research? | Definition & Methods. Scribbr. Retrieved 6 May 2024, from https://www.scribbr.co.uk/research-methods/introduction-to-quantitative-research/
Is this article helpful?

Pritha Bhandari
- Skip to main content
- Skip to primary sidebar
- Skip to footer
- QuestionPro

- Solutions Industries Gaming Automotive Sports and events Education Government Travel & Hospitality Financial Services Healthcare Cannabis Technology Use Case NPS+ Communities Audience Contactless surveys Mobile LivePolls Member Experience GDPR Positive People Science 360 Feedback Surveys
- Resources Blog eBooks Survey Templates Case Studies Training Help center
Home Market Research
Data Analysis in Research: Types & Methods

Content Index
Why analyze data in research?
Types of data in research, finding patterns in the qualitative data, methods used for data analysis in qualitative research, preparing data for analysis, methods used for data analysis in quantitative research, considerations in research data analysis, what is data analysis in research.
Definition of research in data analysis: According to LeCompte and Schensul, research data analysis is a process used by researchers to reduce data to a story and interpret it to derive insights. The data analysis process helps reduce a large chunk of data into smaller fragments, which makes sense.
Three essential things occur during the data analysis process — the first is data organization . Summarization and categorization together contribute to becoming the second known method used for data reduction. It helps find patterns and themes in the data for easy identification and linking. The third and last way is data analysis – researchers do it in both top-down and bottom-up fashion.
LEARN ABOUT: Research Process Steps
On the other hand, Marshall and Rossman describe data analysis as a messy, ambiguous, and time-consuming but creative and fascinating process through which a mass of collected data is brought to order, structure and meaning.
We can say that “the data analysis and data interpretation is a process representing the application of deductive and inductive logic to the research and data analysis.”
Researchers rely heavily on data as they have a story to tell or research problems to solve. It starts with a question, and data is nothing but an answer to that question. But, what if there is no question to ask? Well! It is possible to explore data even without a problem – we call it ‘Data Mining’, which often reveals some interesting patterns within the data that are worth exploring.
Irrelevant to the type of data researchers explore, their mission and audiences’ vision guide them to find the patterns to shape the story they want to tell. One of the essential things expected from researchers while analyzing data is to stay open and remain unbiased toward unexpected patterns, expressions, and results. Remember, sometimes, data analysis tells the most unforeseen yet exciting stories that were not expected when initiating data analysis. Therefore, rely on the data you have at hand and enjoy the journey of exploratory research.
Create a Free Account
Every kind of data has a rare quality of describing things after assigning a specific value to it. For analysis, you need to organize these values, processed and presented in a given context, to make it useful. Data can be in different forms; here are the primary data types.
- Qualitative data: When the data presented has words and descriptions, then we call it qualitative data . Although you can observe this data, it is subjective and harder to analyze data in research, especially for comparison. Example: Quality data represents everything describing taste, experience, texture, or an opinion that is considered quality data. This type of data is usually collected through focus groups, personal qualitative interviews , qualitative observation or using open-ended questions in surveys.
- Quantitative data: Any data expressed in numbers of numerical figures are called quantitative data . This type of data can be distinguished into categories, grouped, measured, calculated, or ranked. Example: questions such as age, rank, cost, length, weight, scores, etc. everything comes under this type of data. You can present such data in graphical format, charts, or apply statistical analysis methods to this data. The (Outcomes Measurement Systems) OMS questionnaires in surveys are a significant source of collecting numeric data.
- Categorical data: It is data presented in groups. However, an item included in the categorical data cannot belong to more than one group. Example: A person responding to a survey by telling his living style, marital status, smoking habit, or drinking habit comes under the categorical data. A chi-square test is a standard method used to analyze this data.
Learn More : Examples of Qualitative Data in Education
Data analysis in qualitative research
Data analysis and qualitative data research work a little differently from the numerical data as the quality data is made up of words, descriptions, images, objects, and sometimes symbols. Getting insight from such complicated information is a complicated process. Hence it is typically used for exploratory research and data analysis .
Although there are several ways to find patterns in the textual information, a word-based method is the most relied and widely used global technique for research and data analysis. Notably, the data analysis process in qualitative research is manual. Here the researchers usually read the available data and find repetitive or commonly used words.
For example, while studying data collected from African countries to understand the most pressing issues people face, researchers might find “food” and “hunger” are the most commonly used words and will highlight them for further analysis.
LEARN ABOUT: Level of Analysis
The keyword context is another widely used word-based technique. In this method, the researcher tries to understand the concept by analyzing the context in which the participants use a particular keyword.
For example , researchers conducting research and data analysis for studying the concept of ‘diabetes’ amongst respondents might analyze the context of when and how the respondent has used or referred to the word ‘diabetes.’
The scrutiny-based technique is also one of the highly recommended text analysis methods used to identify a quality data pattern. Compare and contrast is the widely used method under this technique to differentiate how a specific text is similar or different from each other.
For example: To find out the “importance of resident doctor in a company,” the collected data is divided into people who think it is necessary to hire a resident doctor and those who think it is unnecessary. Compare and contrast is the best method that can be used to analyze the polls having single-answer questions types .
Metaphors can be used to reduce the data pile and find patterns in it so that it becomes easier to connect data with theory.
Variable Partitioning is another technique used to split variables so that researchers can find more coherent descriptions and explanations from the enormous data.
LEARN ABOUT: Qualitative Research Questions and Questionnaires
There are several techniques to analyze the data in qualitative research, but here are some commonly used methods,
- Content Analysis: It is widely accepted and the most frequently employed technique for data analysis in research methodology. It can be used to analyze the documented information from text, images, and sometimes from the physical items. It depends on the research questions to predict when and where to use this method.
- Narrative Analysis: This method is used to analyze content gathered from various sources such as personal interviews, field observation, and surveys . The majority of times, stories, or opinions shared by people are focused on finding answers to the research questions.
- Discourse Analysis: Similar to narrative analysis, discourse analysis is used to analyze the interactions with people. Nevertheless, this particular method considers the social context under which or within which the communication between the researcher and respondent takes place. In addition to that, discourse analysis also focuses on the lifestyle and day-to-day environment while deriving any conclusion.
- Grounded Theory: When you want to explain why a particular phenomenon happened, then using grounded theory for analyzing quality data is the best resort. Grounded theory is applied to study data about the host of similar cases occurring in different settings. When researchers are using this method, they might alter explanations or produce new ones until they arrive at some conclusion.
LEARN ABOUT: 12 Best Tools for Researchers
Data analysis in quantitative research
The first stage in research and data analysis is to make it for the analysis so that the nominal data can be converted into something meaningful. Data preparation consists of the below phases.
Phase I: Data Validation
Data validation is done to understand if the collected data sample is per the pre-set standards, or it is a biased data sample again divided into four different stages
- Fraud: To ensure an actual human being records each response to the survey or the questionnaire
- Screening: To make sure each participant or respondent is selected or chosen in compliance with the research criteria
- Procedure: To ensure ethical standards were maintained while collecting the data sample
- Completeness: To ensure that the respondent has answered all the questions in an online survey. Else, the interviewer had asked all the questions devised in the questionnaire.
Phase II: Data Editing
More often, an extensive research data sample comes loaded with errors. Respondents sometimes fill in some fields incorrectly or sometimes skip them accidentally. Data editing is a process wherein the researchers have to confirm that the provided data is free of such errors. They need to conduct necessary checks and outlier checks to edit the raw edit and make it ready for analysis.
Phase III: Data Coding
Out of all three, this is the most critical phase of data preparation associated with grouping and assigning values to the survey responses . If a survey is completed with a 1000 sample size, the researcher will create an age bracket to distinguish the respondents based on their age. Thus, it becomes easier to analyze small data buckets rather than deal with the massive data pile.
LEARN ABOUT: Steps in Qualitative Research
After the data is prepared for analysis, researchers are open to using different research and data analysis methods to derive meaningful insights. For sure, statistical analysis plans are the most favored to analyze numerical data. In statistical analysis, distinguishing between categorical data and numerical data is essential, as categorical data involves distinct categories or labels, while numerical data consists of measurable quantities. The method is again classified into two groups. First, ‘Descriptive Statistics’ used to describe data. Second, ‘Inferential statistics’ that helps in comparing the data .
Descriptive statistics
This method is used to describe the basic features of versatile types of data in research. It presents the data in such a meaningful way that pattern in the data starts making sense. Nevertheless, the descriptive analysis does not go beyond making conclusions. The conclusions are again based on the hypothesis researchers have formulated so far. Here are a few major types of descriptive analysis methods.
Measures of Frequency
- Count, Percent, Frequency
- It is used to denote home often a particular event occurs.
- Researchers use it when they want to showcase how often a response is given.
Measures of Central Tendency
- Mean, Median, Mode
- The method is widely used to demonstrate distribution by various points.
- Researchers use this method when they want to showcase the most commonly or averagely indicated response.
Measures of Dispersion or Variation
- Range, Variance, Standard deviation
- Here the field equals high/low points.
- Variance standard deviation = difference between the observed score and mean
- It is used to identify the spread of scores by stating intervals.
- Researchers use this method to showcase data spread out. It helps them identify the depth until which the data is spread out that it directly affects the mean.
Measures of Position
- Percentile ranks, Quartile ranks
- It relies on standardized scores helping researchers to identify the relationship between different scores.
- It is often used when researchers want to compare scores with the average count.
For quantitative research use of descriptive analysis often give absolute numbers, but the in-depth analysis is never sufficient to demonstrate the rationale behind those numbers. Nevertheless, it is necessary to think of the best method for research and data analysis suiting your survey questionnaire and what story researchers want to tell. For example, the mean is the best way to demonstrate the students’ average scores in schools. It is better to rely on the descriptive statistics when the researchers intend to keep the research or outcome limited to the provided sample without generalizing it. For example, when you want to compare average voting done in two different cities, differential statistics are enough.
Descriptive analysis is also called a ‘univariate analysis’ since it is commonly used to analyze a single variable.
Inferential statistics
Inferential statistics are used to make predictions about a larger population after research and data analysis of the representing population’s collected sample. For example, you can ask some odd 100 audiences at a movie theater if they like the movie they are watching. Researchers then use inferential statistics on the collected sample to reason that about 80-90% of people like the movie.
Here are two significant areas of inferential statistics.
- Estimating parameters: It takes statistics from the sample research data and demonstrates something about the population parameter.
- Hypothesis test: I t’s about sampling research data to answer the survey research questions. For example, researchers might be interested to understand if the new shade of lipstick recently launched is good or not, or if the multivitamin capsules help children to perform better at games.
These are sophisticated analysis methods used to showcase the relationship between different variables instead of describing a single variable. It is often used when researchers want something beyond absolute numbers to understand the relationship between variables.
Here are some of the commonly used methods for data analysis in research.
- Correlation: When researchers are not conducting experimental research or quasi-experimental research wherein the researchers are interested to understand the relationship between two or more variables, they opt for correlational research methods.
- Cross-tabulation: Also called contingency tables, cross-tabulation is used to analyze the relationship between multiple variables. Suppose provided data has age and gender categories presented in rows and columns. A two-dimensional cross-tabulation helps for seamless data analysis and research by showing the number of males and females in each age category.
- Regression analysis: For understanding the strong relationship between two variables, researchers do not look beyond the primary and commonly used regression analysis method, which is also a type of predictive analysis used. In this method, you have an essential factor called the dependent variable. You also have multiple independent variables in regression analysis. You undertake efforts to find out the impact of independent variables on the dependent variable. The values of both independent and dependent variables are assumed as being ascertained in an error-free random manner.
- Frequency tables: The statistical procedure is used for testing the degree to which two or more vary or differ in an experiment. A considerable degree of variation means research findings were significant. In many contexts, ANOVA testing and variance analysis are similar.
- Analysis of variance: The statistical procedure is used for testing the degree to which two or more vary or differ in an experiment. A considerable degree of variation means research findings were significant. In many contexts, ANOVA testing and variance analysis are similar.
- Researchers must have the necessary research skills to analyze and manipulation the data , Getting trained to demonstrate a high standard of research practice. Ideally, researchers must possess more than a basic understanding of the rationale of selecting one statistical method over the other to obtain better data insights.
- Usually, research and data analytics projects differ by scientific discipline; therefore, getting statistical advice at the beginning of analysis helps design a survey questionnaire, select data collection methods , and choose samples.
LEARN ABOUT: Best Data Collection Tools
- The primary aim of data research and analysis is to derive ultimate insights that are unbiased. Any mistake in or keeping a biased mind to collect data, selecting an analysis method, or choosing audience sample il to draw a biased inference.
- Irrelevant to the sophistication used in research data and analysis is enough to rectify the poorly defined objective outcome measurements. It does not matter if the design is at fault or intentions are not clear, but lack of clarity might mislead readers, so avoid the practice.
- The motive behind data analysis in research is to present accurate and reliable data. As far as possible, avoid statistical errors, and find a way to deal with everyday challenges like outliers, missing data, data altering, data mining , or developing graphical representation.
LEARN MORE: Descriptive Research vs Correlational Research The sheer amount of data generated daily is frightening. Especially when data analysis has taken center stage. in 2018. In last year, the total data supply amounted to 2.8 trillion gigabytes. Hence, it is clear that the enterprises willing to survive in the hypercompetitive world must possess an excellent capability to analyze complex research data, derive actionable insights, and adapt to the new market needs.
LEARN ABOUT: Average Order Value
QuestionPro is an online survey platform that empowers organizations in data analysis and research and provides them a medium to collect data by creating appealing surveys.
MORE LIKE THIS

The Best Email Survey Tool to Boost Your Feedback Game
May 7, 2024

Top 10 Employee Engagement Survey Tools

Top 20 Employee Engagement Software Solutions
May 3, 2024

15 Best Customer Experience Software of 2024
May 2, 2024
Other categories
- Academic Research
- Artificial Intelligence
- Assessments
- Brand Awareness
- Case Studies
- Communities
- Consumer Insights
- Customer effort score
- Customer Engagement
- Customer Experience
- Customer Loyalty
- Customer Research
- Customer Satisfaction
- Employee Benefits
- Employee Engagement
- Employee Retention
- Friday Five
- General Data Protection Regulation
- Insights Hub
- Life@QuestionPro
- Market Research
- Mobile diaries
- Mobile Surveys
- New Features
- Online Communities
- Question Types
- Questionnaire
- QuestionPro Products
- Release Notes
- Research Tools and Apps
- Revenue at Risk
- Survey Templates
- Training Tips
- Uncategorized
- Video Learning Series
- What’s Coming Up
- Workforce Intelligence
Part II: Data Analysis Methods in Quantitative Research
Data analysis methods in quantitative research.
We started this module with levels of measurement as a way to categorize our data. Data analysis is directed toward answering the original research question and achieving the study purpose (or aim). Now, we are going to delve into two main statistical analyses to describe our data and make inferences about our data:
Descriptive Statistics and Inferential Statistics.
Descriptive Statistics:
Before you panic, we will not be going into statistical analyses very deeply. We want to simply get a good overview of some of the types of general statistical analyses so that it makes some sense to us when we read results in published research articles.
Descriptive statistics summarize or describe the characteristics of a data set. This is a method of simply organizing and describing our data. Why? Because data that are not organized in some fashion are super difficult to interpret.
Let’s say our sample is golden retrievers (population “canines”). Our descriptive statistics tell us more about the same.
- 37% of our sample is male, 43% female
- The mean age is 4 years
- Mode is 6 years
- Median age is 5.5 years

Let’s explore some of the types of descriptive statistics.
Frequency Distributions : A frequency distribution describes the number of observations for each possible value of a measured variable. The numbers are arranged from lowest to highest and features a count of how many times each value occurred.
For example, if 18 students have pet dogs, dog ownership has a frequency of 18.
We might see what other types of pets that students have. Maybe cats, fish, and hamsters. We find that 2 students have hamsters, 9 have fish, 1 has a cat.
You can see that it is very difficult to interpret the various pets into any meaningful interpretation, yes?
Now, let’s take those same pets and place them in a frequency distribution table.
As we can now see, this is much easier to interpret.
Let’s say that we want to know how many books our sample population of students have read in the last year. We collect our data and find this:
We can then take that table and plot it out on a frequency distribution graph. This makes it much easier to see how the numbers are disbursed. Easier on the eyes, yes?

Here’s another example of symmetrical, positive skew, and negative skew:

Correlation : Relationships between two research variables are called correlations . Remember, correlation is not cause-and-effect. Correlations simply measure the extent of relationship between two variables. To measure correlation in descriptive statistics, the statistical analysis called Pearson’s correlation coefficient I is often used. You do not need to know how to calculate this for this course. But, do remember that analysis test because you will often see this in published research articles. There really are no set guidelines on what measurement constitutes a “strong” or “weak” correlation, as it really depends on the variables being measured.
However, possible values for correlation coefficients range from -1.00 through .00 to +1.00. A value of +1 means that the two variables are positively correlated, as one variable goes up, the other goes up. A value of r = 0 means that the two variables are not linearly related.
Often, the data will be presented on a scatter plot. Here, we can view the data and there appears to be a straight line (linear) trend between height and weight. The association (or correlation) is positive. That means, that there is a weight increase with height. The Pearson correlation coefficient in this case was r = 0.56.

A type I error is made by rejecting a null hypothesis that is true. This means that there was no difference but the researcher concluded that the hypothesis was true.
A type II error is made by accepting that the null hypothesis is true when, in fact, it was false. Meaning there was actually a difference but the researcher did not think their hypothesis was supported.
Hypothesis Testing Procedures : In a general sense, the overall testing of a hypothesis has a systematic methodology. Remember, a hypothesis is an educated guess about the outcome. If we guess wrong, we might set up the tests incorrectly and might get results that are invalid. Sometimes, this is super difficult to get right. The main purpose of statistics is to test a hypothesis.
- Selecting a statistical test. Lots of factors go into this, including levels of measurement of the variables.
- Specifying the level of significance. Usually 0.05 is chosen.
- Computing a test statistic. Lots of software programs to help with this.
- Determining degrees of freedom ( df ). This refers to the number of observations free to vary about a parameter. Computing this is easy (but you don’t need to know how for this course).
- Comparing the test statistic to a theoretical value. Theoretical values exist for all test statistics, which is compared to the study statistics to help establish significance.
Some of the common inferential statistics you will see include:
Comparison tests: Comparison tests look for differences among group means. They can be used to test the effect of a categorical variable on the mean value of some other characteristic.
T-tests are used when comparing the means of precisely two groups (e.g., the average heights of men and women). ANOVA and MANOVA tests are used when comparing the means of more than two groups (e.g., the average heights of children, teenagers, and adults).
- t -tests (compares differences in two groups) – either paired t-test (example: What is the effect of two different test prep programs on the average exam scores for students from the same class?) or independent t-test (example: What is the difference in average exam scores for students from two different schools?)
- analysis of variance (ANOVA, which compares differences in three or more groups) (example: What is the difference in average pain levels among post-surgical patients given three different painkillers?) or MANOVA (compares differences in three or more groups, and 2 or more outcomes) (example: What is the effect of flower species on petal length, petal width, and stem length?)
Correlation tests: Correlation tests check whether variables are related without hypothesizing a cause-and-effect relationship.
- Pearson r (measures the strength and direction of the relationship between two variables) (example: How are latitude and temperature related?)
Nonparametric tests: Non-parametric tests don’t make as many assumptions about the data, and are useful when one or more of the common statistical assumptions are violated. However, the inferences they make aren’t as strong as with parametric tests.
- chi-squared ( X 2 ) test (measures differences in proportions). Chi-square tests are often used to test hypotheses. The chi-square statistic compares the size of any discrepancies between the expected results and the actual results, given the size of the sample and the number of variables in the relationship. For example, the results of tossing a fair coin meet these criteria. We can apply a chi-square test to determine which type of candy is most popular and make sure that our shelves are well stocked. Or maybe you’re a scientist studying the offspring of cats to determine the likelihood of certain genetic traits being passed to a litter of kittens.
Inferential Versus Descriptive Statistics Summary Table
Statistical Significance Versus Clinical Significance
Finally, when it comes to statistical significance in hypothesis testing, the normal probability value in nursing is <0.05. A p=value (probability) is a statistical measurement used to validate a hypothesis against measured data in the study. Meaning, it measures the likelihood that the results were actually observed due to the intervention, or if the results were just due by chance. The p-value, in measuring the probability of obtaining the observed results, assumes the null hypothesis is true.
The lower the p-value, the greater the statistical significance of the observed difference.
In the example earlier about our diabetic patients receiving online diet education, let’s say we had p = 0.05. Would that be a statistically significant result?
If you answered yes, you are correct!
What if our result was p = 0.8?
Not significant. Good job!
That’s pretty straightforward, right? Below 0.05, significant. Over 0.05 not significant.
Could we have significance clinically even if we do not have statistically significant results? Yes. Let’s explore this a bit.
Statistical hypothesis testing provides little information for interpretation purposes. It’s pretty mathematical and we can still get it wrong. Additionally, attaining statistical significance does not really state whether a finding is clinically meaningful. With a large enough sample, even a small very tiny relationship may be statistically significant. But, clinical significance is the practical importance of research. Meaning, we need to ask what the palpable effects may be on the lives of patients or healthcare decisions.
Remember, hypothesis testing cannot prove. It also cannot tell us much other than “yeah, it’s probably likely that there would be some change with this intervention”. Hypothesis testing tells us the likelihood that the outcome was due to an intervention or influence and not just by chance. Also, as nurses and clinicians, we are not concerned with a group of people – we are concerned at the individual, holistic level. The goal of evidence-based practice is to use best evidence for decisions about specific individual needs.
Additionally, begin your Discussion section. What are the implications to practice? Is there little evidence or a lot? Would you recommend additional studies? If so, what type of study would you recommend, and why?
- Were all the important results discussed?
- Did the researchers discuss any study limitations and their possible effects on the credibility of the findings? In discussing limitations, were key threats to the study’s validity and possible biases reviewed? Did the interpretations take limitations into account?
- What types of evidence were offered in support of the interpretation, and was that evidence persuasive? Were results interpreted in light of findings from other studies?
- Did the researchers make any unjustifiable causal inferences? Were alternative explanations for the findings considered? Were the rationales for rejecting these alternatives convincing?
- Did the interpretation consider the precision of the results and/or the magnitude of effects?
- Did the researchers draw any unwarranted conclusions about the generalizability of the results?
- Did the researchers discuss the study’s implications for clinical practice or future nursing research? Did they make specific recommendations?
- If yes, are the stated implications appropriate, given the study’s limitations and the magnitude of the effects as well as evidence from other studies? Are there important implications that the report neglected to include?
- Did the researchers mention or assess clinical significance? Did they make a distinction between statistical and clinical significance?
- If clinical significance was examined, was it assessed in terms of group-level information (e.g., effect sizes) or individual-level results? How was clinical significance operationalized?
References & Attribution
“ Green check mark ” by rawpixel licensed CC0 .
“ Magnifying glass ” by rawpixel licensed CC0
“ Orange flame ” by rawpixel licensed CC0 .
Polit, D. & Beck, C. (2021). Lippincott CoursePoint Enhanced for Polit’s Essentials of Nursing Research (10th ed.). Wolters Kluwer Health
Vaid, N. K. (2019) Statistical performance measures. Medium. https://neeraj-kumar-vaid.medium.com/statistical-performance-measures-12bad66694b7
Evidence-Based Practice & Research Methodologies Copyright © by Tracy Fawns is licensed under a Creative Commons Attribution-NonCommercial-ShareAlike 4.0 International License , except where otherwise noted.
Share This Book
Learn / Guides / Quantitative data analysis guide
Back to guides
The ultimate guide to quantitative data analysis
Numbers help us make sense of the world. We collect quantitative data on our speed and distance as we drive, the number of hours we spend on our cell phones, and how much we save at the grocery store.
Our businesses run on numbers, too. We spend hours poring over key performance indicators (KPIs) like lead-to-client conversions, net profit margins, and bounce and churn rates.
But all of this quantitative data can feel overwhelming and confusing. Lists and spreadsheets of numbers don’t tell you much on their own—you have to conduct quantitative data analysis to understand them and make informed decisions.
Last updated
Reading time.

This guide explains what quantitative data analysis is and why it’s important, and gives you a four-step process to conduct a quantitative data analysis, so you know exactly what’s happening in your business and what your users need .
Collect quantitative customer data with Hotjar
Use Hotjar’s tools to gather the customer insights you need to make quantitative data analysis a breeze.
What is quantitative data analysis?
Quantitative data analysis is the process of analyzing and interpreting numerical data. It helps you make sense of information by identifying patterns, trends, and relationships between variables through mathematical calculations and statistical tests.
With quantitative data analysis, you turn spreadsheets of individual data points into meaningful insights to drive informed decisions. Columns of numbers from an experiment or survey transform into useful insights—like which marketing campaign asset your average customer prefers or which website factors are most closely connected to your bounce rate.
Without analytics, data is just noise. Analyzing data helps you make decisions which are informed and free from bias.
What quantitative data analysis is not
But as powerful as quantitative data analysis is, it’s not without its limitations. It only gives you the what, not the why . For example, it can tell you how many website visitors or conversions you have on an average day, but it can’t tell you why users visited your site or made a purchase.
For the why behind user behavior, you need qualitative data analysis , a process for making sense of qualitative research like open-ended survey responses, interview clips, or behavioral observations. By analyzing non-numerical data, you gain useful contextual insights to shape your strategy, product, and messaging.
Quantitative data analysis vs. qualitative data analysis
Let’s take an even deeper dive into the differences between quantitative data analysis and qualitative data analysis to explore what they do and when you need them.
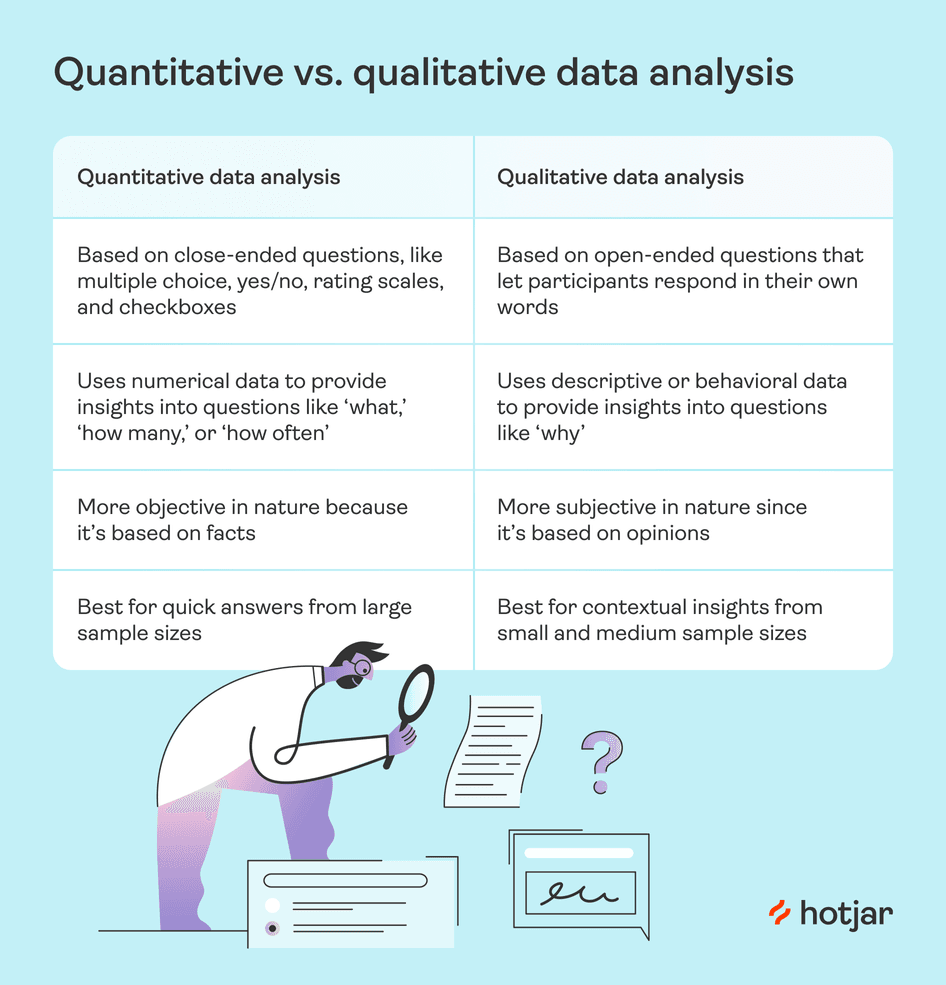
The bottom line: quantitative data analysis and qualitative data analysis are complementary processes. They work hand-in-hand to tell you what’s happening in your business and why.
💡 Pro tip: easily toggle between quantitative and qualitative data analysis with Hotjar Funnels .
The Funnels tool helps you visualize quantitative metrics like drop-off and conversion rates in your sales or conversion funnel to understand when and where users leave your website. You can break down your data even further to compare conversion performance by user segment.
Spot a potential issue? A single click takes you to relevant session recordings , where you see user behaviors like mouse movements, scrolls, and clicks. With this qualitative data to provide context, you'll better understand what you need to optimize to streamline the user experience (UX) and increase conversions .
Hotjar Funnels lets you quickly explore the story behind the quantitative data
4 benefits of quantitative data analysis
There’s a reason product, web design, and marketing teams take time to analyze metrics: the process pays off big time.
Four major benefits of quantitative data analysis include:
1. Make confident decisions
With quantitative data analysis, you know you’ve got data-driven insights to back up your decisions . For example, if you launch a concept testing survey to gauge user reactions to a new logo design, and 92% of users rate it ‘very good’—you'll feel certain when you give the designer the green light.
Since you’re relying less on intuition and more on facts, you reduce the risks of making the wrong decision. (You’ll also find it way easier to get buy-in from team members and stakeholders for your next proposed project. 🙌)
2. Reduce costs
By crunching the numbers, you can spot opportunities to reduce spend . For example, if an ad campaign has lower-than-average click-through rates , you might decide to cut your losses and invest your budget elsewhere.
Or, by analyzing ecommerce metrics , like website traffic by source, you may find you’re getting very little return on investment from a certain social media channel—and scale back spending in that area.
3. Personalize the user experience
Quantitative data analysis helps you map the customer journey , so you get a better sense of customers’ demographics, what page elements they interact with on your site, and where they drop off or convert .
These insights let you better personalize your website, product, or communication, so you can segment ads, emails, and website content for specific user personas or target groups.
4. Improve user satisfaction and delight
Quantitative data analysis lets you see where your website or product is doing well—and where it falls short for your users . For example, you might see stellar results from KPIs like time on page, but conversion rates for that page are low.
These quantitative insights encourage you to dive deeper into qualitative data to see why that’s happening—looking for moments of confusion or frustration on session recordings, for example—so you can make adjustments and optimize your conversions by improving customer satisfaction and delight.
💡Pro tip: use Net Promoter Score® (NPS) surveys to capture quantifiable customer satisfaction data that’s easy for you to analyze and interpret.
With an NPS tool like Hotjar, you can create an on-page survey to ask users how likely they are to recommend you to others on a scale from 0 to 10. (And for added context, you can ask follow-up questions about why customers selected the rating they did—rich qualitative data is always a bonus!)
Hotjar graphs your quantitative NPS data to show changes over time
4 steps to effective quantitative data analysis
Quantitative data analysis sounds way more intimidating than it actually is. Here’s how to make sense of your company’s numbers in just four steps:
1. Collect data
Before you can actually start the analysis process, you need data to analyze. This involves conducting quantitative research and collecting numerical data from various sources, including:
Interviews or focus groups
Website analytics
Observations, from tools like heatmaps or session recordings
Questionnaires, like surveys or on-page feedback widgets
Just ensure the questions you ask in your surveys are close-ended questions—providing respondents with select choices to choose from instead of open-ended questions that allow for free responses.

Hotjar’s pricing plans survey template provides close-ended questions
2. Clean data
Once you’ve collected your data, it’s time to clean it up. Look through your results to find errors, duplicates, and omissions. Keep an eye out for outliers, too. Outliers are data points that differ significantly from the rest of the set—and they can skew your results if you don’t remove them.
By taking the time to clean your data set, you ensure your data is accurate, consistent, and relevant before it’s time to analyze.
3. Analyze and interpret data
At this point, your data’s all cleaned up and ready for the main event. This step involves crunching the numbers to find patterns and trends via mathematical and statistical methods.
Two main branches of quantitative data analysis exist:
Descriptive analysis : methods to summarize or describe attributes of your data set. For example, you may calculate key stats like distribution and frequency, or mean, median, and mode.
Inferential analysis : methods that let you draw conclusions from statistics—like analyzing the relationship between variables or making predictions. These methods include t-tests, cross-tabulation, and factor analysis. (For more detailed explanations and how-tos, head to our guide on quantitative data analysis methods.)
Then, interpret your data to determine the best course of action. What does the data suggest you do ? For example, if your analysis shows a strong correlation between email open rate and time sent, you may explore optimal send times for each user segment.
4. Visualize and share data
Once you’ve analyzed and interpreted your data, create easy-to-read, engaging data visualizations—like charts, graphs, and tables—to present your results to team members and stakeholders. Data visualizations highlight similarities and differences between data sets and show the relationships between variables.
Software can do this part for you. For example, the Hotjar Dashboard shows all of your key metrics in one place—and automatically creates bar graphs to show how your top pages’ performance compares. And with just one click, you can navigate to the Trends tool to analyze product metrics for different segments on a single chart.
Hotjar Trends lets you compare metrics across segments
Discover rich user insights with quantitative data analysis
Conducting quantitative data analysis takes a little bit of time and know-how, but it’s much more manageable than you might think.
By choosing the right methods and following clear steps, you gain insights into product performance and customer experience —and you’ll be well on your way to making better decisions and creating more customer satisfaction and loyalty.
FAQs about quantitative data analysis
What is quantitative data analysis.
Quantitative data analysis is the process of making sense of numerical data through mathematical calculations and statistical tests. It helps you identify patterns, relationships, and trends to make better decisions.
How is quantitative data analysis different from qualitative data analysis?
Quantitative and qualitative data analysis are both essential processes for making sense of quantitative and qualitative research .
Quantitative data analysis helps you summarize and interpret numerical results from close-ended questions to understand what is happening. Qualitative data analysis helps you summarize and interpret non-numerical results, like opinions or behavior, to understand why the numbers look like they do.
If you want to make strong data-driven decisions, you need both.
What are some benefits of quantitative data analysis?
Quantitative data analysis turns numbers into rich insights. Some benefits of this process include:
Making more confident decisions
Identifying ways to cut costs
Personalizing the user experience
Improving customer satisfaction
What methods can I use to analyze quantitative data?
Quantitative data analysis has two branches: descriptive statistics and inferential statistics.
Descriptive statistics provide a snapshot of the data’s features by calculating measures like mean, median, and mode.
Inferential statistics , as the name implies, involves making inferences about what the data means. Dozens of methods exist for this branch of quantitative data analysis, but three commonly used techniques are:
Cross tabulation
Factor analysis
- Privacy Policy
Home » Quantitative Research – Methods, Types and Analysis
Quantitative Research – Methods, Types and Analysis
Table of Contents

Quantitative Research
Quantitative research is a type of research that collects and analyzes numerical data to test hypotheses and answer research questions . This research typically involves a large sample size and uses statistical analysis to make inferences about a population based on the data collected. It often involves the use of surveys, experiments, or other structured data collection methods to gather quantitative data.
Quantitative Research Methods

Quantitative Research Methods are as follows:
Descriptive Research Design
Descriptive research design is used to describe the characteristics of a population or phenomenon being studied. This research method is used to answer the questions of what, where, when, and how. Descriptive research designs use a variety of methods such as observation, case studies, and surveys to collect data. The data is then analyzed using statistical tools to identify patterns and relationships.
Correlational Research Design
Correlational research design is used to investigate the relationship between two or more variables. Researchers use correlational research to determine whether a relationship exists between variables and to what extent they are related. This research method involves collecting data from a sample and analyzing it using statistical tools such as correlation coefficients.
Quasi-experimental Research Design
Quasi-experimental research design is used to investigate cause-and-effect relationships between variables. This research method is similar to experimental research design, but it lacks full control over the independent variable. Researchers use quasi-experimental research designs when it is not feasible or ethical to manipulate the independent variable.
Experimental Research Design
Experimental research design is used to investigate cause-and-effect relationships between variables. This research method involves manipulating the independent variable and observing the effects on the dependent variable. Researchers use experimental research designs to test hypotheses and establish cause-and-effect relationships.
Survey Research
Survey research involves collecting data from a sample of individuals using a standardized questionnaire. This research method is used to gather information on attitudes, beliefs, and behaviors of individuals. Researchers use survey research to collect data quickly and efficiently from a large sample size. Survey research can be conducted through various methods such as online, phone, mail, or in-person interviews.
Quantitative Research Analysis Methods
Here are some commonly used quantitative research analysis methods:
Statistical Analysis
Statistical analysis is the most common quantitative research analysis method. It involves using statistical tools and techniques to analyze the numerical data collected during the research process. Statistical analysis can be used to identify patterns, trends, and relationships between variables, and to test hypotheses and theories.
Regression Analysis
Regression analysis is a statistical technique used to analyze the relationship between one dependent variable and one or more independent variables. Researchers use regression analysis to identify and quantify the impact of independent variables on the dependent variable.
Factor Analysis
Factor analysis is a statistical technique used to identify underlying factors that explain the correlations among a set of variables. Researchers use factor analysis to reduce a large number of variables to a smaller set of factors that capture the most important information.
Structural Equation Modeling
Structural equation modeling is a statistical technique used to test complex relationships between variables. It involves specifying a model that includes both observed and unobserved variables, and then using statistical methods to test the fit of the model to the data.
Time Series Analysis
Time series analysis is a statistical technique used to analyze data that is collected over time. It involves identifying patterns and trends in the data, as well as any seasonal or cyclical variations.
Multilevel Modeling
Multilevel modeling is a statistical technique used to analyze data that is nested within multiple levels. For example, researchers might use multilevel modeling to analyze data that is collected from individuals who are nested within groups, such as students nested within schools.
Applications of Quantitative Research
Quantitative research has many applications across a wide range of fields. Here are some common examples:
- Market Research : Quantitative research is used extensively in market research to understand consumer behavior, preferences, and trends. Researchers use surveys, experiments, and other quantitative methods to collect data that can inform marketing strategies, product development, and pricing decisions.
- Health Research: Quantitative research is used in health research to study the effectiveness of medical treatments, identify risk factors for diseases, and track health outcomes over time. Researchers use statistical methods to analyze data from clinical trials, surveys, and other sources to inform medical practice and policy.
- Social Science Research: Quantitative research is used in social science research to study human behavior, attitudes, and social structures. Researchers use surveys, experiments, and other quantitative methods to collect data that can inform social policies, educational programs, and community interventions.
- Education Research: Quantitative research is used in education research to study the effectiveness of teaching methods, assess student learning outcomes, and identify factors that influence student success. Researchers use experimental and quasi-experimental designs, as well as surveys and other quantitative methods, to collect and analyze data.
- Environmental Research: Quantitative research is used in environmental research to study the impact of human activities on the environment, assess the effectiveness of conservation strategies, and identify ways to reduce environmental risks. Researchers use statistical methods to analyze data from field studies, experiments, and other sources.
Characteristics of Quantitative Research
Here are some key characteristics of quantitative research:
- Numerical data : Quantitative research involves collecting numerical data through standardized methods such as surveys, experiments, and observational studies. This data is analyzed using statistical methods to identify patterns and relationships.
- Large sample size: Quantitative research often involves collecting data from a large sample of individuals or groups in order to increase the reliability and generalizability of the findings.
- Objective approach: Quantitative research aims to be objective and impartial in its approach, focusing on the collection and analysis of data rather than personal beliefs, opinions, or experiences.
- Control over variables: Quantitative research often involves manipulating variables to test hypotheses and establish cause-and-effect relationships. Researchers aim to control for extraneous variables that may impact the results.
- Replicable : Quantitative research aims to be replicable, meaning that other researchers should be able to conduct similar studies and obtain similar results using the same methods.
- Statistical analysis: Quantitative research involves using statistical tools and techniques to analyze the numerical data collected during the research process. Statistical analysis allows researchers to identify patterns, trends, and relationships between variables, and to test hypotheses and theories.
- Generalizability: Quantitative research aims to produce findings that can be generalized to larger populations beyond the specific sample studied. This is achieved through the use of random sampling methods and statistical inference.
Examples of Quantitative Research
Here are some examples of quantitative research in different fields:
- Market Research: A company conducts a survey of 1000 consumers to determine their brand awareness and preferences. The data is analyzed using statistical methods to identify trends and patterns that can inform marketing strategies.
- Health Research : A researcher conducts a randomized controlled trial to test the effectiveness of a new drug for treating a particular medical condition. The study involves collecting data from a large sample of patients and analyzing the results using statistical methods.
- Social Science Research : A sociologist conducts a survey of 500 people to study attitudes toward immigration in a particular country. The data is analyzed using statistical methods to identify factors that influence these attitudes.
- Education Research: A researcher conducts an experiment to compare the effectiveness of two different teaching methods for improving student learning outcomes. The study involves randomly assigning students to different groups and collecting data on their performance on standardized tests.
- Environmental Research : A team of researchers conduct a study to investigate the impact of climate change on the distribution and abundance of a particular species of plant or animal. The study involves collecting data on environmental factors and population sizes over time and analyzing the results using statistical methods.
- Psychology : A researcher conducts a survey of 500 college students to investigate the relationship between social media use and mental health. The data is analyzed using statistical methods to identify correlations and potential causal relationships.
- Political Science: A team of researchers conducts a study to investigate voter behavior during an election. They use survey methods to collect data on voting patterns, demographics, and political attitudes, and analyze the results using statistical methods.
How to Conduct Quantitative Research
Here is a general overview of how to conduct quantitative research:
- Develop a research question: The first step in conducting quantitative research is to develop a clear and specific research question. This question should be based on a gap in existing knowledge, and should be answerable using quantitative methods.
- Develop a research design: Once you have a research question, you will need to develop a research design. This involves deciding on the appropriate methods to collect data, such as surveys, experiments, or observational studies. You will also need to determine the appropriate sample size, data collection instruments, and data analysis techniques.
- Collect data: The next step is to collect data. This may involve administering surveys or questionnaires, conducting experiments, or gathering data from existing sources. It is important to use standardized methods to ensure that the data is reliable and valid.
- Analyze data : Once the data has been collected, it is time to analyze it. This involves using statistical methods to identify patterns, trends, and relationships between variables. Common statistical techniques include correlation analysis, regression analysis, and hypothesis testing.
- Interpret results: After analyzing the data, you will need to interpret the results. This involves identifying the key findings, determining their significance, and drawing conclusions based on the data.
- Communicate findings: Finally, you will need to communicate your findings. This may involve writing a research report, presenting at a conference, or publishing in a peer-reviewed journal. It is important to clearly communicate the research question, methods, results, and conclusions to ensure that others can understand and replicate your research.
When to use Quantitative Research
Here are some situations when quantitative research can be appropriate:
- To test a hypothesis: Quantitative research is often used to test a hypothesis or a theory. It involves collecting numerical data and using statistical analysis to determine if the data supports or refutes the hypothesis.
- To generalize findings: If you want to generalize the findings of your study to a larger population, quantitative research can be useful. This is because it allows you to collect numerical data from a representative sample of the population and use statistical analysis to make inferences about the population as a whole.
- To measure relationships between variables: If you want to measure the relationship between two or more variables, such as the relationship between age and income, or between education level and job satisfaction, quantitative research can be useful. It allows you to collect numerical data on both variables and use statistical analysis to determine the strength and direction of the relationship.
- To identify patterns or trends: Quantitative research can be useful for identifying patterns or trends in data. For example, you can use quantitative research to identify trends in consumer behavior or to identify patterns in stock market data.
- To quantify attitudes or opinions : If you want to measure attitudes or opinions on a particular topic, quantitative research can be useful. It allows you to collect numerical data using surveys or questionnaires and analyze the data using statistical methods to determine the prevalence of certain attitudes or opinions.
Purpose of Quantitative Research
The purpose of quantitative research is to systematically investigate and measure the relationships between variables or phenomena using numerical data and statistical analysis. The main objectives of quantitative research include:
- Description : To provide a detailed and accurate description of a particular phenomenon or population.
- Explanation : To explain the reasons for the occurrence of a particular phenomenon, such as identifying the factors that influence a behavior or attitude.
- Prediction : To predict future trends or behaviors based on past patterns and relationships between variables.
- Control : To identify the best strategies for controlling or influencing a particular outcome or behavior.
Quantitative research is used in many different fields, including social sciences, business, engineering, and health sciences. It can be used to investigate a wide range of phenomena, from human behavior and attitudes to physical and biological processes. The purpose of quantitative research is to provide reliable and valid data that can be used to inform decision-making and improve understanding of the world around us.
Advantages of Quantitative Research
There are several advantages of quantitative research, including:
- Objectivity : Quantitative research is based on objective data and statistical analysis, which reduces the potential for bias or subjectivity in the research process.
- Reproducibility : Because quantitative research involves standardized methods and measurements, it is more likely to be reproducible and reliable.
- Generalizability : Quantitative research allows for generalizations to be made about a population based on a representative sample, which can inform decision-making and policy development.
- Precision : Quantitative research allows for precise measurement and analysis of data, which can provide a more accurate understanding of phenomena and relationships between variables.
- Efficiency : Quantitative research can be conducted relatively quickly and efficiently, especially when compared to qualitative research, which may involve lengthy data collection and analysis.
- Large sample sizes : Quantitative research can accommodate large sample sizes, which can increase the representativeness and generalizability of the results.
Limitations of Quantitative Research
There are several limitations of quantitative research, including:
- Limited understanding of context: Quantitative research typically focuses on numerical data and statistical analysis, which may not provide a comprehensive understanding of the context or underlying factors that influence a phenomenon.
- Simplification of complex phenomena: Quantitative research often involves simplifying complex phenomena into measurable variables, which may not capture the full complexity of the phenomenon being studied.
- Potential for researcher bias: Although quantitative research aims to be objective, there is still the potential for researcher bias in areas such as sampling, data collection, and data analysis.
- Limited ability to explore new ideas: Quantitative research is often based on pre-determined research questions and hypotheses, which may limit the ability to explore new ideas or unexpected findings.
- Limited ability to capture subjective experiences : Quantitative research is typically focused on objective data and may not capture the subjective experiences of individuals or groups being studied.
- Ethical concerns : Quantitative research may raise ethical concerns, such as invasion of privacy or the potential for harm to participants.
About the author

Muhammad Hassan
Researcher, Academic Writer, Web developer
You may also like

Questionnaire – Definition, Types, and Examples

Case Study – Methods, Examples and Guide

Observational Research – Methods and Guide

Qualitative Research Methods

Explanatory Research – Types, Methods, Guide

Survey Research – Types, Methods, Examples

Quantitative Data Analysis
In quantitative data analysis you are expected to turn raw numbers into meaningful data through the application of rational and critical thinking. Quantitative data analysis may include the calculation of frequencies of variables and differences between variables. A quantitative approach is usually associated with finding evidence to either support or reject hypotheses you have formulated at the earlier stages of your research process .
The same figure within data set can be interpreted in many different ways; therefore it is important to apply fair and careful judgement.
For example, questionnaire findings of a research titled “A study into the impacts of informal management-employee communication on the levels of employee motivation: a case study of Agro Bravo Enterprise” may indicate that the majority 52% of respondents assess communication skills of their immediate supervisors as inadequate.
This specific piece of primary data findings needs to be critically analyzed and objectively interpreted through comparing it to other findings within the framework of the same research. For example, organizational culture of Agro Bravo Enterprise, leadership style, the levels of frequency of management-employee communications need to be taken into account during the data analysis.
Moreover, literature review findings conducted at the earlier stages of the research process need to be referred to in order to reflect the viewpoints of other authors regarding the causes of employee dissatisfaction with management communication. Also, secondary data needs to be integrated in data analysis in a logical and unbiased manner.
Let’s take another example. You are writing a dissertation exploring the impacts of foreign direct investment (FDI) on the levels of economic growth in Vietnam using correlation quantitative data analysis method . You have specified FDI and GDP as variables for your research and correlation tests produced correlation coefficient of 0.9.
In this case simply stating that there is a strong positive correlation between FDI and GDP would not suffice; you have to provide explanation about the manners in which the growth on the levels of FDI may contribute to the growth of GDP by referring to the findings of the literature review and applying your own critical and rational reasoning skills.
A set of analytical software can be used to assist with analysis of quantitative data. The following table illustrates the advantages and disadvantages of three popular quantitative data analysis software: Microsoft Excel, Microsoft Access and SPSS.
Advantages and disadvantages of popular quantitative analytical software
Quantitative data analysis with the application of statistical software consists of the following stages [1] :
- Preparing and checking the data. Input of data into computer.
- Selecting the most appropriate tables and diagrams to use according to your research objectives.
- Selecting the most appropriate statistics to describe your data.
- Selecting the most appropriate statistics to examine relationships and trends in your data.
It is important to note that while the application of various statistical software and programs are invaluable to avoid drawing charts by hand or undertake calculations manually, it is easy to use them incorrectly. In other words, quantitative data analysis is “a field where it is not at all difficult to carry out an analysis which is simply wrong, or inappropriate for your data or purposes. And the negative side of readily available specialist statistical software is that it becomes that much easier to generate elegantly presented rubbish” [2] .
Therefore, it is important for you to seek advice from your dissertation supervisor regarding statistical analyses in general and the choice and application of statistical software in particular.
My e-book, The Ultimate Guide to Writing a Dissertation in Business Studies: a step by step approach contains a detailed, yet simple explanation of quantitative data analysis methods . The e-book explains all stages of the research process starting from the selection of the research area to writing personal reflection. Important elements of dissertations such as research philosophy, research approach, research design, methods of data collection and data analysis are explained in simple words. John Dudovskiy

[1] Saunders, M., Lewis, P. & Thornhill, A. (2012) “Research Methods for Business Students” 6th edition, Pearson Education Limited.
[2] Robson, C. (2011) Real World Research: A Resource for Users of Social Research Methods in Applied Settings (3rd edn). Chichester: John Wiley.
- USC Libraries
- Research Guides
Organizing Your Social Sciences Research Paper
- Quantitative Methods
- Purpose of Guide
- Design Flaws to Avoid
- Independent and Dependent Variables
- Glossary of Research Terms
- Reading Research Effectively
- Narrowing a Topic Idea
- Broadening a Topic Idea
- Extending the Timeliness of a Topic Idea
- Academic Writing Style
- Applying Critical Thinking
- Choosing a Title
- Making an Outline
- Paragraph Development
- Research Process Video Series
- Executive Summary
- The C.A.R.S. Model
- Background Information
- The Research Problem/Question
- Theoretical Framework
- Citation Tracking
- Content Alert Services
- Evaluating Sources
- Primary Sources
- Secondary Sources
- Tiertiary Sources
- Scholarly vs. Popular Publications
- Qualitative Methods
- Insiderness
- Using Non-Textual Elements
- Limitations of the Study
- Common Grammar Mistakes
- Writing Concisely
- Avoiding Plagiarism
- Footnotes or Endnotes?
- Further Readings
- Generative AI and Writing
- USC Libraries Tutorials and Other Guides
- Bibliography
Quantitative methods emphasize objective measurements and the statistical, mathematical, or numerical analysis of data collected through polls, questionnaires, and surveys, or by manipulating pre-existing statistical data using computational techniques . Quantitative research focuses on gathering numerical data and generalizing it across groups of people or to explain a particular phenomenon.
Babbie, Earl R. The Practice of Social Research . 12th ed. Belmont, CA: Wadsworth Cengage, 2010; Muijs, Daniel. Doing Quantitative Research in Education with SPSS . 2nd edition. London: SAGE Publications, 2010.
Need Help Locating Statistics?
Resources for locating data and statistics can be found here:
Statistics & Data Research Guide
Characteristics of Quantitative Research
Your goal in conducting quantitative research study is to determine the relationship between one thing [an independent variable] and another [a dependent or outcome variable] within a population. Quantitative research designs are either descriptive [subjects usually measured once] or experimental [subjects measured before and after a treatment]. A descriptive study establishes only associations between variables; an experimental study establishes causality.
Quantitative research deals in numbers, logic, and an objective stance. Quantitative research focuses on numeric and unchanging data and detailed, convergent reasoning rather than divergent reasoning [i.e., the generation of a variety of ideas about a research problem in a spontaneous, free-flowing manner].
Its main characteristics are :
- The data is usually gathered using structured research instruments.
- The results are based on larger sample sizes that are representative of the population.
- The research study can usually be replicated or repeated, given its high reliability.
- Researcher has a clearly defined research question to which objective answers are sought.
- All aspects of the study are carefully designed before data is collected.
- Data are in the form of numbers and statistics, often arranged in tables, charts, figures, or other non-textual forms.
- Project can be used to generalize concepts more widely, predict future results, or investigate causal relationships.
- Researcher uses tools, such as questionnaires or computer software, to collect numerical data.
The overarching aim of a quantitative research study is to classify features, count them, and construct statistical models in an attempt to explain what is observed.
Things to keep in mind when reporting the results of a study using quantitative methods :
- Explain the data collected and their statistical treatment as well as all relevant results in relation to the research problem you are investigating. Interpretation of results is not appropriate in this section.
- Report unanticipated events that occurred during your data collection. Explain how the actual analysis differs from the planned analysis. Explain your handling of missing data and why any missing data does not undermine the validity of your analysis.
- Explain the techniques you used to "clean" your data set.
- Choose a minimally sufficient statistical procedure ; provide a rationale for its use and a reference for it. Specify any computer programs used.
- Describe the assumptions for each procedure and the steps you took to ensure that they were not violated.
- When using inferential statistics , provide the descriptive statistics, confidence intervals, and sample sizes for each variable as well as the value of the test statistic, its direction, the degrees of freedom, and the significance level [report the actual p value].
- Avoid inferring causality , particularly in nonrandomized designs or without further experimentation.
- Use tables to provide exact values ; use figures to convey global effects. Keep figures small in size; include graphic representations of confidence intervals whenever possible.
- Always tell the reader what to look for in tables and figures .
NOTE: When using pre-existing statistical data gathered and made available by anyone other than yourself [e.g., government agency], you still must report on the methods that were used to gather the data and describe any missing data that exists and, if there is any, provide a clear explanation why the missing data does not undermine the validity of your final analysis.
Babbie, Earl R. The Practice of Social Research . 12th ed. Belmont, CA: Wadsworth Cengage, 2010; Brians, Craig Leonard et al. Empirical Political Analysis: Quantitative and Qualitative Research Methods . 8th ed. Boston, MA: Longman, 2011; McNabb, David E. Research Methods in Public Administration and Nonprofit Management: Quantitative and Qualitative Approaches . 2nd ed. Armonk, NY: M.E. Sharpe, 2008; Quantitative Research Methods. Writing@CSU. Colorado State University; Singh, Kultar. Quantitative Social Research Methods . Los Angeles, CA: Sage, 2007.
Basic Research Design for Quantitative Studies
Before designing a quantitative research study, you must decide whether it will be descriptive or experimental because this will dictate how you gather, analyze, and interpret the results. A descriptive study is governed by the following rules: subjects are generally measured once; the intention is to only establish associations between variables; and, the study may include a sample population of hundreds or thousands of subjects to ensure that a valid estimate of a generalized relationship between variables has been obtained. An experimental design includes subjects measured before and after a particular treatment, the sample population may be very small and purposefully chosen, and it is intended to establish causality between variables. Introduction The introduction to a quantitative study is usually written in the present tense and from the third person point of view. It covers the following information:
- Identifies the research problem -- as with any academic study, you must state clearly and concisely the research problem being investigated.
- Reviews the literature -- review scholarship on the topic, synthesizing key themes and, if necessary, noting studies that have used similar methods of inquiry and analysis. Note where key gaps exist and how your study helps to fill these gaps or clarifies existing knowledge.
- Describes the theoretical framework -- provide an outline of the theory or hypothesis underpinning your study. If necessary, define unfamiliar or complex terms, concepts, or ideas and provide the appropriate background information to place the research problem in proper context [e.g., historical, cultural, economic, etc.].
Methodology The methods section of a quantitative study should describe how each objective of your study will be achieved. Be sure to provide enough detail to enable the reader can make an informed assessment of the methods being used to obtain results associated with the research problem. The methods section should be presented in the past tense.
- Study population and sampling -- where did the data come from; how robust is it; note where gaps exist or what was excluded. Note the procedures used for their selection;
- Data collection – describe the tools and methods used to collect information and identify the variables being measured; describe the methods used to obtain the data; and, note if the data was pre-existing [i.e., government data] or you gathered it yourself. If you gathered it yourself, describe what type of instrument you used and why. Note that no data set is perfect--describe any limitations in methods of gathering data.
- Data analysis -- describe the procedures for processing and analyzing the data. If appropriate, describe the specific instruments of analysis used to study each research objective, including mathematical techniques and the type of computer software used to manipulate the data.
Results The finding of your study should be written objectively and in a succinct and precise format. In quantitative studies, it is common to use graphs, tables, charts, and other non-textual elements to help the reader understand the data. Make sure that non-textual elements do not stand in isolation from the text but are being used to supplement the overall description of the results and to help clarify key points being made. Further information about how to effectively present data using charts and graphs can be found here .
- Statistical analysis -- how did you analyze the data? What were the key findings from the data? The findings should be present in a logical, sequential order. Describe but do not interpret these trends or negative results; save that for the discussion section. The results should be presented in the past tense.
Discussion Discussions should be analytic, logical, and comprehensive. The discussion should meld together your findings in relation to those identified in the literature review, and placed within the context of the theoretical framework underpinning the study. The discussion should be presented in the present tense.
- Interpretation of results -- reiterate the research problem being investigated and compare and contrast the findings with the research questions underlying the study. Did they affirm predicted outcomes or did the data refute it?
- Description of trends, comparison of groups, or relationships among variables -- describe any trends that emerged from your analysis and explain all unanticipated and statistical insignificant findings.
- Discussion of implications – what is the meaning of your results? Highlight key findings based on the overall results and note findings that you believe are important. How have the results helped fill gaps in understanding the research problem?
- Limitations -- describe any limitations or unavoidable bias in your study and, if necessary, note why these limitations did not inhibit effective interpretation of the results.
Conclusion End your study by to summarizing the topic and provide a final comment and assessment of the study.
- Summary of findings – synthesize the answers to your research questions. Do not report any statistical data here; just provide a narrative summary of the key findings and describe what was learned that you did not know before conducting the study.
- Recommendations – if appropriate to the aim of the assignment, tie key findings with policy recommendations or actions to be taken in practice.
- Future research – note the need for future research linked to your study’s limitations or to any remaining gaps in the literature that were not addressed in your study.
Black, Thomas R. Doing Quantitative Research in the Social Sciences: An Integrated Approach to Research Design, Measurement and Statistics . London: Sage, 1999; Gay,L. R. and Peter Airasain. Educational Research: Competencies for Analysis and Applications . 7th edition. Upper Saddle River, NJ: Merril Prentice Hall, 2003; Hector, Anestine. An Overview of Quantitative Research in Composition and TESOL . Department of English, Indiana University of Pennsylvania; Hopkins, Will G. “Quantitative Research Design.” Sportscience 4, 1 (2000); "A Strategy for Writing Up Research Results. The Structure, Format, Content, and Style of a Journal-Style Scientific Paper." Department of Biology. Bates College; Nenty, H. Johnson. "Writing a Quantitative Research Thesis." International Journal of Educational Science 1 (2009): 19-32; Ouyang, Ronghua (John). Basic Inquiry of Quantitative Research . Kennesaw State University.
Strengths of Using Quantitative Methods
Quantitative researchers try to recognize and isolate specific variables contained within the study framework, seek correlation, relationships and causality, and attempt to control the environment in which the data is collected to avoid the risk of variables, other than the one being studied, accounting for the relationships identified.
Among the specific strengths of using quantitative methods to study social science research problems:
- Allows for a broader study, involving a greater number of subjects, and enhancing the generalization of the results;
- Allows for greater objectivity and accuracy of results. Generally, quantitative methods are designed to provide summaries of data that support generalizations about the phenomenon under study. In order to accomplish this, quantitative research usually involves few variables and many cases, and employs prescribed procedures to ensure validity and reliability;
- Applying well established standards means that the research can be replicated, and then analyzed and compared with similar studies;
- You can summarize vast sources of information and make comparisons across categories and over time; and,
- Personal bias can be avoided by keeping a 'distance' from participating subjects and using accepted computational techniques .
Babbie, Earl R. The Practice of Social Research . 12th ed. Belmont, CA: Wadsworth Cengage, 2010; Brians, Craig Leonard et al. Empirical Political Analysis: Quantitative and Qualitative Research Methods . 8th ed. Boston, MA: Longman, 2011; McNabb, David E. Research Methods in Public Administration and Nonprofit Management: Quantitative and Qualitative Approaches . 2nd ed. Armonk, NY: M.E. Sharpe, 2008; Singh, Kultar. Quantitative Social Research Methods . Los Angeles, CA: Sage, 2007.
Limitations of Using Quantitative Methods
Quantitative methods presume to have an objective approach to studying research problems, where data is controlled and measured, to address the accumulation of facts, and to determine the causes of behavior. As a consequence, the results of quantitative research may be statistically significant but are often humanly insignificant.
Some specific limitations associated with using quantitative methods to study research problems in the social sciences include:
- Quantitative data is more efficient and able to test hypotheses, but may miss contextual detail;
- Uses a static and rigid approach and so employs an inflexible process of discovery;
- The development of standard questions by researchers can lead to "structural bias" and false representation, where the data actually reflects the view of the researcher instead of the participating subject;
- Results provide less detail on behavior, attitudes, and motivation;
- Researcher may collect a much narrower and sometimes superficial dataset;
- Results are limited as they provide numerical descriptions rather than detailed narrative and generally provide less elaborate accounts of human perception;
- The research is often carried out in an unnatural, artificial environment so that a level of control can be applied to the exercise. This level of control might not normally be in place in the real world thus yielding "laboratory results" as opposed to "real world results"; and,
- Preset answers will not necessarily reflect how people really feel about a subject and, in some cases, might just be the closest match to the preconceived hypothesis.
Research Tip
Finding Examples of How to Apply Different Types of Research Methods
SAGE publications is a major publisher of studies about how to design and conduct research in the social and behavioral sciences. Their SAGE Research Methods Online and Cases database includes contents from books, articles, encyclopedias, handbooks, and videos covering social science research design and methods including the complete Little Green Book Series of Quantitative Applications in the Social Sciences and the Little Blue Book Series of Qualitative Research techniques. The database also includes case studies outlining the research methods used in real research projects. This is an excellent source for finding definitions of key terms and descriptions of research design and practice, techniques of data gathering, analysis, and reporting, and information about theories of research [e.g., grounded theory]. The database covers both qualitative and quantitative research methods as well as mixed methods approaches to conducting research.
SAGE Research Methods Online and Cases
- << Previous: Qualitative Methods
- Next: Insiderness >>
- Last Updated: May 9, 2024 11:05 AM
- URL: https://libguides.usc.edu/writingguide
Qualitative vs Quantitative Research Methods & Data Analysis
Saul Mcleod, PhD
Editor-in-Chief for Simply Psychology
BSc (Hons) Psychology, MRes, PhD, University of Manchester
Saul Mcleod, PhD., is a qualified psychology teacher with over 18 years of experience in further and higher education. He has been published in peer-reviewed journals, including the Journal of Clinical Psychology.
Learn about our Editorial Process
Olivia Guy-Evans, MSc
Associate Editor for Simply Psychology
BSc (Hons) Psychology, MSc Psychology of Education
Olivia Guy-Evans is a writer and associate editor for Simply Psychology. She has previously worked in healthcare and educational sectors.
On This Page:
What is the difference between quantitative and qualitative?
The main difference between quantitative and qualitative research is the type of data they collect and analyze.
Quantitative research collects numerical data and analyzes it using statistical methods. The aim is to produce objective, empirical data that can be measured and expressed in numerical terms. Quantitative research is often used to test hypotheses, identify patterns, and make predictions.
Qualitative research , on the other hand, collects non-numerical data such as words, images, and sounds. The focus is on exploring subjective experiences, opinions, and attitudes, often through observation and interviews.
Qualitative research aims to produce rich and detailed descriptions of the phenomenon being studied, and to uncover new insights and meanings.
Quantitative data is information about quantities, and therefore numbers, and qualitative data is descriptive, and regards phenomenon which can be observed but not measured, such as language.
What Is Qualitative Research?
Qualitative research is the process of collecting, analyzing, and interpreting non-numerical data, such as language. Qualitative research can be used to understand how an individual subjectively perceives and gives meaning to their social reality.
Qualitative data is non-numerical data, such as text, video, photographs, or audio recordings. This type of data can be collected using diary accounts or in-depth interviews and analyzed using grounded theory or thematic analysis.
Qualitative research is multimethod in focus, involving an interpretive, naturalistic approach to its subject matter. This means that qualitative researchers study things in their natural settings, attempting to make sense of, or interpret, phenomena in terms of the meanings people bring to them. Denzin and Lincoln (1994, p. 2)
Interest in qualitative data came about as the result of the dissatisfaction of some psychologists (e.g., Carl Rogers) with the scientific study of psychologists such as behaviorists (e.g., Skinner ).
Since psychologists study people, the traditional approach to science is not seen as an appropriate way of carrying out research since it fails to capture the totality of human experience and the essence of being human. Exploring participants’ experiences is known as a phenomenological approach (re: Humanism ).
Qualitative research is primarily concerned with meaning, subjectivity, and lived experience. The goal is to understand the quality and texture of people’s experiences, how they make sense of them, and the implications for their lives.
Qualitative research aims to understand the social reality of individuals, groups, and cultures as nearly as possible as participants feel or live it. Thus, people and groups are studied in their natural setting.
Some examples of qualitative research questions are provided, such as what an experience feels like, how people talk about something, how they make sense of an experience, and how events unfold for people.
Research following a qualitative approach is exploratory and seeks to explain ‘how’ and ‘why’ a particular phenomenon, or behavior, operates as it does in a particular context. It can be used to generate hypotheses and theories from the data.
Qualitative Methods
There are different types of qualitative research methods, including diary accounts, in-depth interviews , documents, focus groups , case study research , and ethnography.
The results of qualitative methods provide a deep understanding of how people perceive their social realities and in consequence, how they act within the social world.
The researcher has several methods for collecting empirical materials, ranging from the interview to direct observation, to the analysis of artifacts, documents, and cultural records, to the use of visual materials or personal experience. Denzin and Lincoln (1994, p. 14)
Here are some examples of qualitative data:
Interview transcripts : Verbatim records of what participants said during an interview or focus group. They allow researchers to identify common themes and patterns, and draw conclusions based on the data. Interview transcripts can also be useful in providing direct quotes and examples to support research findings.
Observations : The researcher typically takes detailed notes on what they observe, including any contextual information, nonverbal cues, or other relevant details. The resulting observational data can be analyzed to gain insights into social phenomena, such as human behavior, social interactions, and cultural practices.
Unstructured interviews : generate qualitative data through the use of open questions. This allows the respondent to talk in some depth, choosing their own words. This helps the researcher develop a real sense of a person’s understanding of a situation.
Diaries or journals : Written accounts of personal experiences or reflections.
Notice that qualitative data could be much more than just words or text. Photographs, videos, sound recordings, and so on, can be considered qualitative data. Visual data can be used to understand behaviors, environments, and social interactions.
Qualitative Data Analysis
Qualitative research is endlessly creative and interpretive. The researcher does not just leave the field with mountains of empirical data and then easily write up his or her findings.
Qualitative interpretations are constructed, and various techniques can be used to make sense of the data, such as content analysis, grounded theory (Glaser & Strauss, 1967), thematic analysis (Braun & Clarke, 2006), or discourse analysis.
For example, thematic analysis is a qualitative approach that involves identifying implicit or explicit ideas within the data. Themes will often emerge once the data has been coded.

Key Features
- Events can be understood adequately only if they are seen in context. Therefore, a qualitative researcher immerses her/himself in the field, in natural surroundings. The contexts of inquiry are not contrived; they are natural. Nothing is predefined or taken for granted.
- Qualitative researchers want those who are studied to speak for themselves, to provide their perspectives in words and other actions. Therefore, qualitative research is an interactive process in which the persons studied teach the researcher about their lives.
- The qualitative researcher is an integral part of the data; without the active participation of the researcher, no data exists.
- The study’s design evolves during the research and can be adjusted or changed as it progresses. For the qualitative researcher, there is no single reality. It is subjective and exists only in reference to the observer.
- The theory is data-driven and emerges as part of the research process, evolving from the data as they are collected.
Limitations of Qualitative Research
- Because of the time and costs involved, qualitative designs do not generally draw samples from large-scale data sets.
- The problem of adequate validity or reliability is a major criticism. Because of the subjective nature of qualitative data and its origin in single contexts, it is difficult to apply conventional standards of reliability and validity. For example, because of the central role played by the researcher in the generation of data, it is not possible to replicate qualitative studies.
- Also, contexts, situations, events, conditions, and interactions cannot be replicated to any extent, nor can generalizations be made to a wider context than the one studied with confidence.
- The time required for data collection, analysis, and interpretation is lengthy. Analysis of qualitative data is difficult, and expert knowledge of an area is necessary to interpret qualitative data. Great care must be taken when doing so, for example, looking for mental illness symptoms.
Advantages of Qualitative Research
- Because of close researcher involvement, the researcher gains an insider’s view of the field. This allows the researcher to find issues that are often missed (such as subtleties and complexities) by the scientific, more positivistic inquiries.
- Qualitative descriptions can be important in suggesting possible relationships, causes, effects, and dynamic processes.
- Qualitative analysis allows for ambiguities/contradictions in the data, which reflect social reality (Denscombe, 2010).
- Qualitative research uses a descriptive, narrative style; this research might be of particular benefit to the practitioner as she or he could turn to qualitative reports to examine forms of knowledge that might otherwise be unavailable, thereby gaining new insight.
What Is Quantitative Research?
Quantitative research involves the process of objectively collecting and analyzing numerical data to describe, predict, or control variables of interest.
The goals of quantitative research are to test causal relationships between variables , make predictions, and generalize results to wider populations.
Quantitative researchers aim to establish general laws of behavior and phenomenon across different settings/contexts. Research is used to test a theory and ultimately support or reject it.
Quantitative Methods
Experiments typically yield quantitative data, as they are concerned with measuring things. However, other research methods, such as controlled observations and questionnaires , can produce both quantitative information.
For example, a rating scale or closed questions on a questionnaire would generate quantitative data as these produce either numerical data or data that can be put into categories (e.g., “yes,” “no” answers).
Experimental methods limit how research participants react to and express appropriate social behavior.
Findings are, therefore, likely to be context-bound and simply a reflection of the assumptions that the researcher brings to the investigation.
There are numerous examples of quantitative data in psychological research, including mental health. Here are a few examples:
Another example is the Experience in Close Relationships Scale (ECR), a self-report questionnaire widely used to assess adult attachment styles .
The ECR provides quantitative data that can be used to assess attachment styles and predict relationship outcomes.
Neuroimaging data : Neuroimaging techniques, such as MRI and fMRI, provide quantitative data on brain structure and function.
This data can be analyzed to identify brain regions involved in specific mental processes or disorders.
For example, the Beck Depression Inventory (BDI) is a clinician-administered questionnaire widely used to assess the severity of depressive symptoms in individuals.
The BDI consists of 21 questions, each scored on a scale of 0 to 3, with higher scores indicating more severe depressive symptoms.
Quantitative Data Analysis
Statistics help us turn quantitative data into useful information to help with decision-making. We can use statistics to summarize our data, describing patterns, relationships, and connections. Statistics can be descriptive or inferential.
Descriptive statistics help us to summarize our data. In contrast, inferential statistics are used to identify statistically significant differences between groups of data (such as intervention and control groups in a randomized control study).
- Quantitative researchers try to control extraneous variables by conducting their studies in the lab.
- The research aims for objectivity (i.e., without bias) and is separated from the data.
- The design of the study is determined before it begins.
- For the quantitative researcher, the reality is objective, exists separately from the researcher, and can be seen by anyone.
- Research is used to test a theory and ultimately support or reject it.
Limitations of Quantitative Research
- Context: Quantitative experiments do not take place in natural settings. In addition, they do not allow participants to explain their choices or the meaning of the questions they may have for those participants (Carr, 1994).
- Researcher expertise: Poor knowledge of the application of statistical analysis may negatively affect analysis and subsequent interpretation (Black, 1999).
- Variability of data quantity: Large sample sizes are needed for more accurate analysis. Small-scale quantitative studies may be less reliable because of the low quantity of data (Denscombe, 2010). This also affects the ability to generalize study findings to wider populations.
- Confirmation bias: The researcher might miss observing phenomena because of focus on theory or hypothesis testing rather than on the theory of hypothesis generation.
Advantages of Quantitative Research
- Scientific objectivity: Quantitative data can be interpreted with statistical analysis, and since statistics are based on the principles of mathematics, the quantitative approach is viewed as scientifically objective and rational (Carr, 1994; Denscombe, 2010).
- Useful for testing and validating already constructed theories.
- Rapid analysis: Sophisticated software removes much of the need for prolonged data analysis, especially with large volumes of data involved (Antonius, 2003).
- Replication: Quantitative data is based on measured values and can be checked by others because numerical data is less open to ambiguities of interpretation.
- Hypotheses can also be tested because of statistical analysis (Antonius, 2003).
Antonius, R. (2003). Interpreting quantitative data with SPSS . Sage.
Black, T. R. (1999). Doing quantitative research in the social sciences: An integrated approach to research design, measurement and statistics . Sage.
Braun, V. & Clarke, V. (2006). Using thematic analysis in psychology . Qualitative Research in Psychology , 3, 77–101.
Carr, L. T. (1994). The strengths and weaknesses of quantitative and qualitative research : what method for nursing? Journal of advanced nursing, 20(4) , 716-721.
Denscombe, M. (2010). The Good Research Guide: for small-scale social research. McGraw Hill.
Denzin, N., & Lincoln. Y. (1994). Handbook of Qualitative Research. Thousand Oaks, CA, US: Sage Publications Inc.
Glaser, B. G., Strauss, A. L., & Strutzel, E. (1968). The discovery of grounded theory; strategies for qualitative research. Nursing research, 17(4) , 364.
Minichiello, V. (1990). In-Depth Interviewing: Researching People. Longman Cheshire.
Punch, K. (1998). Introduction to Social Research: Quantitative and Qualitative Approaches. London: Sage
Further Information
- Designing qualitative research
- Methods of data collection and analysis
- Introduction to quantitative and qualitative research
- Checklists for improving rigour in qualitative research: a case of the tail wagging the dog?
- Qualitative research in health care: Analysing qualitative data
- Qualitative data analysis: the framework approach
- Using the framework method for the analysis of
- Qualitative data in multi-disciplinary health research
- Content Analysis
- Grounded Theory
- Thematic Analysis
Research Paper Guide
Quantitative Research
Understanding Quantitative Research - Types & Data Collection Techniques
13 min read

People also read
Research Paper Writing - A Step by Step Guide
Research Paper Examples - Free Sample Papers for Different Formats!
Guide to Creating Effective Research Paper Outline
Interesting Research Paper Topics for 2024
Research Proposal Writing - A Step-by-Step Guide
How to Start a Research Paper - 7 Easy Steps
How to Write an Abstract for a Research Paper - A Step by Step Guide
Writing a Literature Review For a Research Paper - A Comprehensive Guide
Qualitative Research - Methods, Types, and Examples
8 Types of Qualitative Research - Overview & Examples
Qualitative vs Quantitative Research - Learning the Basics
200+ Engaging Psychology Research Paper Topics for Students in 2024
Learn How to Write a Hypothesis in a Research Paper: Examples and Tips!
20+ Types of Research With Examples - A Detailed Guide
230+ Sociology Research Topics & Ideas for Students
How to Cite a Research Paper - A Complete Guide
Excellent History Research Paper Topics- 300+ Ideas
A Guide on Writing the Method Section of a Research Paper - Examples & Tips
How To Write an Introduction Paragraph For a Research Paper: Learn with Examples
Crafting a Winning Research Paper Title: A Complete Guide
Writing a Research Paper Conclusion - Step-by-Step Guide
Writing a Thesis For a Research Paper - A Comprehensive Guide
How To Write A Discussion For A Research Paper | Examples & Tips
How To Write The Results Section of A Research Paper | Steps & Examples
Writing a Problem Statement for a Research Paper - A Comprehensive Guide
Finding Sources For a Research Paper: A Complete Guide
A Guide on How to Edit a Research Paper
200+ Ethical Research Paper Topics to Begin With (2024)
300+ Controversial Research Paper Topics & Ideas - 2024 Edition
150+ Argumentative Research Paper Topics For You - 2024
How to Write a Research Methodology for a Research Paper
Ever had a tough time with quantitative research? You're not alone!
Quantitative research is the process of collecting and analyzing numerical data to understand and study various phenomena using statistical methods. Many find this tedious process tricky.
But don't worry!
Our complete guide is here to guide you through the important steps and tricks to handle this challenge with confidence. We've even added some examples to make it easier.
So, let's dive in and learn together!
- 1. Quantitative Research Definition - What is Quantitative Research?
- 2. Data Collection in Quantitative Research
- 3. Data Analysis in Quantitative Research
- 4. Types of Quantitative Research Methods for Students and Researchers
- 5. Types of Data Collection Methodologies in Quantitative Research
- 6. Quantitative vs. Qualitative Research
- 7. Advantages and Strengths of Quantitative Research
- 8. Disadvantages and Weaknesses of Quantitative Research
Quantitative Research Definition - What is Quantitative Research?
Quantitative research involves gathering and studying numerical data. Its applications include identifying trends, making forecasts, testing cause-and-effect links, and drawing broader conclusions applicable to larger groups.
In this method, researchers employ tools such as surveys, experiments, and observations to gather data. Whereas in qualitative research, you deal with non-numeric data, such as text, video, or audio.
Quantitative research is extensively applied in natural and social sciences, including biology, chemistry, psychology, economics, sociology, and marketing, among others.
Characteristics of Quantitative Research
Here are some distinct quantitative research characteristics:
- Large Sample Sizes: Quantitative studies often involve larger sample sizes, allowing for more robust statistical analyses and generalizability of findings.
- Statistical Analysis: Statistical techniques and tools are extensively used to analyze data, unveiling patterns, relationships, and significance.
- Objective and Replicable: Quantitative research aims for objectivity and replicability. Other researchers should be able to conduct the same study and obtain similar results.
- Closed-Ended Questions: Surveys and questionnaires typically use closed-ended questions with predefined response options, making data analysis more straightforward.
- Quantifiable Variables: Researchers identify and measure variables that can be quantified, such as age, income, or test scores, for precise analysis.
- Hypothesis Testing: It often involves testing hypotheses and making inferences about populations based on sample data.
- Cross-Sectional or Longitudinal: Studies can be cross-sectional (data collected at a single point in time) or longitudinal (data collected over an extended period).
- Generalizability: Quantitative research seeks to generalize findings from a sample to a larger population, provided the sample is representative.
These characteristics make quantitative research different from qualitative research.
Data Collection in Quantitative Research
Data collection is the systematic process of gathering information for research purposes. It is a critical starting point, ensuring that the information gathered is relevant, accurate, and comprehensive.
- Structured Instruments - Quantitative research typically employs structured instruments like surveys and questionnaires. These tools ensure consistency in data gathering by posing the same set of questions to each participant.
- Sampling Methods - Researchers use various sampling techniques, such as random sampling, stratified sampling, or convenience sampling, to select a representative group from the target population.
- Objective Observation - Data collection often involves objective observations of phenomena. This may include recording numerical data, such as counting occurrences or measuring attributes.
- Experimental Control - In experimental research, control over variables is essential. Researchers manipulate one or more variables to observe their impact on the outcome, maintaining control over external factors.
Data Analysis in Quantitative Research
Data analysis is the second important aspect of quantitative research. After collecting the data, the data is analyzed with statistical methods. When analyzing, it is important that the results are relevant and related to the objective and aim of the research.
Below are some common statistical analysis methods that are used to analyze the collected data.
- SWOT Analysis - It stands for Strengths, Weaknesses, Opportunities, and Threats. Businesses use this kind of analysis to evaluate their performance and develop appropriate strategies.
- Conjoint Analysis - This kind of analysis helps businesses to identify how customers make difficult purchasing decisions. The businesses involved in direct sales and purchases know this and use the analysis to make the decisions.
- Cross-tabulation - A preliminary statistical analysis helps understand patterns, trends, and relationships between the various factors of the research.
- TURF Analysis - It stands for Totally Unduplicated Reach and Frequency Analysis. It is conducted to collect and analyze the data and responses of a chosen or favored target group.
Afterward, other methods like inferential statistics could be used to gather the results.
Types of Quantitative Research Methods for Students and Researchers
‘What are the four types of quantitative research?’
Quantitative research has four distinct types, and all four of them are regarded as primary research methods. Primary quantitative research is more common and useful than secondary research methods.
It is mainly because, in them, the researcher collects the data directly. He does not depend on previous research and collects the data from scratch.
Below are the four types of quantitative research methods.
Survey Research
This type of research is conducted through means of online surveys, online polls, and questionnaires. A group of people is chosen for the survey, and the method is used by big and small organizations and companies. They use it to understand their customers better.
Ideally, the survey is done through face-to-face meetings and interviews. Now, it is conducted through various online methodologies. Below are the common types of surveys.
- Cross-Sectional Survey - This research is conducted on a selected group of people at a certain point in time. The researcher evaluates several things. The selected group of people has similarities in all aspects except the ones chosen by the researcher. This kind of research is used for industries like retail, small-scale businesses, and healthcare industries.
- Longitudinal Survey - This research is based on observing a specific group of people for a set duration. The duration could be days, months, or even years. The researcher observes the change in behavior of the selected group of people.
This kind of research is used in the fields of applied sciences, medicine, and marketing.
Correlational Research
Correlational research is conducted to identify the relationship between two entities. These entities must be closely related and have a significant impact on each other.
This research is conducted to identify, evaluate, and understand the correlation between the variables and how they depend on each other.
The researchers use mathematical and statistical methods to understand this correlation. Some factors that they consider include relationships, trends, and patterns between these variables.
Sometimes, the researchers make changes in one of the variables to notice the effect on the other one.
Causal-comparative Research
This research is also known as quasi-experimental research. It is based on the cause and effect relationship between the two variables. Here, one of the variables is dependent on the other one, but the other one is independent. The researcher does not change the independent variable.
The research is not limited to statistical analysis only but includes other groups and variables also. The research could be conducted on the variables, no matter the kind of relationship they have. The statistical analysis method is used to acquire the results.
Experimental Research
This kind of research is based on proving or contradicting a theory or statement. It is also known as true experimentation and is usually focused on single or multiple theories.
The respective theory is not proven yet, and the research method is commonly used in natural sciences.
There could be some theories involved in this research. Due to this, it is more common in social sciences.
Types of Data Collection Methodologies in Quantitative Research
After determining the kind of research, finding the right data collection method is the most important step. Data could be collected through both the sampling and surveys and polls method.
Sampling Data Collection Method
In quantitative research, two types of sampling methods are used: probability and non-probability sampling.
1. Probability Sampling
The data is collected by sifting some individuals from the general population and creating samples. The individuals, data samples are chosen randomly and without any particular selection criteria.
Probability sampling is further divided into the following kinds.
- Simple Random Sampling - This kind of data selection is the simplest one, and the participants are chosen randomly. This kind of sampling is conducted on a large population.
- Stratified Random Sampling - In this sampling, the population is divided into several groups and strata. The participants for the research are chosen randomly from those groups.
- Cluster Sampling - In cluster sampling, the population is divided into several clusters based on geography and demography.
- Systematic Sampling - In this, the samples from the population are chosen at regular intervals. These intervals are predefined, and usually, they are calculated based on the population or size of the target sample.
2. Non-Probability Sampling
In this kind of data collection, the researcher uses his knowledge and experience to choose the samples. The researcher is involved and has a set of criteria. Due to this, not all individuals have the chance to be selected for the research.
Below are the main types of non-probability sampling frameworks.
- Convenience Sampling - These kinds of samples are probably the easiest to obtain. They are chosen only because they are the easiest ones to obtain. They are usually closer to the researcher, and these samples are easy to work with because there are no rigid parameters.
- Consecutive Sampling - This is similar to convenience sampling, but the researcher could choose a specific group of people for his research. The researcher could repeat the process with other groups of samples.
- Quota Sampling - The researchers select some specific elements based on the researcher’s target personalities and traits. Based on this, different individuals in the groups have equal chances of getting selected.
- Snowball Sampling - This kind of sampling is done on a target audience or a chosen group that is difficult to contact. In this, the chosen group is difficult to put together.
- Judgemental Sampling - This kind of sample is built based on the researcher’s skills, experience, and preferences.
Survey and Polls Data Collection Method
After the sample or group is chosen, the researcher could use polls or surveys to collect the required research data.
In this kind of research, the data is collected from a selected group of people. The data is used to identify new trends and collect information about different things and topics. Through the survey, the researcher could reach a wider population.
Based on the time allocated for the research, it could be used to collect more information and data.
When creating questions and options for the survey, the researchers use four measurement scales or criteria. These four parameters include nominal, interval, ordinal, and ratio measurement scales. Without them, no multiple-choice questions could be created.
The questions used for the survey must be close-ended. These could be a mix of different kinds of questions, and the responses could be analyzed through different rating scales.
After creating the survey, the next thing is to distribute it. Below are some of the commonly used survey distribution methods.
- Email - The most common method of distributing the survey is email management software to dispense the survey to your selected participants.
- Buying the Respondents - This is also a quite famous and widely used survey distribution method. Select the respondent and have him respond to the survey. Since the respondents would be knowledgeable, they will help in maximizing the results.
- Embedding the Survey on a Website - This is a great way of getting more responses and targeted results. Embedding the survey on a website works because the researcher is at the right place and close to the brand.
- Social Distribution - Distributing the survey through a social media platform helps collect more responses from the right audience.
- QR Code - The survey is stored in the QR code, and it is printed in magazines or on business cards.
- SMS Survey - It is the most convenient way of collecting more responses and data.
Like surveys, polls are also used to collect the data. It also has close-ended quantitative research questions, and election and exit polls are commonly used in this survey.
Quantitative vs. Qualitative Research
Quantitative and qualitative research are major kinds of research. They are mainly used in the subjects that follow detailed research patterns. How does it differ from quantitative research?
Below is a detailed comparison of the two kinds of research.
Want to know more about the differences between these types of research? Check out this extensive read on qualitative vs. quantitative research to get more insights!
Advantages and Strengths of Quantitative Research
Quantitative research offers several advantages to researchers. Some of the main reasons why researchers use this kind of research are discussed below:
- The Data Can Be Replicated - The research and study could be replicated. The data collection methods and definitions of the concepts are clear and easy to understand.
- The Results Can Be Compared Easily - The same study could be conducted in different cultural settings and sample groups. The results could also be compared statistically.
- Usage of Large Samples - Data and information from large samples could be processed and analyzed using different research procedures.
- Hypothesis Could be Tested - The researcher could use formal hypothesis testing. He could report the data collection, research variables, research predictions, and testing techniques before forecasting and establishing any conclusion.
- The Data Collection is Quick - The data could be collected easily and from a wider population. The usage of statistical methods and conducting and analyzing results is also easy and to the point.
- The Data Analysis is Inclusive - Quantitative data and research offer a wider population for sampling. They could be analyzed through research and analysis procedures.
Due to all of these advantages, researchers prefer using this kind of research method. It is easy to sample, collect, and analyze data and repeat the procedure easily.
Disadvantages and Weaknesses of Quantitative Research
Despite the benefits for the researchers, quantitative research design has some limitations. It may not be suitable for more complex and detailed kinds of topics.
Below are some common quantitative research limitations.
- Superficial - since the research includes limited and precise research samples. In quantitative research, the research is presented in numbers. They could be explained in detail through qualitative data and research.
- Limited Focus - the focus is narrow and limited, and the researcher would have to ignore other relevant and important variables.
- Biased Structure - structural biases could exist and affect sampling methods, data collection, and measurement results.
- Lack of Proper Conditions - sometimes, quantitative research may not include other important factors to collect the data.
Due to these reasons, quantitative research is not an ideal choice for detailed kinds of research. For them, qualitative research works better.
To help you further, we have added some useful examples of quantitative research here.
Quantitative Research Examples
Below are some helpful quantitative research examples to help you understand it better.
Sample Quantitative Research
Quantitative Research Example for Students
Now that you've got the hang of how to do quantitative research and why it's valuable, you're all set to begin your research journey.
The qualitative research method shows the idea and perception of your targeted audience. However, not every student is able to choose the right approach while writing a research paper. It requires a thorough understanding of both qualitative research and quantitative research methods.
This is where the professional help from MyPerfectWords.com comes in. We offer custom essay help with your academic assignments at affordable rates.
Contact our customer support and place " write my research paper " order today!

Write Essay Within 60 Seconds!

Nova Allison is a Digital Content Strategist with over eight years of experience. Nova has also worked as a technical and scientific writer. She is majorly involved in developing and reviewing online content plans that engage and resonate with audiences. Nova has a passion for writing that engages and informs her readers.

Paper Due? Why Suffer? That’s our Job!
Keep reading


Understanding data analysis: A beginner's guide
Before data can be used to tell a story, it must go through a process that makes it usable. Explore the role of data analysis in decision-making.
What is data analysis?
Data analysis is the process of gathering, cleaning, and modeling data to reveal meaningful insights. This data is then crafted into reports that support the strategic decision-making process.
Types of data analysis
There are many different types of data analysis. Each type can be used to answer a different question.
Descriptive analytics
Descriptive analytics refers to the process of analyzing historical data to understand trends and patterns. For example, success or failure to achieve key performance indicators like return on investment.
An example of descriptive analytics is generating reports to provide an overview of an organization's sales and financial data, offering valuable insights into past activities and outcomes.
Predictive analytics
Predictive analytics uses historical data to help predict what might happen in the future, such as identifying past trends in data to determine if they’re likely to recur.
Methods include a range of statistical and machine learning techniques, including neural networks, decision trees, and regression analysis.
Diagnostic analytics
Diagnostic analytics helps answer questions about what caused certain events by looking at performance indicators. Diagnostic analytics techniques supplement basic descriptive analysis.
Generally, diagnostic analytics involves spotting anomalies in data (like an unexpected shift in a metric), gathering data related to these anomalies, and using statistical techniques to identify potential explanations.
Cognitive analytics
Cognitive analytics is a sophisticated form of data analysis that goes beyond traditional methods. This method uses machine learning and natural language processing to understand, reason, and learn from data in a way that resembles human thought processes.
The goal of cognitive analytics is to simulate human-like thinking to provide deeper insights, recognize patterns, and make predictions.
Prescriptive analytics
Prescriptive analytics helps answer questions about what needs to happen next to achieve a certain goal or target. By using insights from prescriptive analytics, organizations can make data-driven decisions in the face of uncertainty.
Data analysts performing prescriptive analysis often rely on machine learning to find patterns in large semantic models and estimate the likelihood of various outcomes.
analyticsText analytics
Text analytics is a way to teach computers to understand human language. It involves using algorithms and other techniques to extract information from large amounts of text data, such as social media posts or customer previews.
Text analytics helps data analysts make sense of what people are saying, find patterns, and gain insights that can be used to make better decisions in fields like business, marketing, and research.
The data analysis process
Compiling and interpreting data so it can be used in decision making is a detailed process and requires a systematic approach. Here are the steps that data analysts follow:
1. Define your objectives.
Clearly define the purpose of your analysis. What specific question are you trying to answer? What problem do you want to solve? Identify your core objectives. This will guide the entire process.
2. Collect and consolidate your data.
Gather your data from all relevant sources using data analysis software . Ensure that the data is representative and actually covers the variables you want to analyze.
3. Select your analytical methods.
Investigate the various data analysis methods and select the technique that best aligns with your objectives. Many free data analysis software solutions offer built-in algorithms and methods to facilitate this selection process.
4. Clean your data.
Scrutinize your data for errors, missing values, or inconsistencies using the cleansing features already built into your data analysis software. Cleaning the data ensures accuracy and reliability in your analysis and is an important part of data analytics.
5. Uncover valuable insights.
Delve into your data to uncover patterns, trends, and relationships. Use statistical methods, machine learning algorithms, or other analytical techniques that are aligned with your goals. This step transforms raw data into valuable insights.
6. Interpret and visualize the results.
Examine the results of your analyses to understand their implications. Connect these findings with your initial objectives. Then, leverage the visualization tools within free data analysis software to present your insights in a more digestible format.
7. Make an informed decision.
Use the insights gained from your analysis to inform your next steps. Think about how these findings can be utilized to enhance processes, optimize strategies, or improve overall performance.
By following these steps, analysts can systematically approach large sets of data, breaking down the complexities and ensuring the results are actionable for decision makers.
The importance of data analysis
Data analysis is critical because it helps business decision makers make sense of the information they collect in our increasingly data-driven world. Imagine you have a massive pile of puzzle pieces (data), and you want to see the bigger picture (insights). Data analysis is like putting those puzzle pieces together—turning that data into knowledge—to reveal what’s important.
Whether you’re a business decision maker trying to make sense of customer preferences or a scientist studying trends, data analysis is an important tool that helps us understand the world and make informed choices.
Primary data analysis methods

Quantitative analysis
Quantitative analysis deals with numbers and measurements (for example, looking at survey results captured through ratings). When performing quantitative analysis, you’ll use mathematical and statistical methods exclusively and answer questions like ‘how much’ or ‘how many.’

Qualitative analysis
Qualitative analysis is about understanding the subjective meaning behind non-numerical data. For example, analyzing interview responses or looking at pictures to understand emotions. Qualitative analysis looks for patterns, themes, or insights, and is mainly concerned with depth and detail.
Data analysis solutions and resources
Turn your data into actionable insights and visualize the results with ease.
Microsoft 365
Process data and turn ideas into reality with innovative apps, including Excel.
Importance of backing up data
Learn how to back up your data and devices for peace of mind—and added security.
Copilot in Excel
Go deeper with your data using Microsoft Copilot—your AI assistant.
Excel expense template
Organize and track your business expenses using Excel.
Excel templates
Boost your productivity with free, customizable Excel templates for all types of documents.
Chart designs
Enhance presentations, research, and other materials with customizable chart templates.
Follow Microsoft

Quantitative Data Analysis
A Companion for Accounting and Information Systems Research
- © 2017
- Willem Mertens 0 ,
- Amedeo Pugliese 1 ,
- Jan Recker ORCID: https://orcid.org/0000-0002-2072-5792 2
QUT Business School, Queensland University of Technology, Brisbane, Australia
You can also search for this author in PubMed Google Scholar
Dept. of Economics and Management, University of Padova, Padova, Italy
School of accountancy, queensland university of technology, brisbane, australia.
- Offers a guide through the essential steps required in quantitative data analysis
- Helps in choosing the right method before starting the data collection process
- Presents statistics without the math!
- Offers numerous examples from various diciplines in accounting and information systems
- No need to invest in expensive and complex software packages
47k Accesses
24 Citations
13 Altmetric
This is a preview of subscription content, log in via an institution to check access.
Access this book
- Available as EPUB and PDF
- Read on any device
- Instant download
- Own it forever
- Compact, lightweight edition
- Dispatched in 3 to 5 business days
- Free shipping worldwide - see info
- Durable hardcover edition
Tax calculation will be finalised at checkout
Other ways to access
Licence this eBook for your library
Institutional subscriptions
Table of contents (9 chapters)
Front matter, introduction.
- Willem Mertens, Amedeo Pugliese, Jan Recker
Comparing Differences Across Groups
Assessing (innocuous) relationships, models with latent concepts and multiple relationships: structural equation modeling, nested data and multilevel models: hierarchical linear modeling, analyzing longitudinal and panel data, causality: endogeneity biases and possible remedies, how to start analyzing, test assumptions and deal with that pesky p -value, keeping track and staying sane, back matter.
- quantitative data analysis
- nested models
- quantitative data analysis method
- building data analysis skills
About this book
Authors and affiliations.
Willem Mertens
Amedeo Pugliese
About the authors
Willem Mertens is a Postdoctoral Research Fellow at Queensland University of Technology, Brisbane, Australia, and a Research Fellow of Vlerick Business School, Belgium. His main research interests lie in the areas of innovation, positive deviance and organizational behavior in general.
Amedeo Pugliese (PhD, University of Naples, Federico II) is currently Associate Professor of Financial Accounting and Governance at the University of Padova and Colin Brain Research Fellow in Corporate Governance and Ethics at Queensland University of Technology. His research interests span across boards of directors and the role of financial information and corporate disclosure on capital markets. Specifically he is studying how information risk faced by board members and its effects on the decision-making quality and monitoring in the boardroom.
Jan Recker is Alexander-von-Humboldt Fellow and tenured Full Professor of Information Systems at Queensland University of Technology. His research focuses on process-oriented systems analysis, Green Information Systems and IT-enabled innovation. He has written a textbook on scientific research in Information Systems that is used in many doctoral programs all over the world. He is Editor-in-Chief of the Communications of the Association for Information Systems, and Associate Editor for the MIS Quarterly.
Bibliographic Information
Book Title : Quantitative Data Analysis
Book Subtitle : A Companion for Accounting and Information Systems Research
Authors : Willem Mertens, Amedeo Pugliese, Jan Recker
DOI : https://doi.org/10.1007/978-3-319-42700-3
Publisher : Springer Cham
eBook Packages : Business and Management , Business and Management (R0)
Copyright Information : Springer International Publishing Switzerland 2017
Hardcover ISBN : 978-3-319-42699-0 Published: 10 October 2016
Softcover ISBN : 978-3-319-82640-0 Published: 14 June 2018
eBook ISBN : 978-3-319-42700-3 Published: 29 September 2016
Edition Number : 1
Number of Pages : X, 164
Number of Illustrations : 9 b/w illustrations, 20 illustrations in colour
Topics : Business Information Systems , Statistics for Business, Management, Economics, Finance, Insurance , Information Systems and Communication Service , Corporate Governance , Methodology of the Social Sciences
- Publish with us
Policies and ethics
- Find a journal
- Track your research
- SVP Experience
- Ethical Business Decisions Playbook
- Silicon Valley Hiring Guide
- Tuition and Financial Aid
- GMAT/GRE Waiver
- Admissions Requirements
- Application Deadlines
- How to Apply
- Networking Opportunities
- Student Success
Quantitative Methods in Business Analytics

Quantitative data analysis for business intelligence (BI) examines business issues through statistical, mathematical, or computational techniques. Business analysts collect and examine numerical data to identify trends, patterns, and relationships that inform strategic business decisions. 1
Quantitative methods in BI drive decision-making by giving business leaders a solid foundation for making informed choices backed by data rather than intuition alone. Using quantitative analysis, leaders can forecast future trends, optimize operations, improve product offerings, and increase customer satisfaction. 1
This article will examine how quantitative methods in business intelligence support strategic decision-making and foster innovation and competitive advantage.
Descriptive Analytics
Descriptive analytics, a term for analytical models based on historical data, answers the question, “What happened?” These models provide insight into past business performance by analyzing historical records. Descriptive analytic models uncover meaningful patterns and relationships in data that can be displayed through summary statistics and data visualization techniques. They also serve as a starting point for more in-depth, advanced forms of analysis, such as predictive and prescriptive analytics. 2
Data visualization tools present complex datasets in visually appealing and easily understandable formats. Tools such as bar charts, line graphs, heat maps, and scatter plots allow analysts and business stakeholders to understand trends, outliers, and patterns intuitively, at a glance. Effective visualization acts as a powerful tool for communicating the story behind the data, enabling decision-makers to derive actionable insights quickly and efficiently. 3
Summary statistics provide a concise overview of data distributions. These metrics help business leaders understand the general behavior of data, highlighting key data points and identifying anomalies. 4
Data exploration is an introductory step in more complex data analysis. Analysts examine datasets to discover initial insights by cleaning data, identifying missing values, and understanding the basic structure of the dataset. Through data exploration, businesses can uncover hidden opportunities, gain a deeper understanding of consumer behavior , and make more informed decisions. 5
Predictive Analytics
Predictive analytics uses statistical techniques that analyze current and historical facts to make predictions about future or otherwise unknown events. It answers the question, “What will happen?” It includes different forecasting methods and predictive modeling techniques, including advanced machine learning algorithms and time series analysis to anticipate future trends, behaviors and activities. 6
Time series analysis is useful when the data is sequential and indexed by time. It analyzes time-ordered data points to help business leaders understand the underlying structure and function that produce the sequences. This analysis helps in forecasting future values based on past observations, which is particularly useful in domains such as finance, weather forecasting and inventory planning. 6
Forecasting methods apply mathematical models to historical data to predict future occurrences. Techniques range from simple moving averages to complex algorithms that adjust for seasonality, trends, and cyclical patterns. These methods help in planning and decision-making for businesses and organizations. 6
Predictive modeling techniques that use machine learning can learn from historical data and improve over time, making them exceptionally powerful for predicting future events. These models can handle complex interactions between variables and scale with data, so they have a wide variety of use cases, including marketing, finance, and healthcare. Through predictive analytics, business leaders can anticipate changes, optimize strategies, and mitigate risks effectively. 6
Prescriptive Analytics
Prescriptive analytics takes statistical analysis in business analytics further by recommending actions that can potentially lead to desired results. It answers the question, “How can we make something happen?” This advanced form of analytics uses tools and techniques such as optimization, simulation, and decision analysis, to advise on possible outcomes and guide decision-makers. 7
Optimization techniques, such as linear programming, find the best possible solution from a set of available alternatives under given constraints. These techniques are widely used in logistics, resource allocation, and scheduling to make sure that resources are used efficiently to maximize output or minimize costs. 8
Simulation methods allow organizations to model complex systems and scenarios to predict the outcomes of different decisions. By creating a virtual replica of a real-world process, simulations can explore a vast range of possibilities and their outcomes, making them invaluable in risk management and strategic planning. 9
Decision trees and decision analysis offer a structured approach to decision-making, breaking down complex decisions into simpler, smaller parts. This helps in visualizing the outcomes of different actions, weighing them against each other, and determining the path that leads to the best possible outcome. Together, these tools empower businesses to make informed, data-driven decisions that can significantly impact their success and growth. 10
Inferential Statistics
Inferential statistics is a mathematical model in business intelligence that allows businesses to make predictions or inferences about a population based on a sample of data drawn from that population. This methodology bridges the gap between the data businesses have and the conclusions they need to draw about a broader context. Hypothesis testing and confidence intervals allow analysts to make broader generalizations from sample data. 11
Hypothesis testing provides a framework for making decisions and drawing conclusions about population parameters. It starts by forming a null hypothesis, which is a statement of no effect or difference, and an alternative hypothesis, which is a statement indicating an effect. Through statistical tests, analysts can assess the strength of the evidence against the null hypothesis and determine whether it can be rejected in favor of the alternative hypothesis. 11
Confidence intervals offer another way to understand the uncertainty of an estimate. A confidence interval provides a range of values derived from the sample data that is likely to contain the true population parameter. The width of the interval gives an idea of the estimate's precision, with narrower intervals indicating more reliable estimates. 11
Regression analysis—another type of inferential statistics—is used to examine the relationship between two or more variables. It helps to understand how the dependent variable changes when any one of the independent variables is altered while the other independent variables stay the same. This analysis helps predict outcomes and test theories in various fields, from economics to social sciences. 12
Data-Driven Knowledge: Getting Ahead is Good Business
Stay ahead of the ongoing advancements in business by earning Santa Clara University’s Online Master of Science in Business Analytics . Mentored by our experienced faculty of industry experts , you’ll become proficient in business analytics, machine learning, and information technology, learning to use data-driven insights to lead innovation and foster organizational growth.
Balance your education with your employment and personal commitments. Our flexible online program is designed for working professionals looking to expand their networks and improve their career potential. It delivers the foundational business knowledge and principled leadership skills to propel your advancement, in Silicon Valley and beyond.
To learn more about how the Leavey School of Business can help you reach your goals, schedule a call with an admissions outreach advisor today.
- Retrieved on March 22, 2024, from linkedin.com/pulse/quantitative-techniques-understand-importance-business-ram-m/
- Retrieved on March 22, 2024, from investopedia.com/terms/d/descriptive-analytics.asp
- Retrieved on March 22, 2024, from aws.amazon.com/what-is/data-visualization/#
- Retrieved on March 22, 2024, from betterevaluation.org/methods-approaches/methods/summary-statistics#
- Retrieved on March 22, 2024, from spotfire.com/glossary/what-is-data-exploration#
- Retrieved on March 22, 2024, from ibm.com/topics/predictive-analytics
- Retrieved on March 22, 2024, from investopedia.com/terms/p/prescriptive-analytics.asp
- Retrieved on March 22, 2024, from mathworks.com/discovery/prescriptive-analytics.html#
- Retrieved on March 22, 2024, from baobabsoluciones.es/en/blog/2020/11/19/prescriptive-analytics-optimisation-and-simulation/
- Retrieved on March 22, 2024, from lumivero.com/resources/blog/the-analytics-pyramid-why-analytics-are-critical-for-defensible-objective-decision-making
- Retrieved on March 22, 2024, from corporatefinanceinstitute.com/resources/data-science/inferential-statistics/#
- Retrieved on March 22, 2024, from cuemath.com/data/inferential-statistics/
Return to Media
Santa Clara University has engaged Everspring , a leading provider of education and technology services, to support select aspects of program delivery.
Interested in one of our online programs? Receive a program brochure.

Public Health Data Analyst - Community Health
Responsibilities:.
- Provide support to all phases of planning and implementation for multiple ongoing projects and evaluations including study design, data collection, data analysis, and reporting.
- Conduct literature reviews and environmental scans.
- Collect data via key informant interviews, focus groups, surveys, and policy or document review.
- Synthesize quantitative and qualitative data and contribute to summarizing findings and recommendations in clear language for clients and other audiences.
- Contribute to dissemination of findings through data visualization, translating data/information for public documents, and presentation of work.
- Assist project leads in various administrative tasks on projects including notetaking, scheduling data collection activities and events, and coordinating various aspects of projects.
- Balance the needs of multiple simultaneous projects with competing deadlines.
- Demonstrate initiative, desire to learn, and self-motivation to improve programs and processes.
- Liaise and coordinate with a range of clients and internal project partners.
- Provide thought leadership and self-manage time and resources effectively across projects.
- Follow all applicable privacy and confidentiality procedures in daily work.
Qualifications:
- Master’s degree in public health or related field with at least 1 year of professional experience.
- Knowledge of quantitative and qualitative analysis. Previous experience with analytical software such as Microsoft Excel, NVivo, SAS, SPSS, or R highly desired.
- Knowledge of, and experience with, maternal and child health, especially maternal and child health systems, and/or food and nutrition programs is a plus. WIC,
- Knowledge of wide range of research methods and processes, including literature reviews, quantitative analysis, qualitative methods, and formal writing.
- Experience with data collection, such as key informant interviews, desired, but not required.
- Excellent written and verbal communication skills.
- Analytical thinker with exceptional attention to quality and detail.
- An inquisitive and innovative nature, integrity, willingness to step into new roles, team-focused mentality, and a commitment to continuously learning and improving.
- Self-motivated with demonstrated skills in independent management of time and tasks.
- Experience in virtual work setting and competency using Zoom or Microsoft Teams preferred.
Logistical Requirements:
- At this time, we will only accept candidates who are presently eligible to work in the United States and will not require sponsorship.
- Our organization requires that all work, for the duration of your employment, must be completed in the continental U.S. unless required by contract.
- If you are local to our offices in Arlington, Silver Spring, Ann Arbor, or Portland this role will be hybrid.
- Must be able to work during eastern time unless approved by your manager.
Altarum Home Page
- Open access
- Published: 01 May 2024
Health system lessons from the global fund-supported procurement and supply chain investments in Zimbabwe: a mixed methods study
- Abaleng Lesego 1 ,
- Lawrence P. O. Were 1 , 2 ,
- Tsion Tsegaye 1 ,
- Rafiu Idris 3 ,
- Linden Morrison 3 ,
- Tatjana Peterson 3 ,
- Sheza Elhussein 3 ,
- Esther Antonio 4 ,
- Godfrey Magwindiri 4 ,
- Ivan Dumba 5 ,
- Cleyland Mtambirwa 5 ,
- Newman Madzikwa 5 ,
- Raiva Simbi 5 ,
- Misheck Ndlovu 6 &
- Tom Achoki 1
BMC Health Services Research volume 24 , Article number: 557 ( 2024 ) Cite this article
200 Accesses
Metrics details
The Global Fund partnered with the Zimbabwean government to provide end-to-end support to strengthen the procurement and supply chain within the health system. This was accomplished through a series of strategic investments that included infrastructure and fleet improvement, training of personnel, modern equipment acquisition and warehouse optimisation. This assessment sought to determine the effects of the project on the health system.
This study employed a mixed methods design combining quantitative and qualitative research methods. The quantitative part entailed a descriptive analysis of procurement and supply chain data from the Zimbabwe healthcare system covering 2018 – 2021. The qualitative part comprised key informant interviews using a structured interview guide. Informants included health system stakeholders privy to the Global Fund-supported initiatives in Zimbabwe. The data collected through the interviews were transcribed in full and subjected to thematic content analysis.
Approximately 90% of public health facilities were covered by the procurement and distribution system. Timeliness of order fulfillment (within 90 days) at the facility level improved from an average of 42% to over 90% within the 4-year implementation period. Stockout rates for HIV drugs and test kits declined by 14% and 49% respectively. Population coverage for HIV treatment for both adults and children remained consistently high despite the increasing prevalence of people living with HIV. The value of expired commodities was reduced by 93% over the 4-year period.
Majority of the system stakeholders interviewed agreed that support from Global Fund was instrumental in improving the country's procurement and supply chain capacity. Key areas include improved infrastructure and equipment, data and information systems, health workforce and financing. Many of the participants also cited the Global Fund-supported warehouse optimization as critical to improving inventory management practices.
It is imperative for governments and donors keen to strengthen health systems to pay close attention to the procurement and distribution of medicines and health commodities. There is need to collaborate through joint planning and implementation to optimize the available resources. Organizational autonomy and sharing of best practices in management while strengthening accountability systems are fundamentally important in the efforts to build institutional capacity.
Peer Review reports
The Global Fund to Fight AIDS, Tuberculosis and Malaria (Global Fund), together with its Zimbabwean national and international stakeholders have continued to invest in health system strengthening to improve public health in the country. These investments have been guided by systemwide strategic assessments to understand the fundamental challenges facing the Zimbabwean health system [ 1 , 2 , 3 , 4 ].
Given the strategic importance of access to essential medicines, vaccines, and other health technologies as a strategic pillar of any health system [ 4 , 5 ], the Global Fund supported the Ministry of Health and Child Care (MOHCC) through the United Nations Development Program (UNDP) to undertake a comprehensive assessment of the national procurement and supply chain management (PSCM) system in 2013 [ 6 ]. This assessment aimed to develop a strategic vision and costed action plan for improvement. This covered both upstream and downstream aspects of PSCM. The strategic purpose was to help the MOHCC launch a coordinated approach to invest in PSCM improvements and enhance coordination and cooperation in managing all health commodities across the health system [ 3 , 6 , 7 ].
Subsequently, the Global Fund supported several initiatives aimed at the realization of the improvements proposed by the comprehensive assessment undertaken by UNDP [ 6 ]. These initiatives primarily encompassed end-to-end supply chain assistance in critical areas, including demand quantification and forecasting, warehousing capacity development, fleet improvement, distribution systems, and waste management systems. Other support aspects focused on warehouse optimization, data and information management systems, and personnel training [ 7 , 8 ]. In general, warehouse optimization is the process of improving the efficiency and effectiveness of warehouse operations. It involved refining workflows, leveraging technology, enhancing spatial utilization, and ensuring precise inventory management [ 6 , 7 ].
More specifically, the Global Fund provided funds for the construction of warehouses for the National Pharmaceutical Company of Zimbabwe (NATPHARM) to facilitate the smooth handling of health commodities. Additionally, this support extended to water supplies (in terms of sinking boreholes) for various warehouses, water tanks, and booster pumps for the other branches. Global Fund also supported NATPHARM in constructing two incinerators in the two main cities, Harare, and Bulawayo to handle pharmaceutical waste effectively [ 9 , 10 ].
Through Global Fund support, NATPHARM also received modern warehouse equipment such as forklifts, pallet jacks and rolling ladders, and data and information management system support for better visibility and effective handling of health commodities. The support further extended to optimising the Harare branch warehouse with modern receiving and transit capabilities to serve other feeder locations and the procurement of modern delivery trucks to facilitate the distribution of commodities. Global Fund support also extended to personnel training and retention for the effective functioning of NATPHARM and the broader procurement and supply system [ 3 , 6 , 9 ].
Focusing on quality assurance and safety of medicines and other health commodities, Global Fund supported the Medicines Control Authority of Zimbabwe (MCAZ) to develop capacity in quality testing of all commodities procured through grants. MCAZ was also supported with the installation of solar panels that allowed for an uninterrupted power supply to facilitate smooth operations at the organization. The Global Fund support was also critical in the upgrading of the biology and chemistry laboratories to attain WHO prequalification standards [ 8 , 9 , 11 ]. Similarly, there was direct support from the Global Fund to facilitate pharmacovigilance activities, such as adverse drug reactions reporting using electronic systems. All these measures were meant to ensure that the medicines and health commodities consumed in the Zimbabwean health system were safe and quality-assured [ 4 , 5 , 9 , 11 ].
The overarching project by the Global Fund to support the Zimbabwean government was designed and implemented in response to the nationally identified gaps and opportunities that were established through various research and consultative efforts [ 3 , 4 , 6 , 8 ]. The project was kickstarted in the first quarter of 2019 and continued through 2021, with various project components being implemented in a phased approach to achieve the national targets [ 3 , 4 , 7 , 10 , 11 ]. To ensure effective coordination, accountability, and avoidance of duplicative efforts, the project was designed and implemented in close coordination with other partners represented in the National Health Development Partners Coordination Forum (HDPCF), Health Sector Technical Working Group (HSTWG), and the Global Fund Country Coordination Mechanism (CCM), among others [ 3 , 4 , 6 , 8 , 10 ]. There was regular reporting to the respective coordination mechanisms to track progress as well as troubleshoot any implementation issues as they arose [ 6 , 9 ].
Overall, the gaps identified through the various assessments commissioned by the Global Fund included a lack of effective coordination, poor inventory and order management, human resource constraints, and warehousing and storage inefficiencies [ 12 , 13 ]. Therefore, the focus of the Global Fund support was to retool the Zimbabwean PSCM system to be efficient, cost-effective and responsive to the population's health needs, particularly in the face of global epidemics and pandemics such as HIV/AIDS and COVID-19 [ 14 , 15 , 16 , 17 , 18 ].
In an attempt to resolve these issues, healthcare systems around the world are working on streamlining their supply chains through various health system strengthening measures [ 19 , 20 , 21 , 22 ]. Therefore, the objective of this analysis was to assess the overall effects of the Global Fund-supported investments in the Zimbabwean PSCM system and document the lessons learned to inform future programming efforts to strengthen healthcare systems.
The assessment covered a period of 2018 -2021 and employed both qualitative and quantitative research methods. Figure 1 . illustrates the convergent mixed methods study design that was applied. In this study design, both the qualitative and quantitative data collection and analyses are implemented simultaneously, and the insights merged to provide a fuller picture [ 23 ].

Convergent mixed methods design
The quantitative part of the study entailed collecting and analysing administrative data covering priority indicators that are routinely reported on the Zimbabwe PSCM. Meanwhile, the qualitative part comprised of key informant interviews (KII) focusing on stakeholders within the healthcare system to give perspective to the observed data trends. Insight from the two parts of the analysis were merged and subjected to comparative assessment and interpretation to ensure that a consistent picture emerged [ 23 , 24 ]. More details on the methods are provided in later sections.
Analytical framework
The overall analytical approach espoused in this assessment was anchored on the logical relationships of the building blocks of the health system as described by the World Health Organization (WHO) health system framework [ 5 ]. Figure 2 shows the analytical framework, which illustrates the results chain cascading from the Global Fund-supported initiatives to the expected improvements in intermediate and long-term outcomes related to PSCM, including the availability of medicines, reduced wastage, and overall improvements in population-level coverage [ 4 , 5 ].

Analytic framework
Overall, the framework graphically displays the results Global Fund intended to achieve through its support to the Zimbabwean PSCM. The "theory of change" that underlies the Global Fund’s strategy is revealed through the arrows in the diagram that identify “causal” linkages through which various intermediate results interact to make progress toward the overall goal of improving health system performance [ 3 , 5 ].
Quantitative research
The quantitative research entailed a detailed descriptive analysis of the operational data that was routinely reported across the Zimbabwe PSCM system. Table 1 . shows some of the key performance indicators (KPI) that were considered in our analysis.
Data collection, management and analysis
The data used in this analysis were obtained from the routinely reported operational data that included the NATPHARM-operated warehouses and healthcare facilities in the country. The data were extracted from the various data management systems operated by the different institutions, cleaned, and collated into a comprehensive dataset in the form of a spreadsheet covering the period of the assessment. The database was examined for completeness and accuracy by cross-referencing the corresponding progress reports for specific periods. Trends of priority indicators were compared over time, as they related to Global Fund support to the PSCM space.
Qualitative research
The qualitative assessment entailed KIIs with health system stakeholders who were knowledgeable and intimately involved in the Global Fund-supported initiatives and its intended beneficiaries. This included provincial and district management teams, hospital and clinic personnel, and other stakeholders in the Zimbabwe health system. Informed consent was obtained from each study participant involved in the study. The data collection protocol ensured that all study participants fully understood the objectives of the study and consented verbally to provide the required information.
As previously stated, the literature review helped map and identify critical organisations involved in the PSCM space, and more specifically, those involved in the procurement and health system strengthening activities supported by the Global Fund. A full list of those organisations is provided on Table 2 .
Sampling techniques
Convenience purposive sampling was used to select key informants and in-depth interviews [ 23 ]. Our sample was supplemented using snowball sampling methods (also called chain sampling). The initial respondents referred other potential respondents until no new information was forthcoming or achieved saturation. Efforts were made to be all-inclusive, involving various stakeholder groups and organisations intimately linked to the operations of the Zimbabwe PSCM landscape.
This comprised of KIIs using a structured interview guide that covered various thematic areas relevant to the assessment to obtain a comprehensive perspective of the impact of the Global Fund-supported initiatives in the country. In its development, testing and validation, the key informant guide was pretested and adapted to ensure suitability for the task. In view of the restrictions imposed to prevent the spread of COVID-19 infections at the time of the study, some KIIs were conducted online using multimedia channels such as Zoom, Skype, and telephonically.
Three research assistants supported the two project leaders in conducting the KIIs. After each interview, all notes taken by the research assistant were checked by the two project leaders to ensure completeness and readability to minimise recording errors. In addition, a tape recorder was used for interviews to assist with reference post data collection. All the recordings were stored in a pin-protected cloud storage which was only accessible by the two project evaluation leaders. Qualitative data obtained from the KIIs were transcribed in full and then manually analysed applying thematic content analysis. Where there was a divergence of opinion, an agreement was established through discussion with three members of the project evaluation team. In thematic analysis, data from interview transcripts were grouped into similar concepts. This approach was appropriate for semi-structured expert interviews as it is used to code text with a predefined coding system that can then be refined and completed with new themes emerging [ 23 , 24 ]. Our initial coding system was defined during the desk review stage and continuously updated in the successive phases of data collection employing a deductive approach of qualitative research. The emerging themes were not preconceived (desk review) but emerged from the data during the coding process, while the global themes were the highest-order themes that emerged from the data and were broad enough to capture the essence of the entire dataset [ 23 ]. The codes are presented in a tabular format in the results section below.
This section presents both the quantitative and qualitative research results from the study. The quantitative results comprise of trends of the priority operational PSCM indicators for the relevant period. The qualitative results present the perspectives of the key health stakeholders involved in the Zimbabwe healthcare system.
Quantitative results
Table 3 shows that the total warehouse capacity across the Zimbabwean health system increased by 37.8% between 2018 and 2021.
Of the 1500 public health facilities in Zimbabwe coverage by the PSCM system was consistently high between the years 2018 and 2021, averaging 94%, and increasing by 13.6% over the same period. However, order fulfillment rate within 90 days, for 1410 reporting health facilities was consistently below 50% from 2018 to 2020, despite the reported high coverage for the health facilities by the PSCM in the country. Notably, this indicator showed remarkable improvement to 91% in 2021, from an average of 42% from the previous three years. More specifically, the order fill rate for Tenofovir 300mg/ lamivudine 300mg/efavirenz 600mg (TLE 600mg) improved despite the significant drop observed in 2020. However, when comparing 2018 and 2021, the order fill rate for this specific HIV drug increased by around 36.5%, while the stockout rates for the same drug at the central stores declined by about 14.5% over the same period.
Table 3 further shows a 44% drop of order fill rates for the Determine HIV Test Kit between 2018 and 2020 for the 1410 reporting health facilities, only to recover in the year 2021, where order fill rates improved to 83%. At the same time, the stockout rates for the Determine HIV Test Kit at the central stores declined by 49% between 2018 and 2021.
Figure 3 shows the estimated average population coverage for HIV treatment for adults and children, from 2018 to 2020, at 92% and 71%, respectively. The figure shows that there was limited variation in the population level coverage over the years, despite the estimated increase in the number of people living with HIV over the same period. The national target for this indicator is 95%.

Adult and paediatric HIV treatment population coverage
Figure 4 shows the proportion of the value of the expired stock in the 7 warehouses, over three years, between 2019 and 2021, which demonstrates a declining trend over time. The highest expiry was in quarter 4 2019 at 1.9%, compared with the lowest in quarter 3 2021 at 0.1%. This represents a 93% reduction in value of expired stock.

Percentage value of expired stock
Figure 5 shows the combined stock-taking variance valued in United States Dollar terms across 7 warehouses over a three-year period. The stock variance shows a declining trend over the three-year period to negligible values at the end of 2021.

Stock-taking variance
Figure 6 shows the temporal trend of the number of days that it took NATPHARM to resolve the stock variances across the different warehouses in the country. Overall, there is a decline from the average of 8 days from the December 2018 stocktake (with Harare warehouse as an outliner at 25 days), to an average of 1 day in the December 2021 stocktake, where all warehouses converge.

Duration to resolve stock variance
Table 4 shows the funding levels in USD$ to support the diagnostic capacity for Covid-19, comprising of the polymerase chain reaction test (PCR) and rapid diagnostic tests (RDT). The table further shows the PSCM related costs, the total test done, and positive cases identified over the two-year period. The total funding between 2020 and 2021 increased by 290%, with testing levels increasing by 490% over the same period. The average Covid-19 positivity rate in 2020 was 6.4% while the positivity rate for 2021, was 3.1%, indicating a greater than 50% drop.
Qualitative results
Most of the participants interviewed acknowledged that the Global Fund support to NATPHARM and the broader Zimbabwean health system had been central in improving the overall performance of the health system through improved availability of essential medicines and other health commodities. This was largely achieved by ramping up the various components of the PSCM value chain and related operations, leading to efficiency, effectiveness and reliability.
Table 5 shows the codes, emerging and global themes from the thematic content analysis. The emerging themes revolved around the lack of infrastructure and equipment curtailing warehouse operations before the Global Fund support. Data gaps and poor product visibility were also emerging themes, as were the effects of the old fleet on the overall supply and distribution system. Similarly, issues of infrastructure, capacity, and personnel training gaps emerged as crucial themes hindering quality assurance within the PSCM. Global themes also largely focused on infrastructural inadequacy leading to underperformance. Improvements leading to better handling of commodities; data and information systems, enhancing visibility and supporting accuracy in forecasts; improvements in the distribution systems enabled by newer fleets also featured as global themes. Similarly, better trained and motivated personnel, able to perform critical functions; capacity to ensure the quality and safety of medicines and other health commodities; and the need for effective multistakeholder partnerships to improve effectiveness and sustainability of health systems, were key themes.
NATPHARM operations
According to the NATPHARM management, warehouse improvement and optimisation exercise resulted in better visibility and improved efficiency in the operations related to the commodity handling across the entire value chain. More specifically, the processes related to stock taking improved markedly over time according to the reports presented by various organizations that had been commissioned to undertake the stock audits.
“ …. warehouse optimisation supported implementing an inventory management system which conformed with bin location and variant codes, according to different donors. The result was improved, faster and more accurate stock takes, a sharp reduction of variances and more streamlined order processing ” Participant, NATPHARM.
Further, it was reported by various participants that order processing and deliveries had improved to be timely and on schedule as a result of the improved visibility and efficiency harnessed across the PSCM. Similarly, there was consensus that receiving processes and documentation had significantly improved through the support offered by Global Fund particularly towards warehouse optimization. The improvements in the data management systems and related trainings were also cited as contributory to the overall trend that was observed.
“ Reporting quality has greatly improved and is now timely, accurate and complete. This helps in accurate forecasting of demand, which in turn avoids unnecessary wastage and expiries” Participant MOHCC.
There was consensus from the majority of participants interviewed that the fleet improvements had improved the availability of essential commodities vital for the effective management of high burden diseases; HIV/AIDS, Malaria and Tuberculosis in Zimbabwe. According to participants from a local health facility, this was evidenced by low stockout rates for the key commodities needed to manage these three conditions effectively. The new fleet was reported to facilitate deliveries from various warehouses to the recipient health facilities on a regular basis. This level of distributional access coupled with better demand forecasting as a result of improved data use, was noted as critical in the improved availability of medicines and health commodities at the health facility levels.
Further, respondents in the leadership of NATPHARM revealed that the Global Fund support had benefited the overall financial position of the organisation by tapping into efficiencies harnessed through the various measures that have been implemented. Some of the support measures that resulted in efficiency improvements include, the warehouse optimization, pharmaceutical waste management and fleet improvements, which ultimately reduced operational costs.
For example, it was noted that running a newer fleet of vehicles led to lower maintenance and fuelling costs than previously was the case, when deliveries were done using older vehicles. Similarly, it was noted that pharmaceutical waste resulting from expired medicines and other health commodities was expensive to store and dispose, particularly when engaging third party organizations. However, this additional cost was reportedly in the decline, as a result of the investment in the incinerators for waste management.
“ The provision of incinerators for waste management has resulted in huge savings in terms of the cost of waste destruction. It has also resulted in significant compliance with environmental health regulations.”, Participant, NATPHARM.
MCAZ operations
Majority of the participants agreed that the Global Fund support to MCAZ strengthened its overall capacity to handle the requisite safety and quality assurance needs to effectively support the procurement functions for medicines and other health commodities within the country and regionally. The installation of solar panels to provide uninterrupted electricity power supply for the operations of the organization was cited as a huge advantage allowing for improved performance, in a country where power supply is unreliable. Similarly, other participants cited, the support for MCAZ laboratories to obtain the WHO prequalification status, as a major step towards effectiveness and sustainability for the organization; citing the fact that MCAZ is offering quality assurance services regionally at a fee.
“ We [MCAZ] now have the capacity to conduct the safety and quality assurance tests needed to support the procurement of commodities in the country and the region. We [MCAZ] even recently won the tender to support the regional procurement activities ”, Participant, MCAZ.
Based on the results framework provided in Fig. 3 , there is clear evidence that the Global Fund-supported initiatives resulted in positive improvements in the overall performance of the Zimbabwean PSCM system. However, it is important to recognise some of the assessment’s limitations in interpreting these findings. First, the results reported are for a limited observation period and a limited set of indicators, which are largely confined to the national level analysis, missing out on granular subnational and commodity-specific analysis that could be more informative. Secondly, this study was not conceptualised before the onset of the intervention reported here (i.e., Global Fund-supported initiatives), and therefore, no specific steps were taken to develop an appropriate prospective research design and data collection strategy to support a more rigorous assessment. Therefore, the study relied on secondary PSCM data that were sparse and covered a limited period. Third, the study could be subject to confounding relationships with other concurrent interventions being implemented by other health system stakeholders that have direct or indirect effects on the PSCM system, complicating impact attribution to specific interventions. Forth, the analysis focused only on a narrow subset of medicines and commodities related to HIV/AIDS and COVID-19. However, despite these limitations, every effort has been made to use the most up-to-date and complete information available, including validation using official reports and collaborative reported data with key informant interviews.
The estimated population coverage for HIV treatment for both adults and children remained consistently high despite the increasing prevalence in the country. It was estimated that adults living with HIV increased by 10% from a baseline of 2018, to reach 1.3M in 2020, while children living with HIV increased by 24%, from a baseline of 2018, to reach 75 000 in 2020 [ 3 , 4 , 9 ]. As a key last mile population outcome, it can be rightly assumed that high HIV treatment coverage in the Zimbabwean system emanated from strengthened inventory management functionality and improved delivery of orders supported by a modern fleet of vehicles, which allowed for meeting the supply target of four quarterly rounds [ 3 , 8 ]. Population coverage is an important performance measure for a health system. It unites two important concepts; need and utilisation of an intervention to improve health [ 25 ]. In our case, the intervention is HIV treatment and the population in need is those living with HIV needing treatment; and the proportion with access and able to use the treatment they need, represents population coverage. This is a fundamentally important consideration as various health systems, including low- and middle-income countries, are making universal health coverage (UHC) efforts. There is no question, that improved access to essential medicines and other health technologies is a fundamental cornerstone towards UHC [ 1 , 5 , 26 ].
Other intermediate indicators that are critical for progress towards improved availability of medicines and other health commodities and hence UHC, also showed significant improvements that could be attributed to Global Fund-supported initiatives. For example, reduced wastage and decreasing value of expired health commodities reported, point towards improving efficiency across the value chain. As noted earlier, efficiency is one of the fundamental expectations of an effective health system outlined in the WHO health system framework [ 3 , 5 ]. The diminishing value of expiries could be ascribed to various factors, including the improved workflow processes and data accuracy at NATPHARM. This improvement which is associated with better visibility of commodities across the value chain could be attributed to investments made by Global Fund such as the enterprise resource planning platform, coupled with concomitant training and supervision.
Through Global Fund’s assistance to NATPHARM, automation of tasks such as stock management, ordering, and other operational activities was central and contributory to driving the observed improvements in the handling of commodities; reduction of wastage and expiries and improving availability. Similarly, better inventory management and warehouse optimization activities such as decongestion resulted in quicker, timely, more accurate, and well-documented stock takes, improving overall commodity management.
Variances between stock on hand and physical counts were used to determine whether facilities are conducting period checks on their stocks and therefore calculating monthly consumption of commodities accurately. As such the variance across commodities should be zero. Low variance indicates that the stocks at hand are generally similar and do not vary widely from the physical stock counts, while high variance indicates that the respective values have greater variability and are more widely dispersed from one another. There is clear evidence pointing towards the reduction in stock variances when comparing stock on hand and physical counts across the different warehouses in the country over time. This trend can be attributed to better visibility of commodities at the warehouses and training of personnel which was supported by the Global Fund [ 2 , 9 ]. Similarly, the number of days it took the NATPHARM personnel to resolve stock variances showed a dramatic reduction, from an average of 8 days to 1 day in a span of 3 years. This observed trend could also further support the claim that overall, the Global Fund supported initiatives produced the desired results.
With the advent of Covid-19, the effects of the Global Fund support on the PSCM became evident considering the robust response the country was able to mount particularly in terms of diagnostics [ 9 ]. The country was able to rapidly roll out COVID-19 testing, reaching many people between 2020 and 2021. Similarly, the Covid-19 positivity rates declined from 6.4% to about 3.1% over the same period. High positivity rates may indicate that the health system is only testing the sickest patients who seek medical attention and is not casting a wide enough net to know how much of the virus is spreading within its communities. A low rate of positivity on the other hand, can be seen as a sign that a health system has sufficient testing capacity for the size of the Covid-19 outbreak and is testing enough of its population to make informed decisions about reopening the economy. The WHO guidance is that countries which have conducted extensive testing for COVID-19, should remain at 5% or lower positivity rate for at least 14 days.
Safe pharmaceutical waste management and disposal is a primary consideration of any effective health system in completing the PSCM loop [ 27 ]. The Global Fund supported the investment in MOHCC operated incinerators. These investments could largely be associated with reduction in the cost of storage, handling and disposal of the expired stock, particularly when considering that certain space was rented from third parties which often charged a premium. Safe pharmaceutical waste disposal also became more priority with the increased supplies that resulted from the efforts to tackle the Covid-19 pandemic.
Despite signs of progress, there was temporary faltering of indicators- namely, order fill and stockout rates; associated with key commodities for effective management of HIV in the year 2020, warranting an explanation. The drop in Tenofovir/Lamivudine/Efavirenz (TLE 600mg) in 2020 could be linked to several factors. In the year 2019, the Zimbabwe MOHCC adopted new treatment regimens containing Dolutegravir. This means, newly HIV positive clients were started on Dolutegravir regimen as standard of care rather than the previous first line treatment which then surged Tenofovir/Lamivudine/Dolutegravir 50mg order fill rate, while having the opposite effect on the old regimen. Lastly, the effects of COVID-19 pandemic cannot be underestimated as the global supply chain systems were logged with delays which caused disruptions and inefficiencies in health systems in many countries [ 28 ]. In the same period, Determine HIV Test Kit rebounded from stocking out in central stores because of strengthened warehouse optimization activities, including better inventory management, purposeful stock taking, and approval processes contributed to the lowering of stockout rates.
The Global Fund-supported initiatives were also instrumental in building capacity by training key personnel for the effective implementation of activities related to the procurement and supply chain management function [ 8 , 29 , 30 ]. Better quantification and forecasting capabilities (due to data availability through e-LMIS and personnel training), improved warehousing capacity to hold a wide portfolio of products, and direct delivery to facilities through a modern fleet could have contributed to the high population coverage reported [ 26 , 30 , 31 ]. According to the WHO health system framework, effective leadership is required to coordinate all the functions of the health system in order to achieve the desired outcomes [ 5 ]. Therefore, it is sensible to conclude that, the reported health system improvements could not have happened without effective leadership and well-trained staff tasked with coordination and management across the PSCM value chain. It can be further inferred that the training and capacity development measures offered to the NATPHARM personnel were consequential in supporting the broader health system to meet its overall objectives, including improving PSCM performance [ 2 , 7 , 29 ].
Similarly, adequate infrastructure, equipment, data, and information management systems are crucial ingredients for a well-functioning health system, according to the WHO health system framework [ 4 , 5 , 9 ]. The Global Fund-supported initiatives were central in supporting these aspects of the health system through improved warehousing capacity, of modern equipment, installation of solar panels, fleet improvement and deployment of an electronic-logistic management information system (e-LMIS). The cumulative benefits of these investments include optimised procurement and distribution of commodities leading to a reduction in stockout rates and timely order refills to meet the population health needs [ 9 ].
Based on these findings, it would be reasonable to conclude that the Global Fund-supported initiatives in Zimbabwe contributed positively to strengthening the health system, particularly through the improved performance of the various indicators linked to the PSCM system at national and regional warehouses, as well as health facilities. Considering the prevailing health needs in the country, the implementation of this project and the manner of investments provide a basis and playbook for further support to make progress. This is particularly true considering the various competing priorities in the Zimbabwean healthcare system amidst resource constraints [ 3 , 6 , 8 ]. This was largely underpinned on the overarching focus on UHC and the critical role that an effective PSCM plays towards that very objective [ 3 , 12 , 13 , 14 ].
The Global Fund-supported project in Zimbabwe worked through the existing national coordination mechanisms where various key stakeholders, including MOHCC and NATPHARM, were involved in all key strategic planning and implementation decisions, ensuring country leadership and ownership. It was clear from the outset that this approach required sound partnership, transparency, and accountability among all the involved stakeholders, to deliberate and find common ground, guided by the overarching objective to make progress towards UHC.
The question of securing the gains and ensuring sustainability is fundamental for donor supported health programs in low- and middle- income countries. To make progress, it is imperative for health system stakeholders, including governments and donor organizations that are keen to sustainably strengthen health systems to pay close attention to critical areas like the procurement and distribution of health commodities. It is critical to collaborate with key stakeholders through joint planning and implementation to optimize the available resources. Organizational autonomy coupled with strong data driven accountability systems and the sharing of best management practices are fundamentally important in this discourse.
Availability of data and materials
The datasets used and/or analysed during the current study are available from the corresponding author on reasonable request and once written permission is obtained from NATPHARM.
Abbreviations
Country Coordination Mechanism
Health Development Partners Coordination Forum
Health Sector Technical Working Group
Key Informant Interview
Medicines Control Authority of Zimbabwe
Ministry of Health and Child Care
National Pharmaceutical Company of Zimbabwe
Polymerase Chain Reaction
Procurement and Supply Chain Management
Rapid Diagnostic Tests
Tenofovir Lamivudine Efavirenz
Universal Health Coverage
United Nations Development Program
World Health Organization
UNDP. Healthy systems for healthy people: UNDP and Global Fund support to strengthen financial and risk management for the delivery of health services in Zimbabwe. New York: United Nations Development Programme; 2020.
UNDP. Healthy systems for healthy people: UNDP and Global Fund support to strengthen the national health management information system. New York: United Nations Development Programme; 2020.
MOHCC. Investment case for the national health strategy 2021-2025. Harare: Accelerating investments towards Universal Health Coverage; 2020.
Google Scholar
MOHCC. National health strategy 2021–2025. Harare: Ministry of Health and Child Care; 2020.
WHO. Everybody business: strengthening health systems to improve health outcomes: WHO’s framework. Geneva: WHO; 2007.
Group EH. Comprehensive assessment of the supply chain for health commodities in the public sector in Zimbabwe. Harare: United Nations Development Programme; 2013.
MOHCC. Analysis and findings from the Zimbabwe supply chain human resource assessment. Harare: Ministry of Health and Child Care; 2012.
UNDP. Healthy systems for healthy people: the impact of UNDP-managed Global Fund investments in procurement and supply chain systems in Zimbabwe. Harare: United Nations Development Programme ; 2020.
Global Fund. Audit report: Global Fund Grants in Zimbabwe. Geneva: The Global Fund; 2020
MOHCC. Zimbabwe electronic logistics management information system baseline assessment report December 2018 to January 2019. Harare: Ministry of Health and Child Care ; 2019.
MOHCC. Zimbabwe comprehensive laboratory assessment. Harare: Ministry of Health and Child Care; 2016.
Privett N, Gonsalvez D. The top ten global health supply chain issues: perspectives from the field. ORHC. 2014;3(4):226–30. https://doi.org/10.1016/j.orhc.2014.09.002 .
Article Google Scholar
Yadav P. Health product supply chains in developing countries: diagnosis of the root causes of underperformance and an agenda for reform. Health Syst Reform. 2015;1(2):142–54. https://doi.org/10.4161/23288604.2014.968005 .
Article PubMed Google Scholar
Seidman G, Atun R. Do changes to supply chains and procurement processes yield cost savings and improve availability of pharmaceuticals, vaccines or health products? A systematic review of evidence from low-income and middle-income countries. BMJ Global Health. 2017;2:e000243.
Article PubMed PubMed Central Google Scholar
Windisch R, Waiswa P, Neuhann F, Scheibe F, Savigny DD. Scaling up antiretroviral therapy in Uganda: using supply chain management to appraise health systems strengthening. Global Health. 2011;7:25. https://doi.org/10.1186/1744-8603-7-25 .
Cyn-Young P, Kijin K, Susann R, Steven B, Woo KJ, Tayag MC, et al. This brief examines the global shortage of the personal protective equipment (PPE) needed to tackle COVID-19 and suggests policy implications. Manila: Asian Development Bank; 2020.
Dai T, Zaman MH, Padula WV, Davidson PM. Supply chain failures amid Covid-19 signal a new pillar for global health preparedness. J Clin Nurs. 2021;30(1–2):e1–3. https://doi.org/10.1111/jocn.15400 .
Ghaffar A, Rashidian A, Khan W, Tariq M. Verbalising importance of supply chain management in access to health services. J Pharm Policy Pract. 2021;14(Suppl 1):91. https://doi.org/10.1186/s40545-021-00352-5 . ( 1–3 ).
Jahre M, Dumoulin L, Greenhalgh LB, Hudspeth C, Limlim P, Spindler A. Improving health in developing countries: reducing complexity of drug supply chains. JHLSCM. 2012;2(1):54–84. https://doi.org/10.1108/20426741211226000 .
Vledder M, Friedman J, Sjoblom M, Brown T, Yadav P. Improving supply chain for essential drugs in low-income countries: results from a large scale randomized experiment in Zambia. Health Syst Reform. 2019;5(2):158–77. https://doi.org/10.1080/23288604.2019.1596050 .
Agrawal P, Barton I, Bianco RD, Hovig D, Sarley D, Yadav P. Moving medicine, moving minds: helping developing countries overcome barriers to outsourcing health commodity distribution to boost supply chain performance and strengthen health systems. Glob Health Sci Pract. 2016;4(3):359–65. https://doi.org/10.9745/GHSP-D-16-00130 .
Arora M, Gigras Y. Importance of supply chain management in healthcare of third world countries. IJSOM. 2018;5(1):101–6. https://doi.org/10.22034/2018.1.7 .
Creswell J, Creswell JD. Research design: qualitative, quantitative, and mixed methods approaches. London: Sage; 2018.
Achoki T, Lesego A. The imperative for systems thinking to promote access to medicines, efficient delivery, and cost-effectiveness when implementing health financing reforms: a qualitative study. Int J Equity Health. 2017;16:53. https://doi.org/10.1186/s12939-017-0550-x . (1-13).
Colson KE, Dwyer-Lindgren L, Achoki T, Fullman N, Schneider M, Mulenga P, et al. Benchmarking health system performance across districts in Zambia: a systematic analysis of levels and trends in key maternal and child health interventions from 1990 to 2010. BMC Med. 2015;13:69. https://doi.org/10.1186/s12916-015-0308-5 . 1-14.
Githendu P, Morrison L, Silaa R, Pothapregada S, Asiimwe S, Idris R, et al. Transformation of the Tanzania medical stores department through global fund support: an impact assessment study. BMJ Open. 2020;10(e040276):1–12. https://doi.org/10.1136/bmjopen-2020-040276 .
MOHCC. Infection Control and Waste Management Plan (ICWMP). Harare: Ministry of Health and Child Care; 2022.
Moosavi J, Fathollahi-Fard AM, Dulebenets MA. Supply chain disruption during the COVID-19 pandemic: recognizing potential disruption management strategies. Int J Disaster Risk Reduct. 2022;75:102983. https://doi.org/10.1016/j.ijdrr.2022.102983 .
Albano GL, Ballarin A, Sparro M. Framework agreements and repeated purchases: the basic economics and a case study on the acquisition of it services. In: International Public Procurement Conference. Milan: The International Public Procurement Conference; 2010.
OECD. Manual for framework agreements. Paris: Organization for Economic Co-operation and Development; 2014.
Arney L, Yadav P, Miller R, Wilkerson T. Strategic contracting practices to improve procurement of health commodities. Glob Health Sci Pract. 2014;2(3):295–306. https://doi.org/10.9745/GHSP-D-14-00068 .
Download references
Acknowledgements
The authors would like to thank the participants from the different organizations in Zimbabwe that provided feedback during the study. They are also grateful to the management of the various organizations that allowed their staff to participate and provided premises and other resources that were used during the interviews. Gratitude to Sarah Gurrib who proofread the manuscript and offered useful comments.
The study was funded by the Global Fund to Fight AIDs, Tuberculosis and Malaria. The funder had no role in the study design, data collection, data analysis, data interpretation, or writing of the article. All authors had full access to study data and had final responsibility for the decision to submit for publication.
Author information
Authors and affiliations.
Africa Institute for Health Policy, P.O. Box 57266-00200, Nairobi, Kenya
Abaleng Lesego, Lawrence P. O. Were, Tsion Tsegaye & Tom Achoki
Department of Health Sciences & Department of Global Health, Boston University, Boston, U.S.A.
Lawrence P. O. Were
Global Fund to Fight AIDs, Tuberculosis and Malaria, Geneva, Switzerland
Rafiu Idris, Linden Morrison, Tatjana Peterson & Sheza Elhussein
PricewaterhouseCoopers, Harare, Zimbabwe
Esther Antonio & Godfrey Magwindiri
National Pharmaceutical Company of Zimbabwe, Harare, Zimbabwe
Ivan Dumba, Cleyland Mtambirwa, Newman Madzikwa & Raiva Simbi
Medicines Control Authority of Zimbabwe, Harare, Zimbabwe
Misheck Ndlovu
You can also search for this author in PubMed Google Scholar
Contributions
Tom Achoki (TA), Rafiu Idris (RI), Lawrence Were (LW) and Abaleng Lesego (AL) conceptualized and designed the study. AL, TA, and Godfrey Magwindiri (GM) collected and analyzed data. TA and AL drafted the manuscript. Tsion Tsegaye (TT), Linden Morrison (LM), Tatjana Peterson (TP), Sheza Elhussein (SE), Esther Antonio(EA), Ivan Dumba (ID), Cleyland Mtambirwa (CM), Newman Madzikwa(NM), Raiva Simbi (RS), Misheck Ndlovu (MN) and LW did the critical revisions of the manuscript. All authors read and approved the final manuscript.
Corresponding author
Correspondence to Tom Achoki .
Ethics declarations
Ethics approval and consent to participate.
Ethical approval including the consent procedure for participants was obtained from the Ethics Committee of the MOHCC Department of Research and NATPHARM, Harare Zimbabwe. The conduct and methods of this study adhered to the tenets outlined in the Declaration of Helsinki. Informed consent was obtained from each study participant involved in the study. The data collection protocol ensured that all study participants fully understood the objectives of the study and consented in writing to provide the required information. Before the interview commenced, the participants also consented verbally and confirmed that they had understood the objectives of the study and that they could opt out of the interview at any time without prejudice. No sensitive or personally identifying information was collected regarding the study participants.
Consent for publication
Not applicable.
Competing Interests
RI, LM, TP and SE declare that they are fulltime employees at the Global Fund to Fight AIDs, Tuberculosis and Malaria. EA and GM declare that they are fulltime employees at PricewaterhouseCoopers. ID, CM, NM and RS are fulltime employees at National Pharmaceutical Company of Zimbabwe. The rest of the authors declare that they have no competing interests.
Additional information
Publisher's note.
Springer Nature remains neutral with regard to jurisdictional claims in published maps and institutional affiliations.
Rights and permissions
Open Access This article is licensed under a Creative Commons Attribution 4.0 International License, which permits use, sharing, adaptation, distribution and reproduction in any medium or format, as long as you give appropriate credit to the original author(s) and the source, provide a link to the Creative Commons licence, and indicate if changes were made. The images or other third party material in this article are included in the article's Creative Commons licence, unless indicated otherwise in a credit line to the material. If material is not included in the article's Creative Commons licence and your intended use is not permitted by statutory regulation or exceeds the permitted use, you will need to obtain permission directly from the copyright holder. To view a copy of this licence, visit http://creativecommons.org/licenses/by/4.0/ . The Creative Commons Public Domain Dedication waiver ( http://creativecommons.org/publicdomain/zero/1.0/ ) applies to the data made available in this article, unless otherwise stated in a credit line to the data.
Reprints and permissions
About this article
Cite this article.
Lesego, A., Were, L.P.O., Tsegaye, T. et al. Health system lessons from the global fund-supported procurement and supply chain investments in Zimbabwe: a mixed methods study. BMC Health Serv Res 24 , 557 (2024). https://doi.org/10.1186/s12913-024-11028-6
Download citation
Received : 06 March 2023
Accepted : 22 April 2024
Published : 01 May 2024
DOI : https://doi.org/10.1186/s12913-024-11028-6
Share this article
Anyone you share the following link with will be able to read this content:
Sorry, a shareable link is not currently available for this article.
Provided by the Springer Nature SharedIt content-sharing initiative
- Health systems
- Procurement and supply chain management
- Global fund
- Donor funded programs
- Development assistance for health
- Health systems strengthening
BMC Health Services Research
ISSN: 1472-6963
- General enquiries: [email protected]
The International Journal of Indian Psychȯlogy
Exploring the Relationship between Social Media Addiction and loneliness among Young Adults: A Quantitative Analysis

| Published: May 10, 2024

The widespread incorporation of social media platforms into the daily routines of young adults calls for a thorough comprehension of its influence on psychological well-being, specifically in relation to concepts such as loneliness. The present study employs a quantitative approach to investigate the complex association between addiction to social media and feelings of loneliness among young individuals. This investigation involves a thorough analysis that incorporates correlation and t-test approaches. Through an in-depth exploration of this association, the research endeavours to clarify the psychological ramifications associated with excessive utilization of social media platforms and its prospective impact on individuals’ experiences of loneliness. Participants between the ages of 18 and 25 were chosen via purposive sampling, taking into account particular criteria relating to their involvement with social media sites. The data collection devices employed in this study encompassed surveys, which provided valuable insights into the extent of participants’ social media addiction and their encounters with feelings of loneliness. The research included a sample size of 172 individuals, encompassing both males and females, and using known psychometric tools to assess the variables under investigation. Loneliness experiences were assessed using the De Jong Gierveld Scale, while the level of social media addiction was evaluated using the Internet Addiction Test by Dr. Kimberly Young. Furthermore, it is worth noting that there were significant gender disparities in the levels of loneliness, underscoring the necessity for additional investigation into individual variations in comprehending the correlation between addiction to social media and feelings of loneliness. This study adds to the growing corpus of scholarly work on the utilization of social media and its psychological consequences, offering valuable perspectives that can guide specific interventions designed to encourage healthy online behaviors among young adults.
Internet addiction , loneliness , students , quantitative research , young adults

This is an Open Access Research distributed under the terms of the Creative Commons Attribution License (www.creativecommons.org/licenses/by/2.0), which permits unrestricted use, distribution, and reproduction in any Medium, provided the original work is properly cited.
© 2024, Mushtaq, M. & Soni, S.
Received: March 14, 2024; Revision Received: May 06, 2024; Accepted: May 10, 2024
Munisa Mushtaq @ [email protected]

Article Overview
Published in Volume 12, Issue 2, April-June, 2024
COMMENTS
The two "branches" of quantitative analysis. As I mentioned, quantitative analysis is powered by statistical analysis methods.There are two main "branches" of statistical methods that are used - descriptive statistics and inferential statistics.In your research, you might only use descriptive statistics, or you might use a mix of both, depending on what you're trying to figure out.
Quantitative data has to be gathered and cleaned before proceeding to the stage of analyzing it. Below are the steps to prepare a data before quantitative research analysis: Step 1: Data Collection. Before beginning the analysis process, you need data. Data can be collected through rigorous quantitative research, which includes methods such as ...
Revised on June 22, 2023. Quantitative research is the process of collecting and analyzing numerical data. It can be used to find patterns and averages, make predictions, test causal relationships, and generalize results to wider populations. Quantitative research is the opposite of qualitative research, which involves collecting and analyzing ...
Here is a basic guide for gathering quantitative data: Define the research question: The first step in gathering quantitative data is to clearly define the research question. This will help determine the type of data to be collected, the sample size, and the methods of data analysis.
Abstract. Quantitative data analysis serves as part of an essential process of evidence-making in health and social sciences. It is adopted for any types of research question and design whether it is descriptive, explanatory, or causal. However, compared with qualitative counterpart, quantitative data analysis has less flexibility.
Quantitative Research: Focus: Quantitative research focuses on numerical data, seeking to quantify variables and examine relationships between them. It aims to provide statistical evidence and generalize findings to a larger population. Measurement: Quantitative research involves standardized measurement instruments, such as surveys or questionnaires, to collect data.
It is important to know w hat kind of data you are planning to collect or analyse as this w ill. affect your analysis method. A 12 step approach to quantitative data analysis. Step 1: Start with ...
8. Weight customer feedback. So far, the quantitative data analysis methods on this list have leveraged numeric data only. However, there are ways to turn qualitative data into quantifiable feedback and to mix and match data sources. For example, you might need to analyze user feedback from multiple surveys.
Quantitative method is the collection and analysis of numerical data to answer scientific research questions. Quantitative method is used to summarize, average, find patterns, make predictions, and test causal associations as well as generalizing results to wider populations.
Revised on 10 October 2022. Quantitative research is the process of collecting and analysing numerical data. It can be used to find patterns and averages, make predictions, test causal relationships, and generalise results to wider populations. Quantitative research is the opposite of qualitative research, which involves collecting and ...
Methods used for data analysis in qualitative research. There are several techniques to analyze the data in qualitative research, but here are some commonly used methods, Content Analysis: It is widely accepted and the most frequently employed technique for data analysis in research methodology. It can be used to analyze the documented ...
Data Analysis Methods in Quantitative Research. We started this module with levels of measurement as a way to categorize our data. Data analysis is directed toward answering the original research question and achieving the study purpose (or aim). Now, we are going to delve into two main statistical analyses to describe our data and make ...
Quantitative research methods are concerned with the planning, design, and implementation of strategies to collect and analyze data. Descartes, the seventeenth-century philosopher, suggested that how the results are achieved is often more important than the results themselves, as the journey taken along the research path is a journey of discovery. . High-quality quantitative research is ...
Here's how to make sense of your company's numbers in just four steps: 1. Collect data. Before you can actually start the analysis process, you need data to analyze. This involves conducting quantitative research and collecting numerical data from various sources, including: Interviews or focus groups.
Replicable: Quantitative research aims to be replicable, meaning that other researchers should be able to conduct similar studies and obtain similar results using the same methods. Statistical analysis: Quantitative research involves using statistical tools and techniques to analyze the numerical data collected during the research process ...
Quantitative data analysis may include the calculation of frequencies of variables and differences between variables. A quantitative approach is usually associated with finding evidence to either support or reject hypotheses you have formulated at the earlier stages of your research process. The same figure within data set can be interpreted in ...
Quantitative methods emphasize objective measurements and the statistical, mathematical, or numerical analysis of data collected through polls, questionnaires, and surveys, or by manipulating pre-existing statistical data using computational techniques.Quantitative research focuses on gathering numerical data and generalizing it across groups of people or to explain a particular phenomenon.
A research question is what a study aims to answer after data analysis and interpretation. The answer is written in length in the discussion section of the paper. ... In quantitative research, ... this suggests an integrative process between both research methods wherein a single mixed-methods research question can be developed.1 ...
You can use quantitative analysis to interpret data that was collected either: During an experiment. Using probability sampling methods. Because the data is collected and analyzed in a statistically valid way, the results of quantitative analysis can be easily standardized and shared among researchers. Examples of data analysis methods
The main difference between quantitative and qualitative research is the type of data they collect and analyze. Quantitative research collects numerical data and analyzes it using statistical methods. The aim is to produce objective, empirical data that can be measured and expressed in numerical terms.
Step 2: Choose your data collection method. Based on the data you want to collect, decide which method is best suited for your research. Experimental research is primarily a quantitative method. Interviews, focus groups, and ethnographies are qualitative methods. Surveys, observations, archival research and secondary data collection can be ...
Data Analysis in Quantitative Research. Data analysis is the second important aspect of quantitative research. After collecting the data, the data is analyzed with statistical methods. When analyzing, it is important that the results are relevant and related to the objective and aim of the research.
Investigate the various data analysis methods and select the technique that best aligns with your objectives. Many free data analysis software solutions offer built-in algorithms and methods to facilitate this selection process. ... There are two main ways of processing data: quantitative analysis and qualitative analysis. ... research, and ...
Offers a guide through the essential steps required in quantitative data analysis; Helps in choosing the right method before starting the data collection process; Presents statistics without the math! Offers numerous examples from various diciplines in accounting and information systems; No need to invest in expensive and complex software packages
Quantitative data analysis for business intelligence (BI) examines business issues through statistical, mathematical, or computational techniques. Business analysts collect and examine numerical data to identify trends, patterns, and relationships that inform strategic business decisions. 1 Quantitative methods in BI drive decision-making by giving business leaders a solid foundation for ...
The methods of analysis you're comfortable with should influence your choice. Quantitative analysis uses mathematical and statistical techniques to interpret data, which can be daunting if you ...
When collecting and analyzing data, quantitative research deals with numbers and statistics, while qualitative research deals with words and meanings. Both are important for gaining different kinds of knowledge. Quantitative research. Quantitative research is expressed in numbers and graphs. It is used to test or confirm theories and assumptions.
The data analyst role supports activities related to formative research, program evaluation and program assessments, and plays a key role in conducting qualitative and quantitative data collection and analysis and translating findings into plain language for dissemination through a range of communication vehicles.
This study employed a mixed methods design combining quantitative and qualitative research methods. The quantitative part entailed a descriptive analysis of procurement and supply chain data from the Zimbabwe healthcare system covering 2018 - 2021. The qualitative part comprised key informant interviews using a structured interview guide.
The International Journal of Indian Psychȯlogy(ISSN 2348-5396) is an interdisciplinary, peer-reviewed, academic journal that examines the intersection of Psychology, Social sciences, Education, and Home science with IJIP. IJIP is an international electronic journal published in quarterly. All peer-reviewed articles must meet rigorous standards and can represent a broad range of substantive ...