A Fishbone Diagram
A fishbone diagram, also known as a “cause and effect” diagram is a problem solving technique used in project management. It has also been referred to as an Ishikawa diagram after a Japanese professor; Kaoru Ishikawa. Problems arising in projects usually have many causes and in some cases, these problems may be interrelated and complex. A fishbone diagram is thus a useful tool that diagrammatically enumerates these problems aiding in their solution.
Due to its diagrammatic nature, it is possible to view at a single glance the elements surrounding the project and thus identify all the problem areas and hence work on their solution in and easier manner. This is a major advantage of this technique. Additionally, it facilitates an in-depth analysis of problems by splitting them into causes and sub-causes. This again ensures a more efficient and effective approach to problem solution.
Order custom essay A Fishbone Diagram with free plagiarism report
It is also extremely easy to use and this poses as an important advantage over other management tools. To make a fishbone diagram, one draws a horizontal line pointing to the problem whose solution is desired. Secondly the causes of this are identified and indicated by backward sloping lines along the first line, called ‘bones’. Sub-causes of the problem are usually then identified and put as sub-branches. Lastly, a fishbone diagram has been said to facilitate brainstorming.
To come up with the ‘bones’ discussed above, the project management committee needs to think and rethink the causes leading up to the effect. An example of the use of a fishbone diagram can be a project to increase sales by a particular firm. The “causes” here thus ‘bones’ would then be constituted by such items such as pricing, advertisement, market, branding, product features, etc. All in all, it is agreed that this is an effective tool which every project manager should equipped with.

Cite this Page
A Fishbone Diagram. (2016, Jul 16). Retrieved from https://phdessay.com/a-fishbone-diagram/
Run a free check or have your essay done for you

More related essays
Mojave Desert Organisms Planate (Vegetation) – Brittle Bush, California Juniper, Creosote Bush, Common Saltbush, Joshua Tree, Mojave Aster, and Triangle-leaf Bursage Animalia (Animals) – Mammals include coyote, desert bighorn sheep,.
A class diagram models the static structure of a system. It shows relationships between classes, objects, attributes, and operations.Basic Class Diagram Symbols and NotationsClassesClasses represent an abstraction of entities with.
This integrated REA diagram combines 4 individual cycles together, Revenue cycle indicated in blue shape, Expenditure cycle indicated in green shape, Production cycle indicated in red shape and Human Resource.
mywbut. com Data Flow Diagrams (DFDs) 1 mywbut. com Specific Instructional Objectives At the end of this lesson the student will be able to: • • • Identify the activities.
The purpose of this chapter is to happen an aircraft with a constellation that best suits the type of operation of our client. The Piston engine has different flight features.
The room access to the presents wireless communicating systems was opened by Guglielmo Marconi when he transmitted the three-dot Morse codification for alphabet ' S ' by the usage of.
Diagram • 2 yr. term • must be a 7 yr U.S. citizen • must live in district/state representing. • must be 25 yrs. Old • contains 435 members • led by Speaker of House • elected.
PROBLEMA 1 The Maser is a new custom-designed sports car. An analysis of the task of building the Maser reveals the following list of relevant activities, their immediate predecessors, and.
We use cookies to give you the best experience possible. By continuing we’ll assume you’re on board with our cookie policy
Save time and let our verified experts help you.
What is a Fishbone Diagram? Definition, Categories, Types, Examples and Best Practices
By Paul VanZandt
Published on: July 24, 2023

Table of Contents
What is a Fishbone Diagram?
Importance and purpose of fishbone diagrams, fishbone diagrams categories, types of fishbone diagrams, how fishbone diagrams examples to drive solutions, how to create a fishbone diagram: 4 key steps, top 5 best practices for a fishbone diagram in 2023.
A Fishbone diagram, also known as an Ishikawa diagram, is defined as a powerful causal analysis tool designed to uncover the root causes of complex problems. Widely utilized in manufacturing, industrial services, product development, and general troubleshooting, this visual methodology provides a structured approach to identify and address issues with clarity. By visually mapping potential causes, teams can efficiently pinpoint the underlying factors affecting processes and systems. Explore how integrating Fishbone diagrams into your problem-solving toolkit can lead to precise and effective solutions in various industries.
Any fishbone diagram has 3 key components:
- The problem at the head of the fish
- The attributes that form the key function as the bones stemming out from the spine
- The problem areas within the attributes that are the potential causes of the problem on the head.
An example of the application of a fishbone diagram will be the typical 4S fishbone used in manufacturing. The 4S’s represent – systems, surroundings, skills, and suppliers. Each ‘s’ factor is accompanied by adjoint ‘bones’ which represent the issues in these attributes of the manufacturing process.
Below is an example of a 4S fishbone diagram:

Fishbone diagrams are often seen as a problem-solving tool, but they can also function as an excellent visual aid when issues need to be explained and coordinated with larger teams.
Here are some of the factors that make fishbone diagrams an important business tool:
- Visual problem solving: A fishbone diagram’s key utility comes from the fact that it is visual versus being a list or a spreadsheet. This allows one to expand the diagram to as many attributes and root causes as needed without being overwhelmed by the sheer number of underlying issues. Furthermore, the layout of the diagram allows one to incorporate both internal and external factors during analysis.
- Real problem-solving over treating symptoms: Often brainstorming sessions or company meetings may be spent trying to deal with symptoms of a problem, such as lower sales numbers or employee attrition, without trying to get to the root of the problems. A fishbone diagram starts with the goal of trying to identify the root causes, with the symptoms also getting their place in the diagram. This allows for holistic analysis and problem-solving, where symptoms are not ignored while being cognizant that the root cause needs to be identified to solve the larger problem.
- Easily presentable visual aid: One of the key issues with trying to solve a problem where the root cause or causes have been identified – is explaining this complex structure to company leaders and getting their cooperation. A fishbone diagram layout is a great alternative visual tool to show how multiple contributing factors are together causing the main problem, and how each of these root causes will need to be addressed in order to treat the main issue.
Learn more: 5 Unique Fishbone Diagram Applications
Fishbone diagrams use categories or branches to help organize and classify potential causes contributing to a problem. These categories can vary depending on the specific problem you’re addressing, but there are some common categories often used as a starting point. These categories include:
- People: This category encompasses factors related to human resources, such as skills, training, experience, communication, and motivation. Problems related to people might involve insufficient training, lack of teamwork, or individual skill deficiencies.
- Process: Process-related factors pertain to the steps, procedures, and workflows involved in a particular process. This category examines aspects like the sequence of activities, work instructions, workflow inefficiencies, and process variations.
- Equipment: Equipment includes any physical tools, machinery, or technology used in a process. Problems in this category can involve equipment malfunctions, outdated technology, or improper maintenance.
- Materials: Material-related causes address issues with the input materials, components, or supplies used in a process. Problems might arise from substandard materials, inconsistent quality, or inadequate inventory control.
- Environment: The environment category relates to the physical or external conditions where the process occurs. This can encompass factors like temperature, humidity, lighting, and workspace design. For instance, an uncomfortable or poorly lit workspace could impact productivity.
- Measurement: Measurement factors refer to the metrics, data, and key performance indicators (KPIs) used to assess the process or outcome. Problems in this category might include inaccurate data, improper data collection methods, or inadequate metrics for evaluating success.
- Methods: The methods category deals with the specific techniques, procedures, or strategies used in carrying out a process. Problems related to methods could involve outdated techniques, lack of standard operating procedures, or ineffective strategies.
- Management: Management-related causes relate to the leadership and organizational oversight of the process. Issues might arise from poor decision-making, lack of support, or inadequate resource allocation.
- Policies: Policies refer to the rules, regulations, and guidelines governing the process or the organization. Problems related to policies could involve conflicting rules, outdated policies, or overly restrictive guidelines.
- Safety: Safety issues include factors related to the physical safety of personnel, environmental safety, and the safety of products or services. Problems in this category might involve insufficient safety measures, inadequate training, or safety violations.
- Suppliers: Suppliers are external entities or organizations that provide materials, components, or services necessary for the process. Issues may stem from unreliable suppliers, late deliveries, or inconsistent quality of supplied materials.
- Technology: Technology encompasses the software, hardware, and digital tools used in a process. Problems might arise from incompatible software, software bugs, or outdated hardware, which can be addressed through appropriate hardware development services .
These categories serve as a starting point for brainstorming and organizing potential causes, but they can be customized and expanded to suit the specific problem you’re addressing. The goal is to identify all possible causes that could contribute to the problem, making the fishbone diagram a valuable tool for root cause analysis and problem-solving.
While the underlying method for any fishbone remains consistent, there are certain types that are widely used and serve as a standard template. Here are the 4 key types of fishbone diagrams commonly used today:
- Simple Fishbone Diagram
A simple fishbone is made up of only 2 attributes with causes attached to the main head representing the main problem to be solved. This diagram is used to solve problems where the causes can be grouped into two attributes. For example, while trying to analyze website traffic, one may choose to divide them into just 2 channels – organic and non-organic sources.
- 4S Fishbone Diagram
The 4S fishbone diagram (example above) is a standard manufacturing and industrial problem-solving tool, however, it can also be used for any product development process, including software development. The 4S of the fishbone represent suppliers (or simply input sources), skills, surroundings (any surrounding factor, including real estate or office space), and systems (including computer systems). The advantage of this diagram is that it limits the attributes to 4 factors while trying to broadly capture all key attributes, which helps focus on the underlying problems without expanding into too many attributes or departments.
- 8P Fishbone Diagram
The 8P fishbone is a typical enterprise fishbone that liberally allows expansion into 8 attributes, namely – price, product, people (employees and shareholders), place (or plant, in case of a physical factory or outlets), promotions (marketing), procedures, policies, and processes.
- 6M Fishbone Diagram
The 6M fishbone is a standard primarily set for manufacturing and rarely used outside of its intended scope. The 6 attributes are the man (human resources), machine (including computer systems and enterprise software stack), measurements (company metrics), materials, method, and mother nature (manufacturing and business environment).
Below is a 6M fishbone diagram example:

Here are three insightful examples showcasing their practical applications across diverse industries.
Example 1. Manufacturing Excellence
In the manufacturing sector, Fishbone diagrams are instrumental in addressing production bottlenecks. For instance, consider a scenario where a manufacturing line is experiencing unexpected downtime. By utilizing a Fishbone diagram, teams can systematically explore factors such as equipment malfunctions, process inefficiencies, or human error, leading to targeted solutions and improved operational efficiency.
Example 2. Healthcare Diagnostics
In healthcare, Fishbone diagrams prove invaluable for diagnosing and addressing challenges. Let’s take patient wait times in a hospital as an example. By categorizing potential causes such as staffing issues, scheduling inefficiencies, or communication gaps, healthcare professionals can streamline processes and enhance the overall patient experience.
Example 3. Software Development Hurdles
Even in the realm of software development, Fishbone diagrams find their place. Imagine a project facing delays; a Fishbone diagram can uncover the underlying causes, be it coding errors, communication breakdowns, or resource constraints. This methodical approach allows development teams to rectify issues promptly and ensure project timelines are met.
Integrating Fishbone Diagrams into Your Toolkit
Now that you’ve glimpsed the versatility of Fishbone diagrams through these examples, consider incorporating them into your problem-solving toolkit . Whether you operate in manufacturing, healthcare, software development, or any other industry, the Fishbone diagram offers a structured and visual approach to identifying and addressing challenges head-on.
Explore the possibilities, and empower your teams with this effective problem-solving methodology. The next time a complex issue arises, let the Fishbone diagram be your guide to uncovering root causes and driving impactful solutions.
Learn more: What is a Venn Diagram?
A fishbone diagram can go from being a simple 2 attribute diagram to complex like an 8P diagram or even more.
Here are the key steps to ensuring a successful fishbone diagram for identifying and solving root causes and problems:
- Identify the main problem to solve. This is the key issue around which the attributes will be laid out for the root cause analysis to take place.
- Create a straight line and on the head mention the main problem to be solved. For example, this could be reduced sales, lower factory output, more efficient budget, or poor product quality.
- The next step is to lay out contributing areas or departments, laid out in the form of spokes (or supporting bones) stemming out from the main problem (vertebral column). While laying out the main problem, you can be specific or broad, based on the number of attributes you can reasonably manage. Note that these are the areas that contain processes, people, or resources that may have contributed to the main enterprise problem at the head of the fish.
- Draw out the root issues within the attributes. Be as direct as possible since there are no deeper branches to expand for more details. The branching in a fishbone begins with the central line and ends with the root causes with the attributes in the middle.

- Get broad agreement on the core problem
One of the most critical preliminary preparations to do before you even draw the first line of the finebone diagram – is to ensure that you have a broad consensus on the core problem to be solved. Depending on the depth and impact, this may need to include just your manager or expand to company-wide senior management. This consensus will ensure that the right investments are being made towards solving the problem that needs immediate attention in the priority order.
- List down all possible attributes even if you condense them later
We have gone through types of fish bones, where the lowest was just 2 attributes and the highest was 8. However, it is a best practice to ensure that the potential fishbone attributes are listed out without consideration for the number of attributes in the final fishbone. This ensures that during the planning stage, all possible attributes are evaluated for potential issues. Based on understanding, the creator can now condense and group attributes where reasonably possible based on projected causes.
At times, there may be too many causes listed under one attribute as the fishbone begins to be drawn. This situation may be better served by splitting them into more attributes.
- Consult with department leaders and managers for cause-analysis
When it comes to the individual attributes, each needs specialist consultation to fully understand the scope and issues that may be arising. This means discussing the main problem and underlying issues with the company/ team leaders who are responsible for those departments or teams. Often they may come up with the issues alongside recommendations for solving them.
- Involve all stakeholders
It is likely that the problem and/or the solutions will affect other teams. Therefore, while analyzing for the root causes, it is important to include all stakeholders to the extent it is feasible. Depending on the company culture, solutions may get approved by the management and then communicated to other teams, or the management may insist on including other affected teams during the problem-analysis stage.
- Expand to multiple fishbones when needed
There may be cases when either the attributes or the underlying causes become too expansive to cover under one fishbone diagram. At this point, it may be a better idea to use multiple fishbones rather than the same diagram.
Learn more: What is UML Diagram?
IdeaScale Whiteboard
Turn abstract ideas into visual and actionable plans
Enhance Your Ideas Visually With Your IdeaScale Whiteboard!
IdeaScale is an innovation management solution that inspires people to take action on their ideas. Your community’s ideas can change lives, your business and the world. Connect to the ideas that matter and start co-creating the future.
Copyright © 2024 IdeaScale
Privacy Overview
- Top Courses
- Online Degrees
- Find your New Career
- Join for Free
What Is a Fishbone Diagram?
Learn how to get to the root cause of a problem by creating a fishbone diagram, a powerful project management tool.
![[Featured image] A piece of paper shows a fishbone diagram drawn with red, blue, and yellow ink.](https://d3njjcbhbojbot.cloudfront.net/api/utilities/v1/imageproxy/https://images.ctfassets.net/wp1lcwdav1p1/4IO61NqzjMXQ2cI5GwAfvu/bf8b401c4961aeca6459ad460d8ed9d9/GettyImages-124033956.jpg?w=1500&h=680&q=60&fit=fill&f=faces&fm=jpg&fl=progressive&auto=format%2Ccompress&dpr=1&w=1000 "essay discuss the fish bone diagram")
A fishbone diagram , also referred to as a cause and effect diagram or an Ishikawa diagram, is a helpful tool for identifying the root cause of a problem. It allows you to list all the potential causes that may be contributing to the effect you are currently experiencing. This visual aid takes the shape of a fishbone, hence its name, and is commonly used during brainstorming sessions.
To create a fishbone diagram, you organize the possible causes on the left side, categorized under different cause categories. These make up the "bones" of the fish. On the right side, you place the effect or problem you are investigating–the "head". This structure provides a quick and easy way to visualize the various causes associated with the effect.
How to create a fishbone diagram
Here's how to construct a fishbone diagram:
1. Provide a problem statement.
A problem statement is the effect or problem you are investigating and goes in a box with an arrow pointing to it in the right side of a flipchart page, as if forming the head of the fish. Everyone on the team agrees on the definition of the problem.
2. Define major cause categories.
Form the skeleton of your fishbone diagram with the major cause categories, which you connect to the backbone. To find these categories, have a brainstorming session with your team. The number of categories you create will vary according to your industry and the problem you’re solving. As an example, if you work in manufacturing, your major cause categories may be staff/people, equipment and machinery, processes and procedures, materials, environmental factors, and measuring procedures.
3. Brainstorm causes.
Now that you have your major cause categories in place, take time to brainstorm possible causes. You can use the categories as a way of generating ideas or just list as many causes as you can think of as a team.
4. Categorize causes.
Go through your list of causes and add them to the appropriate category on your diagram. These causes become the ribs on your diagram, joining categories to the backbone.
5. Discover sub-causes.
For each cause you identify, go deeper by asking effective questions such as, “Why does this happen?” This causes layers of branches or “bones” on the diagram.
6. Identify root causes.
The final step is to identify the root causes of the effect or problem in the problem statement. To do this, look at the causes that appear most often and across more than one category.
Related terms
Project plan
Gantt chart
Scope creep
Learn project management with Google
Learn more about tools and resources to aid you in a project management position. Whether you’re just starting out in your career or looking to upgrade your skills, you can get job ready at your own pace with the Google Project Management Professional Certificate on Coursera.
Keep reading
Coursera staff.
Editorial Team
Coursera’s editorial team is comprised of highly experienced professional editors, writers, and fact...
This content has been made available for informational purposes only. Learners are advised to conduct additional research to ensure that courses and other credentials pursued meet their personal, professional, and financial goals.
- Join Mind Tools

Cause and Effect Analysis
Identifying the likely causes of problems, (also known as cause and effect diagrams, fishbone diagrams, ishikawa diagrams, herringbone diagrams, and fishikawa diagrams.).
When you have a serious problem, it's important to explore all of the things that could cause it, before you start to think about a solution.
That way you can solve the problem completely, first time round, rather than just addressing part of it and having the problem run on and on.
Cause and Effect Analysis gives you a useful way of doing this. This diagram-based technique, which combines Brainstorming with a type of Mind Map , pushes you to consider all possible causes of a problem, rather than just the ones that are most obvious.
Click here to view a transcript of this video.
About the Tool
Cause and Effect Analysis was devised by professor Kaoru Ishikawa, a pioneer of quality management, in the 1960s. The technique was then published in his 1990 book, " Introduction to Quality Control ."
The diagrams that you create with are known as Ishikawa Diagrams or Fishbone Diagrams (because a completed diagram can look like the skeleton of a fish).
Although it was originally developed as a quality control tool, you can use the technique just as well in other ways. For instance, you can use it to:
- Discover the root cause of a problem.
- Uncover bottlenecks in your processes.
- Identify where and why a process isn't working.
How to Use the Tool
Follow these steps to solve a problem with Cause and Effect Analysis:
Step 1: Identify the Problem
First, write down the exact problem you face. Where appropriate , identify who is involved, what the problem is, and when and where it occurs.
Finding This Article Useful?
You can learn another 44 problem-solving skills, like this, by joining the Mind Tools Club.

Subscribe to Our Newsletter
Receive new career skills every week, plus get our latest offers and a free downloadable Personal Development Plan workbook.
Then, write the problem in a box on the left-hand side of a large sheet of paper, and draw a line across the paper horizontally from the box. This arrangement, looking like the head and spine of a fish, gives you space to develop ideas.
In this simple example, a manager is having problems with an uncooperative branch office.
Figure 1 – Cause and Effect Analysis Example Step 1

(Click image to view full size.)
Some people prefer to write the problem on the right-hand side of the piece of paper, and develop ideas in the space to the left. Use whichever approach you feel most comfortable with.
It's important to define your problem correctly. CATWOE can help you do this – this asks you to look at the problem from the perspective of Customers, Actors in the process, the Transformation process, the overall World view, the process Owner, and Environmental constraints.
By considering all of these, you can develop a comprehensive understanding of the problem.
Step 2: Work Out the Major Factors Involved
Next, identify the factors that may be part of the problem. These may be systems, equipment, materials, external forces, people involved with the problem, and so on.
Try to draw out as many of these as possible. As a starting point, you can use models such as the McKinsey 7S Framework (which offers you Strategy, Structure, Systems, Shared values, Skills, Style and Staff as factors that you can consider) or the 4Ps of Marketing (which offers Product, Place, Price, and Promotion as possible factors).
Brainstorm any other factors that may affect the situation.
Then draw a line off the "spine" of the diagram for each factor, and label each line.
The manager identifies the following factors, and adds these to his diagram:
Figure 2 – Cause and Effect Analysis Example Step 2

Step 3: Identify Possible Causes
Now, for each of the factors you considered in step 2, brainstorm possible causes of the problem that may be related to the factor.
Show these possible causes as shorter lines coming off the "bones" of the diagram. Where a cause is large or complex, then it may be best to break it down into sub-causes. Show these as lines coming off each cause line.
For each of the factors he identified in step 2, the manager brainstorms possible causes of the problem, and adds these to his diagram, as shown in figure 3.
Figure 3 – Cause and Effect Analysis Example Step 3

Step 4: Analyze Your Diagram
By this stage you should have a diagram showing all of the possible causes of the problem that you can think of.
Depending on the complexity and importance of the problem, you can now investigate the most likely causes further. This may involve setting up investigations, carrying out surveys, and so on. These will be designed to test which of these possible causes is actually contributing to the problem.
The manager has now finished his analysis. If he hadn't looked at the problem this way, he might have dealt with it by assuming that people in the branch office were "being difficult."
Instead he thinks that the best approach is to arrange a meeting with the Branch Manager. This would allow him to brief the manager fully on the new strategy, and talk through any problems that she may be experiencing.
A useful way to use this technique with a team is to write all of the possible causes of the problem down on sticky notes. You can then group similar ones together on the diagram.
This approach is sometimes called CEDAC (Cause and Effect Diagram with Additional Cards) and was developed by Dr. Ryuji Fukuda, a Japanese expert on continuous improvement.
Professor Kaoru Ishikawa created Cause and Effect Analysis in the 1960s. The technique uses a diagram-based approach for thinking through all of the possible causes of a problem. This helps you to carry out a thorough analysis of the situation.
There are four steps to using the tool.
- Identify the problem.
- Work out the major factors involved.
- Identify possible causes.
- Analyze your diagram.
You'll find this method is particularly useful when you're trying to solve complicated problems.
This site teaches you the skills you need for a happy and successful career; and this is just one of many tools and resources that you'll find here at Mind Tools. Subscribe to our free newsletter , or join the Mind Tools Club and really supercharge your career!
Rate this resource
The Mind Tools Club gives you exclusive tips and tools to boost your career - plus a friendly community and support from our career coaches!

Comments (36)
- Over a month ago BillT wrote Hi AnotherFrancis, and Welcome to the Club! As with my response to Alex81, not everyone will find the example the most useful, as is the case with you. We appreciate your feedback. BillT Mind Tools Team
- Over a month ago AnotherFrancis wrote Nice article but, like Alex81, I didn't find the example to be very helpful.
- Over a month ago BillT wrote Hi Alex81, and Welcome to the Club! Thank you for your feedback on the Cause and Effect Analysis. I agree that not everyone may find the example the best way to demonstrate the resource. This diagram has also been known as the Ishikawa Diagram or Fishbone Diagram. You may find additional resources with better examples for you. Also, you may wish to post this in the Forums so that our members can provide their input into the topic. BillT Mind Tools Team
Please wait...
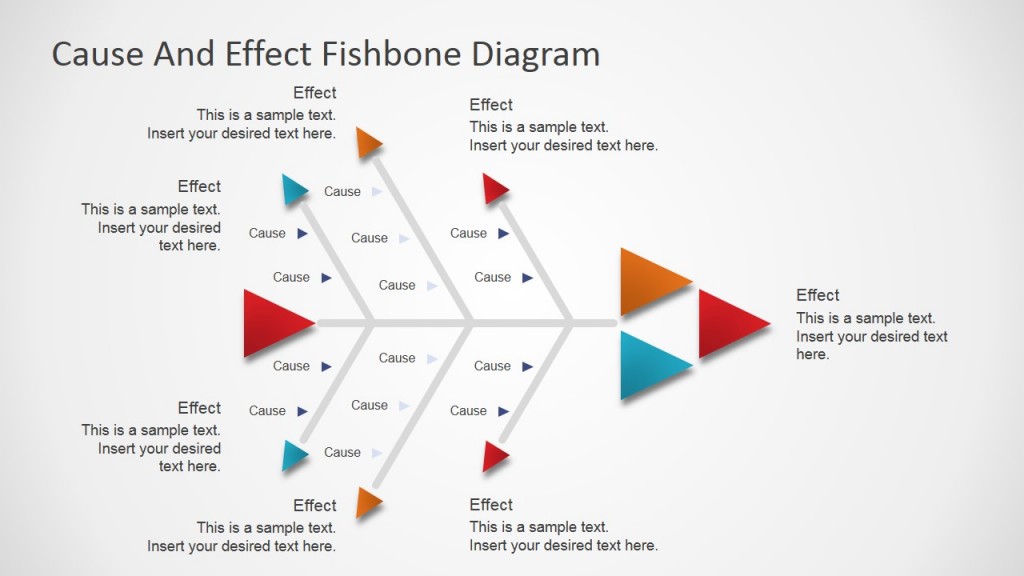
Home Blog Business Fishbone Diagram: Cause and Effect Analysis (Examples & Templates Included)
Fishbone Diagram: Cause and Effect Analysis (Examples & Templates Included)

Identifying the relationship between events and things is required when solving a problem, where possible causes are inspected to know their effect in an effort to generate the possible causes of a problem and minimize them.
For this purpose, a visualization tool called the fishbone diagram is used to list all of the possible causes and effects of the problem at hand, sorting them into categories, identifying root causes, and finding their solutions.
In this article, we will explain what is a fishbone diagram for problem-solving, when to use it, the elements of a fishbone analysis, how to make a fishbone diagram, and a fishbone diagram examples.
Lastly, we will also discuss how a fishbone diagram, specifically a cause and effect fishbone diagram, can be presented, with bonus templates that can be used to construct a fishbone diagram to determine causes and effects and come up with a solution to the problem.
Table of Contents
What is a Fishbone Diagram?
When to use a fishbone diagram, elements of the fishbone diagram, how to construct a fishbone diagram for cause and effect analysis, alternative to fishbone diagram, examples of fishbone diagram, pros of fishbone diagrams, cons of fishbone diagrams, how to present a fishbone analysis, templates for presenting a fishbone diagram.
A fishbone diagram is a visualization tool, developed by Dr. Kaoru Ishikawa, a quality control specialist, for identifying the root causes of a problem, categorizing them, and generating solutions.
Also called the Ishikawa diagram, or cause and effect diagram, the fishbone analysis is often used in troubleshooting and product development processes where teams need to focus on a problem statement.
The fishbone diagram has categories with branches that detail the causes of the problem; it looks like the skeleton of a fish, hence the name “Fishbone.” Each bone of the fish branches out into smaller bones to address the root causes of a large problem.

A fishbone diagram is used to conduct a cause-and-effect analysis. It enables teams to identify potential and real causes that are further investigated to determine the root cause. It can be used when,
- Managers need to identify the root cause of a problem
- Supervisors try to understand the contributing factors of any system or process failure
- Collaborative team brainstorming is required for problem-solving
- Streamlining an existing workflow by uncovering bottlenecks
- Improve output quality and efficiency

Manpower: Human Resources
Anything related to people that are involved with the process relevant to the problem statement. Manpower commonly includes operators, employees, maintenance teams, supervisors, and quality control specialists.
Machine: Facilities and Equipment
This includes machines used in the process, including all facilities and equipment that may be causing the problem. The causes can be associated with maintenance, usage, and assembly of equipment that could result in bottlenecks.
Method: Processes
Any standardized methods set by supervisors might not be followed by operators accurately. The instructions need to be evaluated to ensure all processes are clear to the team and all areas of operation are described in detail.
Material: Supplies and Resources
All supplies and resources used in the production or process are reviewed to determine their effect. Material defects, mishandling, low quality, and lack of proper inspection can result in problems further along the process.
Measurement: Quality Control
Techniques and tools used to measure quality standards are also a part of the fishbone analysis. Parts and processes need to be analyzed to determine whether they meet the quality control standards set in place, and all problems need to be reviewed to determine the root cause of the problem.
Mother Nature: Environment
When searching for a root cause, the environment plays a crucial role in production processes, whether it is the external factors of the production area or the environmental conditions such as temperature, humidity, pressure, etc. The production facilities must be able to handle the environment without having any negative impact on the production or process for a streamlined workflow.

Draft a Clear Problem Statement
For constructing a fishbone diagram, a clear problem statement needs to be drafted to test causes in order to determine what’s causing the problem and present a solution.
During analysis, the problem statement is written at the right side of the fishbone, at the head of the fish. The problem is the effect, and the causes need to be categorized in the next step.
Identify Major Categories
Major categories that are involved in the process or procedure relevant to the problem need to be identified. The categories are connected to the backbone of the fish diagram.
Commonly, the 6M’s, as stated above, are used for the categorization of the causes, while the number of categories is not limited, and it can include different categories relevant to the problem.
Work Out Possible Contributing Factors
After categorization, possible contributing factors need to be brainstormed and attached to the appropriate category or the “rib.” Managers can create a list of causes and then attach them to the relevant rib, or some may find it easier to place ideas on the respective category as they are generated.
Some causes could also fit into multiple categories, which helps analyze the factor from different perspectives. Keep asking what’s causing the problem and evaluate each factor. The fishbone branches out into multiple ribs as more causes come to light.
Analyze the Diagram and Investigate
When the fishbone diagram is constructed with the problem, categories, and causes, the analysis of the diagram is required to understand why that factor is occurring. This can be done by asking the team why questions, typically known as the five whys and is usually represented in a root cause analysis presentation .
Asking five questions is usually enough to reach a root cause, while in some factors, more than five questions may be needed.
Check for Root Causes That Need to be Addressed
Lastly, as the root causes come to light after analyzing the fishbone diagram, they need to be addressed to minimize or eliminate the problem. What’s next is generating workable solutions that need to be implemented as a top priority.
A popular alternative to the fishbone diagram is the 5 whys method that is used for conducting a root cause analysis. The quality control tool can be used individually and even in combination with the fishbone diagram to determine the problem, its origin, why it happened, and most importantly, figure out how the chances of the problem recurring can be reduced.
The 5 whys fishbone analysis helps determine the causes of the problem and finds out the root causes. A set of 5 why questions lead the team to dig deeper into the problem, speed up the problem-solving process, and enable them to take action to prevent it from happening in the future.
Problem Statement:
In the first quarter of 2022, reported defects in production increased to 20%.
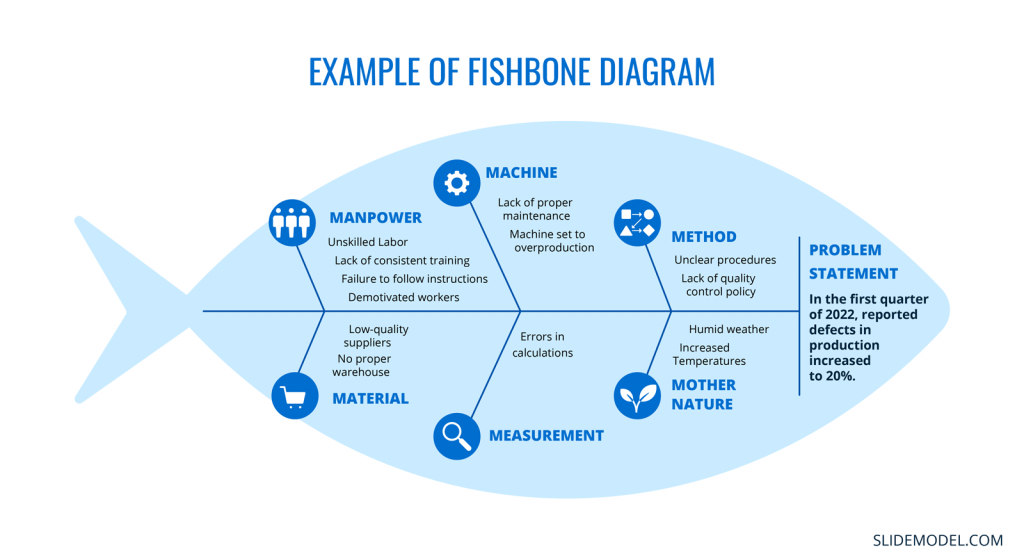
- Unskilled Labor
- Lack of consistent training
- Failure to follow instructions
- Demotivated workers
- Unclear procedures
- Lack of quality control policy
Measurement:
- Errors in calculations
- Lack of proper maintenance
- Machine set to overproduction
- Low-quality suppliers
- No proper warehouse
Mother Nature:
- Humid weather
- Increased Temperatures
Increase in customer complaints about product quality.
- Lack of training for employees
- Inadequate customer service skills
- Employee turnover affecting quality
- Inefficient quality control procedures
- Lack of clear product assembly guidelines
- Inadequate testing at different production stages
Product Design:
- Design flaws leading to defects
- Outdated machinery causing defects
- Lack of preventive maintenance leading to quality issues
Delays in project completion.
- Insufficient skilled project team
- Poor communication among team members
- Inadequate project management experience
- Unclear project scope and objectives
- Inadequate project planning and scheduling
- Lack of risk assessment and mitigation
- Inadequate budget allocation for project
- Limited availability of necessary resource
- Unreliable suppliers causing delays
External Factors:
- Regulatory changes impacting project
- Delays caused by adverse weather
Decrease in website traffic.
People/Skills:
- Lack of SEO knowledge among content creators and editors
- Inadequate social media marketing skills
Content Quality:
- Outdated and irrelevant website content
- Inadequate use of keywords for SEO
- Poorly written and unengaging content
Technical Issues:
- low website loading due to large images
- Broken links and frequent errors
- Ineffective mobile responsiveness
Marketing Strategies:
- Inconsistent promotion across platforms
- Lack of engagement with the target audience
- Ineffective use of online advertising
High employee turnover rate.
Work Environment:
- Poor workplace culture and lack of employee engagement
- Inadequate work-life balance
Management Practices:
- Ineffective leadership and communication
- Lack of recognition and rewards
- Inadequate opportunities for growth
Compensation:
- Below-market salaries and benefits
- Inadequate performance-based incentives
Recruitment and Hiring:
- Inaccurate job descriptions and expectations
- Insufficient screening of candidates
- Lengthy and inefficient hiring process
Pros and Cons of Fishbone Diagrams
Fishbone diagrams, also known as Ishikawa diagrams or cause-and-effect diagrams, are powerful tools for analyzing and solving complex problems. However, like any methodology, fishbone diagrams come with their own set of advantages and disadvantages. Let’s explore the pros and cons of using fishbone diagrams in problem-solving and decision-making processes.
- Visual Clarity: Fishbone diagrams provide a visual representation of the causes and effects of a problem, making it easier to understand the relationships between different factors.
- Holistic Analysis: They encourage comprehensive analysis by considering multiple categories of potential causes, ensuring a more thorough exploration of the problem.
- Structured Approach: Fishbone diagrams offer a structured framework for organizing thoughts and ideas, facilitating more organized problem-solving sessions.
- Collaborative Tool: They promote collaboration among team members by facilitating brainstorming sessions and encouraging diverse perspectives.
- Identification of Root Causes: Fishbone diagrams help in identifying the root causes of a problem, rather than just addressing its symptoms.
- Problem Prioritization: By categorizing causes and effects, teams can prioritize which issues to tackle first, leading to efficient problem-solving.
- Easy Communication: Fishbone diagrams provide a clear visual representation that can be easily shared with team members and stakeholders, enhancing communication.
- Data-Driven Analysis: They encourage data collection and analysis, enabling teams to make informed decisions based on evidence.
- Simplicity vs. Complexity: While fishbone diagrams work well for relatively simple problems, they might not be suitable for extremely complex issues with numerous interrelated causes.
- Subjective Interpretation: The process of categorizing causes and effects might involve subjective judgment, potentially leading to biased analysis.
- Overemphasis on Quantity: Focusing on listing numerous causes might divert attention from the most critical factors that require immediate attention.
- Time-Consuming: Constructing a fishbone diagram requires time, particularly when involving a large team. In time-sensitive situations, this can be a drawback.
- Limited to Known Causes: Fishbone diagrams rely on existing knowledge and may miss out on new or unexpected causes that were not previously considered.
- Complex Presentation: As the diagram becomes more intricate with more causes and categories, it might become difficult to interpret, defeating its purpose.
- Lack of Concrete Solutions: While fishbone diagrams identify causes, they don’t necessarily provide solutions. Further analysis is often required to determine the best course of action.
- Not a Standalone Solution: Fishbone diagrams are best used in conjunction with other problem-solving tools and methodologies for a well-rounded approach.
The purpose of a Fishbone Diagram Template is to inform the audience about the various problems affecting the company in a specific industry, and in turn, persuade them to present a plan of action to solve those problems.
A fishbone diagram can be visualized on paper, whiteboards, and even digitally with the help of digital whiteboards and presentations.
We recommend using Slide Model’s professionally designed 100% editable templates for PowerPoint and Google Slides to conduct a fishbone analysis.
From flat modern elements to a 3D perspective fishbone diagram, several different templates, including root cause analysis fishbone diagrams, can be used for conducting a root cause analysis, addressing problems, and presenting a solution to the team.
Here we have compiled a list of 100% editable fishbone diagram presentation templates that you can use for preparing presentations for cause & effect analysis.
1. Fishbone Infographic PowerPoint Diagram
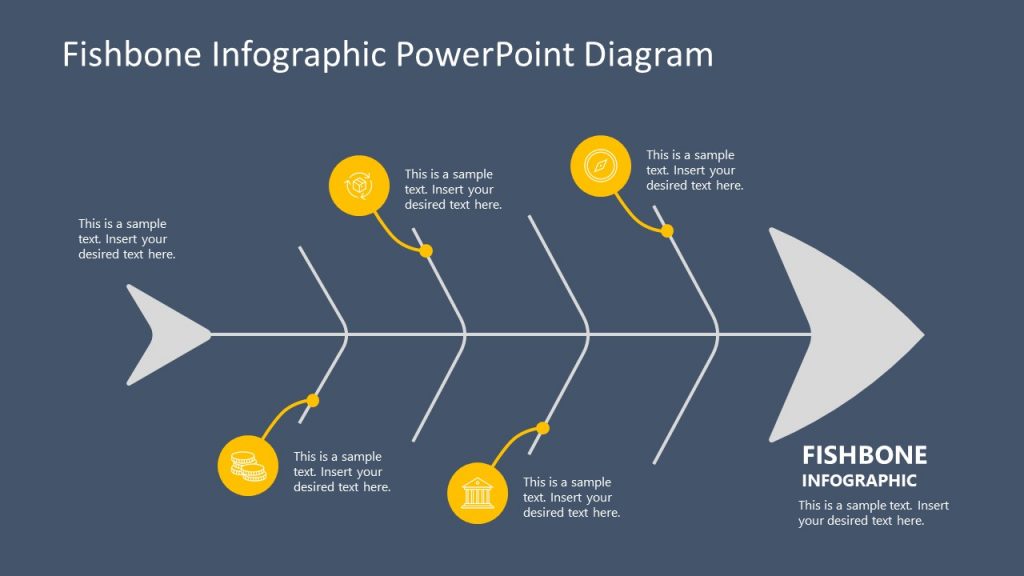
A fishbone infographic PowerPoint template is a creative depiction of the Ishikawa diagram. The bone structure is made for presenting 4 categories, identifying causes, and analyzing their effects to get to the root of any problem.
Use This Template
2. Fishbone Diagram Template 3D Perspective
3D perspective fishbone template for PowerPoint and Google Slides is for conducting a cause and effect analysis in an appealing way and determining the root cause of the problem. Most likely factors can be presented with a proper analysis, while less impactful causes can be trimmed to reach the conclusion.
3. Animated 3D Fishbone PowerPoint Template
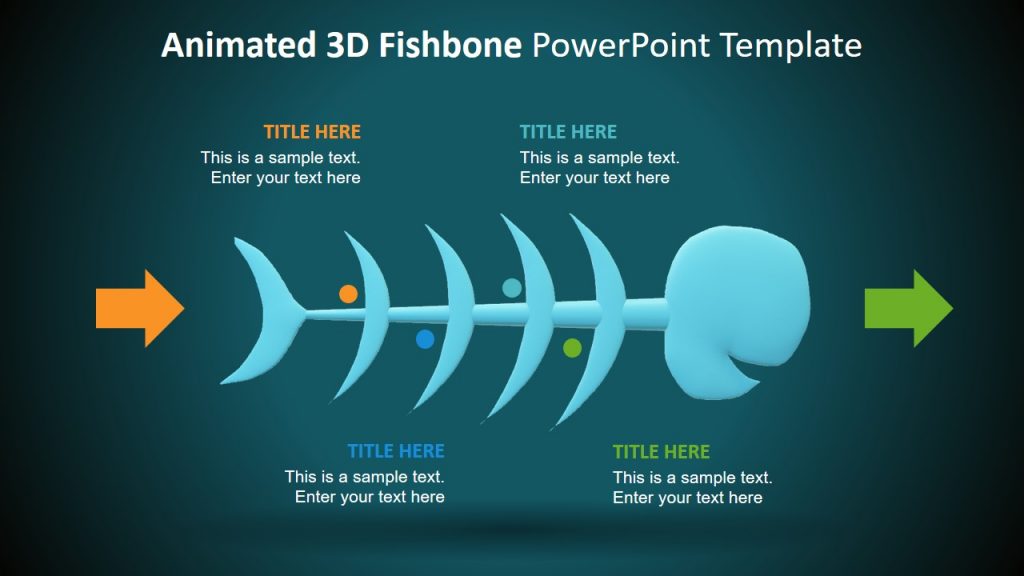
Another 3D template for the fishbone analysis that is fully compatible with PowerPoint and Google Slides can help managers present the root cause in any professional setting. The fishbone diagram is combined with 3D animations to create a realistic perspective making the RCA analysis interesting for the team.
4. Flat Fishbone Diagram for PowerPoint
This flat fishbone template is a professional presentation diagram for determining factors that are contributing to the problem. The analysis can be presented and summarized easily, while the template can also be used during real-time brainstorming sessions to create the fishbone diagram.
5. Cause and Effects PowerPoint Infographic Template
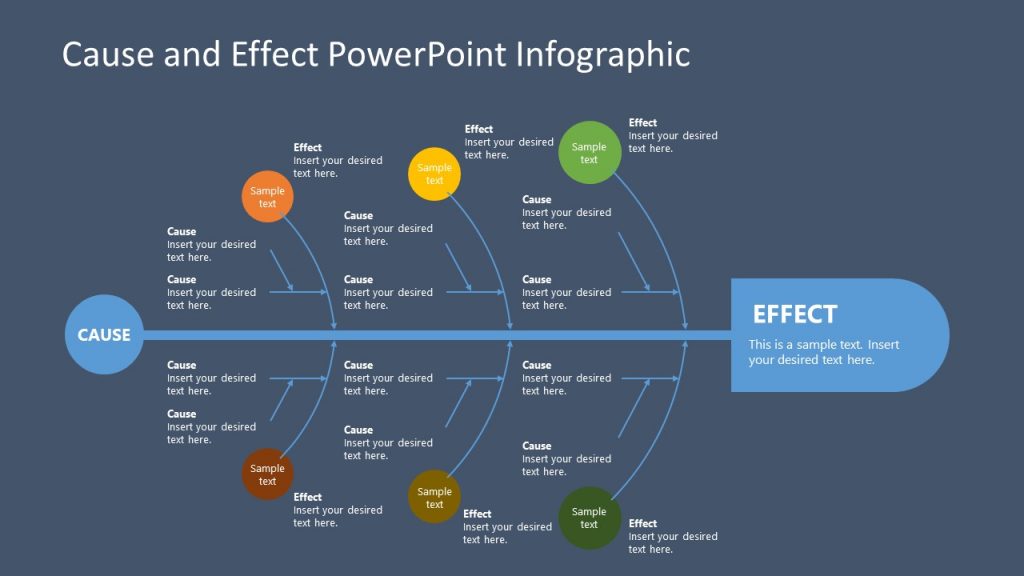
This cause and effect analysis template is for presenting a comprehensive look at the categories and their causes to determine the root cause of the problem. Fully customizable and compatible with PowerPoint and Google Slides, the template is a flat-vector-based Ishikawa diagram that enables teams to discuss project issues and drill down to the root cause of the problem.
6. Realistic Fishbone Diagram Template for PowerPoint
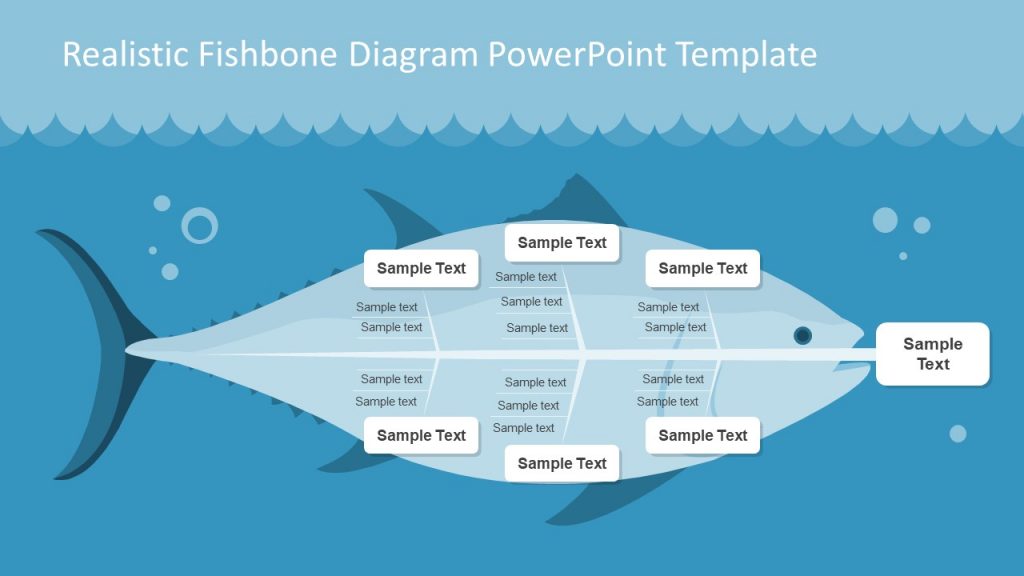
The realistic fish illustration in this fishbone template for PowerPoint and Google Slides can be used for analyzing problems, identifying root causes, and presenting solutions. Complex problems can be broken down to assist users in brainstorming and coming up with creative solutions for solving the problem.
7. Fishbone Template for PowerPoint
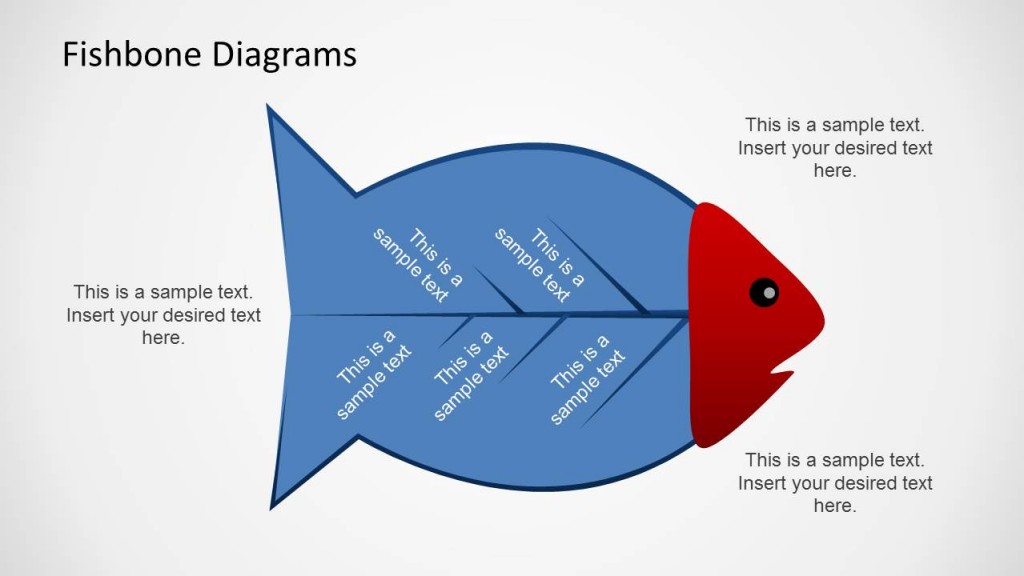
Another creative presentation template for the fishbone diagram that is helpful for conducting a root cause analysis (RCA) and presenting the cause and effect analysis results. The simple fish design makes the presentation engaging and memorable for the audience.
The fishbone analysis is a powerful tool for brainstorming potential causes of any problem and drilling down to the root cause for presenting a solution. It gives managers and teams a holistic look at the process categories and their issues and enables them to focus on areas that need to be fixed in order to minimize or eliminate the problem.
Our 100% editable fishbone diagram templates and root cause analysis templates made for PowerPoint and Google Slides are helpful for making professional presentations that can be used during brainstorming sessions, and also when presenting the solution after conducting the root cause analysis.
The simple-to-use, visual problem-solving tool is made to take corrective action with accurate analysis that can only be done while looking at the whole picture and improving processes by providing a framework for solving complex problems.

Like this article? Please share
Cause and Effect, Diagram Templates, Fishbone Analysis Filed under Business
Related Articles

Filed under Presentation Ideas • October 7th, 2023
Venn Diagram Ideas for PowerPoint Presentations
In this article, you will learn the basics of Venn diagrams, how they can be used in presentations and what type of information they are recommended for.
Filed under PowerPoint Tutorials • October 5th, 2023
How To Make Curved Arrows in PowerPoint
There are several methods by which you can make curved arrows for your presentations. In this article, we explain three different ways to draw arrows in PowerPoint.

• September 8th, 2023
Strategic Planning Process Templates For PowerPoint Presentations
Access a list of some very fine strategic planning process templates for PowerPoint that can be used for making business and academic presentations.
Leave a Reply
- Guide: Fishbone Diagram

Daniel Croft
Daniel Croft is an experienced continuous improvement manager with a Lean Six Sigma Black Belt and a Bachelor's degree in Business Management. With more than ten years of experience applying his skills across various industries, Daniel specializes in optimizing processes and improving efficiency. His approach combines practical experience with a deep understanding of business fundamentals to drive meaningful change.
- Last Updated: October 19, 2023
- Learn Lean Sigma
The Fishbone Diagram, also known by various other names such as Ishikawa Diagram, Cause and Effect Diagram or 6Ms, is a visual tool used in problem-solving and root cause analysis . Originating from the quality management sector, it is used as a systematic approach to identify, explore, and display possible causes of a specific problem.
Table of Contents
What is a fishbone diagram.
The Fishbone Diagram is a graphical tool used for identifying and organizing possible causes of a specific problem or outcome. The diagram resembles the skeletal structure of a fish, hence its name. At the “head” of the fish is the problem you’re trying to solve, and the “bones” branching off the spine are the multiple potential causes contributing to that problem.
The benefit of a Fishbone Diagram lies in its simplicity. It gives you a structured way to brainstorm and categorize the various factors affecting a specific issue. The diagram can get as detailed as you need it to be, allowing for sub-causes to branch off the main causes, offering even deeper insights.
The Components of a Fishbone Diagram
Head : The fish’s head represents the problem or effect you’re analyzing.
Spine : The long, horizontal line connecting to the head serves as the timeline or sequence of the problem.
Bones : These are the categories of potential causes. They branch off the spine, leading towards the head.
Sub-Bones : These are the more specific factors or sub-causes that stem from the main categories.

Why Use a Fishbone Diagram?
The Fishbone Diagram is a flexible tool that can be used for a range of applications. Here’s why it’s so useful:
1. Easy Visualization:
One of the primary advantages of using a Fishbone Diagram is its ability to simplify complex problems. With all potential causes visually represented in one place, it becomes easier to analyze and discuss the issues.
2. Team Collaboration:
The Fishbone Diagram is excellent for brainstorming sessions. It encourages team members to think critically and contributes to a shared understanding of the problem. It’s collaborative by design, allowing for the collective intelligence of the group to shine.
3. Root Cause Analysis:
Identifying symptoms of a problem is one thing; uncovering the root cause is another. The Fishbone Diagram excels at this by forcing you to dig deep into various contributing factors. By isolating these causes, you’re better positioned to find a lasting solution.
By using a Fishbone Diagram, you’re not just addressing a problem with a short-term fix; you’re conducting a thorough investigation to eliminate issues from the root up.
How to Create a Fishbone Diagram: A Detailed Guide
Creating a Fishbone Diagram might seem like a daunting task, but it’s actually a straightforward process. Here, we’ll break down each step in detail to ensure you can construct a Fishbone Diagram that serves its purpose effectively.
Materials You’ll Need:
- A whiteboard or large sheet of paper
- Markers or pens
- Sticky notes (optional)
- A team of people for brainstorming
Step 1: Identify the Problem
The first and most crucial step is to clearly identify the problem you’re trying to solve. This statement should be specific and concise. Write this problem statement at the far right side of your whiteboard or paper, as it will serve as the “head” of your fishbone diagram.
- Use data to define the problem whenever possible.
- Make sure the problem is mutually understood and agreed upon by all team members.
Step 2: Determine the Main Categories
Now, draw a horizontal line from the problem statement towards the left side of the board. This is the “spine” of your fish. Next, you’ll identify the major categories of causes that could be contributing to the problem. These categories will serve as the main “bones” branching off from the spine.
Common categories often include:
- Measurement
- Environment
- The categories can be industry-specific or general, depending on the problem you’re analyzing.
- Aim for 4-6 main categories for better manageability.
Step 3: Brainstorm Causes
Once you’ve determined the main categories, it’s time to brainstorm potential causes for each category. These causes will be the smaller “bones” that branch off from the main bones. If you’re working with a team, this is an excellent time for a brainstorming session.
- Use sticky notes to write down ideas so you can easily move them around.
- Encourage every team member to contribute; sometimes the most unexpected insights come from diverse perspectives.
The output of the root cause analysis at this point may look something like the below example. With the lack of preventative maintenance being explored with the 5Whys analysis.

Step 4: Dig Deeper with Sub-Causes
Sometimes, the primary causes can be broken down into smaller, more specific sub-causes. This is where the “ 5 Whys ” technique can be beneficial. For each primary cause, ask “Why?” up to five times to dig deeper into the root of the issue.

- Not all primary causes will need sub-causes; use your discretion.
- Keep the diagram organized to ensure readability.
Step 5: Analyze and Take Action
After all the causes and sub-causes have been identified, it’s time to analyze the Fishbone Diagram as a team. Highlight or circle the causes that seem most likely to be contributing to the problem. These are the areas that will need immediate attention and action.
- Use data or evidence to support your conclusions.
- Create an action plan assigning responsibility for each highlighted cause.
And there you have it! You’ve successfully created a Fishbone Diagram that will help you get to the root of your problem.
Examples and Case Studies: Understanding Fishbone Diagrams in Action
Case study: manufacturing unit with quality issues.
Imagine you run a manufacturing unit, and you’ve been receiving complaints about the quality of your products. You decide to use a Fishbone Diagram to get to the root of the issue.
Step 1: Identify the Problem Problem Statement: “High number of defective products in the last quarter.”
Step 2: main categories.
- People : Untrained staff, high employee turnover
- Process : Inconsistent quality checks, outdated SOPs (Standard Operating Procedures)
- Equipment : Aged machinery, lack of maintenance
- Environment : Poor lighting, extreme temperature fluctuations
Step 4: Dig Deeper (5 Whys)
- Untrained Staff : Why? No formal training program.
- Aged Machinery : Why? No budget allocated for equipment upgrades.
After analyzing the Fishbone Diagram, you realize that untrained staff and aged machinery are your primary culprits. Your next steps could involve investing in staff training programs and allocating budget for machinery upgrades.
By following these steps, you can develop targeted strategies to improve product quality significantly.
Common Mistakes and Tips: How to Make the Most of Your Fishbone Diagram
1. overlooking minor causes.
While it’s easy to focus on the most glaring issues, minor causes can accumulate and have a significant impact.
Tip : Don’t disregard a cause just because it seems minor. Sometimes, fixing smaller issues can lead to big improvements.
2. Ignoring Data
It’s tempting to rely solely on brainstorming and intuition, but data should be your guiding star.
Tip : Use metrics and KPIs to support or refute the causes you’ve identified. This adds credibility to your findings and helps you prioritize effectively.
3. Stopping at Symptoms
Identifying symptoms is just the first step; your ultimate goal should be to uncover the root causes.
Tip : Use techniques like the “5 Whys” to dig deeper into each cause and ensure you’re addressing the root of the issue, not just its manifestations.
Fishbone Diagrams are a fantastic asset in the toolbox of anyone interested in continuous improvement. Whether you’re a seasoned professional or just getting started, this simple yet powerful tool can help you dissect complex problems and develop targeted solutions.
They encourage you to look beyond the obvious and delve into the intricacies that contribute to each problem. So go ahead, grab that pen and paper (or a whiteboard, if you’re feeling fancy), and start your journey towards effective problem-solving.
- Ilie, G. and Ciocoiu, C.N., 2010. Application of fishbone diagram to determine the risk of an event with multiple causes. Management research and practice , 2 (1), pp.1-20.
- Coccia, M., 2018. The Fishbone diagram to identify, systematize and analyze the sources of general purpose Technologies. Journal of Social and Administrative Sciences , 4 (4), pp.291-303.
Q: What is the origin of the Fishbone Diagram?
A: The Fishbone Diagram was originally developed by Dr. Kaoru Ishikawa, a Japanese quality control statistician, in the 1960s. It’s also sometimes referred to as the Ishikawa Diagram in his honor.
Q: Can Fishbone Diagrams be used for non-manufacturing problems?
A: Absolutely! While Fishbone Diagrams are popular in manufacturing and quality management, their application is not limited to these areas. They can be used in healthcare, software development, event planning, and even for personal problem-solving.
Q: How many main categories should my Fishbone Diagram have?
A: The number of main categories can vary depending on the complexity of the problem. However, it’s generally advisable to have between 4-6 main categories for easier analysis and readability.
Q: Can I use software to create a Fishbone Diagram?
A: Yes, there are several software tools available for creating Fishbone Diagrams, such as Microsoft Visio, Lucidchart, and various other project management software options. However, a simple pen and paper or a whiteboard can be just as effective for smaller teams or simpler problems.
Q: How do I know which causes to prioritize after creating a Fishbone Diagram?
A: After creating your Fishbone Diagram, you should analyze it with your team to identify the most likely root causes of the problem. Using data to support your conclusions can be very helpful. You may also employ techniques like the Pareto Analysis to prioritize causes based on their impact.

Daniel Croft is a seasoned continuous improvement manager with a Black Belt in Lean Six Sigma. With over 10 years of real-world application experience across diverse sectors, Daniel has a passion for optimizing processes and fostering a culture of efficiency. He's not just a practitioner but also an avid learner, constantly seeking to expand his knowledge. Outside of his professional life, Daniel has a keen Investing, statistics and knowledge-sharing, which led him to create the website learnleansigma.com, a platform dedicated to Lean Six Sigma and process improvement insights.
Free Lean Six Sigma Templates
Improve your Lean Six Sigma projects with our free templates. They're designed to make implementation and management easier, helping you achieve better results.

Other Guides
Was this helpful.
Fishbone Diagram in Education Essay
- To find inspiration for your paper and overcome writer’s block
- As a source of information (ensure proper referencing)
- As a template for you assignment
For this brainstorming activity, I decided to apply a fishbone diagram to discuss possible solutions for the low reading performance of some students. The teachers involved in the process were participating in the discussion and sharing the ideas. The chosen approach helped them structure their thoughts because everyone added at least four branches to the central arrow of the fishbone diagram. It can be concluded that the selected method had a positive impact on the team members and ensured proper cooperation by helping shape the debate and identifying causes and solutions for the issue.
My role as a leader, in this case, was to guide the teachers and explain to them ways in which they can visually present their ideas to ensure a more efficient discussion. I used a PowerPoint presentation to provide information on how to use the fishbone diagram and the components that help find a solution. What worked, in this case, is the process of identifying causes that contribute to the problem. The aspect that did not work became evident after the activity was over because some team members wanted to add more arrows to the fishbone diagram since they had new ideas; thus, some thoughts were left out of the debate.
Several aspects and skills should be enhanced to improve the experience both for team members and for me as a leader. I will need to dedicate more time to the initial process of problem discussion to ensure that everyone can think over all possible causes and solutions and add them as branches to the diagram. Additionally, it is helpful to add categories to the layout to ensure better structuring for the ideas. Finally, I would leave the created fishbone diagram on a board so that teachers would be able to add thoughts to it afterward.
- Flowchart and Other Quality Improvement Tools
- Quality Leadership & Ethics in Project Management
- Dubai Consumer Protection Division's Activities
- Learning Styles and Personality Tests Reflection
- Learning Through Art: A New Approach to Education
- Kinesthetic Learning Style and Teaching Approaches
- Receptive Learning Styles in College Students
- Meaningful Learning in the College Settings
- Chicago (A-D)
- Chicago (N-B)
IvyPanda. (2021, April 25). Fishbone Diagram in Education. https://ivypanda.com/essays/fishbone-diagram-in-education/
"Fishbone Diagram in Education." IvyPanda , 25 Apr. 2021, ivypanda.com/essays/fishbone-diagram-in-education/.
IvyPanda . (2021) 'Fishbone Diagram in Education'. 25 April.
IvyPanda . 2021. "Fishbone Diagram in Education." April 25, 2021. https://ivypanda.com/essays/fishbone-diagram-in-education/.
1. IvyPanda . "Fishbone Diagram in Education." April 25, 2021. https://ivypanda.com/essays/fishbone-diagram-in-education/.
Bibliography
IvyPanda . "Fishbone Diagram in Education." April 25, 2021. https://ivypanda.com/essays/fishbone-diagram-in-education/.

Reading for Learning
Pedagogy, Curriculum and Assessment
Using A Fishbone Diagram for Writing Cause and Effect Texts
Morning – just a quick post on using a fishbone diagram to help students write more focused cause and effect texts – especially when there are multiple causes.

Each rib is for a separate cause contributing to the effect. Once the ribs have been completed with brief detail (which you can check as you go), the student can write a short introduction followed by a paragraph for each cause.

Advantages at the Fishbone Stage:
- Quick for the teacher to see where knowlegde gaps are (great for checking the whole class during the lesson).
- Great for supporting with vocabulary (e.g. “Instead of towns and cities , you could say urban areas .”)
- Students hate planning a text – this doesn’t feel like a plan.
- Good for revision later (they won’t re-read the text in 6 months time, but they might look at the fishbone).
- It’s quick –
Advantages at the Writing Stage:
- Students can concentrate on the quality of writing without having to hold all of the essay in their heads.
- The writing structure makes it easy to assess in class (Teach Like a Champion – Check for Understanding / Name the Lap – “This time I’m only going to look at your introduction sentence”).
- Reduces waffle.
I hope that’s useful. Let me know if you use a fishbone organiser to support writing during lockdown.
Share this:

Published by BenRogers
18 years secondary teacher: 4 years primary. MA in SciEd. Author of 'Big Ideas of Physics and How to Teach Them.' Director of Curriculum and Pedagogy for Paradigm Trust. View all posts by BenRogers
Leave a comment Cancel reply

- Already have a WordPress.com account? Log in now.
- Subscribe Subscribed
- Copy shortlink
- Report this content
- View post in Reader
- Manage subscriptions
- Collapse this bar
Advisory boards aren’t only for executives. Join the LogRocket Content Advisory Board today →
- Product Management
- Solve User-Reported Issues
- Find Issues Faster
- Optimize Conversion and Adoption
Cause and effect analysis with a fishbone (Ishikawa) diagram

Imagine you have been tasked with solving a problem: customers are experiencing lag while attempting to check out from their carts. Specifically, the app takes two minutes to transition from the cart page to the payment page once a customer clicks Continue .

What would you do? The first question that comes to mind is “why,” right? To answer this question, you’ll need to identify all the steps that customers take when checking out, and then assess how each step is performing. Together, these answers will enable you to determine the exact point in the checkout process where the problem is occurring.
This is called “root cause analysis” — you tried to list all the possibilities that could have created this problem. And out of all possibilities, you found which likely created the problem.
Let’s refer to the problem as the “effect,” and all the potential causes you identified during your analysis as the “causes.” Now, imagine trying to represent this cause-and-effect analysis visually. What types of diagrams could you create?
Maybe a tree whose roots are the effect and all the branches as the cause(s). Or maybe an Excel table listing all the causes and sub-causes in columns. Those are all good options, but in this article, we’ll discuss a cause-and-effect diagram (also called a fishbone diagram or Ishikawa diagram).
What is a fishbone diagram?
To start, a fishbone diagram (or Ishikawa diagram) is a tool to visually explore and represent the possible causes of an effect. The tool helps in identifying the potential causes that could have caused the problem.
A sample fishbone diagram looks like this:

It is called a fishbone as it looks like the skeleton of a fish. The head of the fish explains the problem statement (or the effect) and the bones attached explain the possible cause and sub-causes.
The history behind fishbone diagrams
Although the early history of fishbone analysis is slightly unclear, fishbone diagrams are believed to have been in use since the 1920s. However, it was during the 1960s that the diagram gained widespread popularity, thanks to the work of Dr. Kaoru Ishikawa on quality management processes for Kawasaki Shipyards.
It’s believed that Ishikawa first presented the fishbone analysis method in 1945, as part of the development of a company-wide quality control process. The creation of quality improvement processes and tools, along with the introduction of quality circles, played a significant role in the evolution of the concept of total quality management. The Ishikawa diagram became recognized as one of the seven basic quality tools.
When to use a fishbone diagram
The purpose of the fishbone diagram is to identify all the root causes of a problem. You can use fishbone analysis in product development — let’s list a few cases where you should use fishbone analysis:
- When you have to identify the possible causes of a problem
- When you have to develop a feature or product to fix the cause of a problem. This is a reverse analysis where business analysts find the gap in market need and fill that gap with a product or feature
- When evaluating a business process to find loopholes or gaps that create problems
- When you’re defining a process for quality control. Evaluate and find the current gap in quality and build processes to fill it
You can apply the fishbone analysis tool to most applications that need an establishment of quality control and management.
Now, we’ll go over the fishbone diagram and how you can apply it to multiple industries. Most businesses fall into one of these operation areas: services, manufacturing, and marketing, each of which can use a different fishbone diagram. While manufacturing may not be directly relevant to digital products, the fishbone diagram can still be a useful tool for uncovering problems and identifying potential causes. You can modify them accordingly to fit the context of your product.
Let’s start with the 4 Ws: what, why, when, and where. Applying these will help you find the possible potential causes for any effect. This is a good way to brainstorm and all fishbone diagrams must start with these, regardless of the industry you’re in. The 4 Ws are:
- What? There will be materials, products, lines of code, and other resources involved in the problem creation. Ask “what?” to help to pinpoint the specific components or resources that may be contributing to the issue
- Why? There will be situations or conditions that lead to the problem. Asking “why?” may help to uncover factors such as network failure, temperature, weather conditions, or other external considerations that may be impacting the system
- When? There will be a moment when a particular problem occurs. Ask “when?” to find out the time the problem occurs and figure out if it’s a recurring or isolated incident
- Where? Asking this question can help to identify specific areas, such as during the checkout process, a different part of the application, or within a specific context where the issue is most prominent.
Many businesses in the service industry indeed share similarities when it comes to cause analysis in their operational areas. Specifically, the 5 S’s (systems, suppliers, surroundings, safety, and skills) can be applied to cause and effect analysis within the service business.

Over 200k developers and product managers use LogRocket to create better digital experiences
While all service businesses don’t need to conduct a complete cause analysis using the 5 S’s, many find that these principles can be applied at the initial levels and then gradually approached more thoroughly as they identify potential causes within their unique environment:

Systems are the methods, policies, processes, products, and tools used to build operational excellence and provide service without any failure.
Suppliers are any issues in delivering the service itself, like lower quality of service, failure to support customers, delay in refunding payments, agents or vendors delay, and more.
Surroundings are any external factors such as market, competition, public relations, brand value/image, etc. that may contribute to the issue.
Skills focus on finding issues in training, qualifications, skill set, and the experience of employees providing the service.
Safety focuses on finding issues in the system’s overall safety, products, operational procedures, and work environment.
Though the 6 Ms apply mainly to the manufacturing industry, you can transfer this framework into the software industry as well. Since digital products don’t have physical parts, not all of them will be relevant, but we’ll highlight them anyway:

Material focuses on finding issues in any raw materials used for manufacturing. This includes issues with the quantity or quality of supplies, any issues with the timeline of procurement and supply, and more.
Method focuses on finding issues in processes, policies, regulations, training, and guidelines used by companies. Though this is relevant to manufacturing physical goods, these apply to digital products as well (in context).
Machine focuses on finding issues in machines that are used in manufacturing (production). This will help uncover any issues with the maintenance of machines, any failures in the machine or assembly line, etc.
Mother nature , aka the environment, focuses on finding issues in environmental conditions. For physical goods, this could mean issues with temperature, light conditions, etc. For digital products, this could mean issues with servers going down, weather causing latency problems, and more.
Manpower (aka people) focuses on finding issues in the workforce. This means any issues with the work itself, employee burnout, training and skill sets, and more.
Measurement focuses on finding issues in measuring the process and results. This is huge in any business, as metrics and measuring success are vital to the health of a company. Use this to find any issues in quality readings, calculations, and more.
There are 7 Ps that can be commonly applied in cause analysis. These are all related to marketing businesses, but nearly all physical and digital products have marketing functions that affect their product and that this can apply to:

People focuses on finding issues in people involved in marketing a product or service to customers. This implies issues with not targeting the right audience or marketers not having a good understanding of the product.
Product is focused on finding issues in the product or service of an organization. This could be several things, including the perceived image of the product , issues with availability to reach customers, or failure to meet customer needs .
Process works on finding issues in procedures for promoting and marketing the product or service. Are there any gaps in cross-functional team collaboration ? Are they any issues with the escalation matrix?
Price is a big one. This is where to uncover issues in the pricing of the product or service. Is the price too low? Maybe it’s too high? Are there any issues with the price range not matching the competition or with accepting certain payment methods?
Promotion focuses on finding issues in promotion methods, mediums, and strategies. Are social media advertisements reaching the right audience? Is it generating enough clicks?
Place identifies problems with the location of your product. Are there any issues with the availability of your product on particular devices?
Physical evidence is the last of the Ps. It focuses on finding issues in the direct visibility of your product or service. If it has a physical component, is there a problem with the packaging? Physical evidence literally implies any physical issues with the product getting into the hands of customers.
Advantages and disadvantages of fishbone diagrams
There are many advantages you carry when you use a fishbone diagram as a tool for your cause analysis, including:
- Simplicity : the visual representation is simple and easy to understand. Anyone who understands the problem can easily go through all the possible causes of that problem
- Flexibility : you can dissect the cause into sub-causes and go deeper to find the cause
- Associativity : any cause becomes a potential candidate to generate the effect. The relationship with the problem is tightly defined, helping you conclude your analysis
- Ease of use : it’s easy to brainstorm with a team and explain how to use the diagram. Everyone can instantly adapt and be involved in a brainstorm
- Fast : it helps you analyze the root causes quickly by applying the 5 Why’s and drill down potential causes
- Prioritization : visual representation helps you to prioritize your causes and narrow down the most important ones
There are also a few limitations that can make fishbone diagrams difficult to use, including:
- Causes may not be as relevant as you once thought. This could lead to confusion on the path forward or create another problem by accident
- If oversimplified, the fishbone analysis may not uncover what you’re looking for
- There’s potential to prioritize smaller causes over critical ones. Since prioritization is so easy, the team may focus on small causes and waste time in fixing them
- The more dissection into sub-clauses you do leads to more complex diagrams. These may eventually become messy and difficult to understand
- The analysis is mostly based on understanding and brainstorming. It needs additional evaluation of the cause, which in case all possibilities have to be evaluated, can become inefficient and time-consuming
Fishbone diagram template
If you’d like a fishbone diagram template to work with, you can download this one I made on Google Sheets . Feel free to make a copy of it and customize it for your own use.
If you’d like to try to create a fishbone diagram yourself for your own team and organization, here are some common steps to make and analyze it:
- Identify and write the effect (problem statement) as the fish head
- Brainstorm and identify major causes. Write a major cause on each side bone. These major causes can be the Ms, Ps, or S’s with regard to the industry you’re in, or a combination of multiple
- Brainstorm and identify sub-causes. Write the sub-cause on each smaller bone
- Check for completeness. Evaluate or review for too few causes or narrow it down if you have too many
- Analyze each potential cause to narrow it down further. The goal is to end up with one or more that need to be fixed
- Prioritize the potential cause based on its severity on the effect
Let’s draw the fishbone diagram for a digital product. We’ll use the problem we listed at the beginning where customers are facing problems during the checkout process:

While this list may not be comprehensive, it does cover many potential causes that could lead to delays in opening the payments page. It’s important to note that during a brainstorming session, many potential causes can arise, but it’s important to focus on the most likely causes to address first. In this case, we’ve highlighted a sub-cause in red that represents the result of the analysis and the area that should be addressed.
How product managers can use fishbone diagrams
There are many cases where product managers have to analyze the cause of a problem, and a fishbone diagram is a powerful tool for product managers to benefit from. Its easy and quick creation helps quickly narrow down potential causes and act upon them.
A few examples where product managers can make use of fishbone diagram are:
- Finding the root cause for a reduction in feature usage
- Finding the root cause of churn
- Learn the effects of new features on the application upfront
- Analyze what the team should focus on while prioritizing enhancements for a feature
- Presenting the quality measures taken on certain features to senior management
The process type fishbone diagram
A not-so-popular and not-so-in-use flavor for creating fishbone diagrams is the process-type fishbone diagram. It’s very similar but has a small change in the drawing:

The main bone of the fish is divided into multiple cause areas. Team brainstorms potential causes that could have created the problem in each of these areas. It is called process type because each area in the main bone (mostly) represents a process, but each area in the main bone also represents a department. Causes are explored in the process of each department as a result.
These diagrams are not that popular but are an efficient way to involve multiple cross-functional teams from various departments.
Kaoru Ishikawa popularized the fishbone diagram to analyze the root cause of any problem. It is also called the Ishikawa diagram or cause and effect diagram.
One can use the 4 Ws — what, why, when, and where — to begin cause analysis. Based on industry type, there are common areas of cause analysis: the 5 S’ for services, 6 Ms for manufacturing, and 7 Ps for marketing. If your company or product has a combination of these, you can create multiple fishbone diagrams to get to the root cause of your issue.
Featured image source: IconScout
LogRocket generates product insights that lead to meaningful action
Get your teams on the same page — try LogRocket today.
Share this:
- Click to share on Twitter (Opens in new window)
- Click to share on Reddit (Opens in new window)
- Click to share on LinkedIn (Opens in new window)
- Click to share on Facebook (Opens in new window)
- #product strategy

Stop guessing about your digital experience with LogRocket
Recent posts:.

Understanding the problem space and its role in development
Failing to identify or understand a problem is, when it boils down to it, the main reason why most businesses fail.
Leader Spotlight: Setting processes to achieve organizational alignment, with Juan Gabarro
Juan Gabbaro discusses how product leadership should drive vertical alignment, but the product team should drive cross-functional alignment.

Practical ways to improve your customer experience
Improving your customer experience enhances customer satisfaction and boosts business growth and customer retention.

Leader Spotlight: Viewing loyalty as a commitment to the customer, with Josh Engleka
Josh Engleka talks about how his team at Lowe’s takes a unique perspective because they are all customers, as well as employees.
Leave a Reply Cancel reply
Cause and Effect Fishbone Diagram: Uncover Core Issues
8 minutes read
The cause-and-effect fishbone diagram, also known as the Ishikawa diagram, serves as a powerful tool in problem-solving and root-cause analysis. Uncovering core issues is at the heart of the Fishbone Diagram methodology. By meticulously examining the potential causes branching off the main spine, teams can delve deep into the complexities of a problem, identifying not just the surface-level issues but also their underlying root causes. In this exploration, we will delve into the intricacies of cause-and-effect fishbone diagrams, understanding their structure, methodology, and their pivotal role in uncovering core issues.
Part1. Overview of Fishbone Diagrams
The cause-and-effect fishbone diagrams are graphical tools used to analyze the potential causes of a problem or an effect. They are named after their shape, which resembles a fishbone.

Definition and purpose of Fishbone diagrams
Fishbone diagrams provide a visual representation of the various factors that can contribute to a specific problem or outcome. The main purpose of using a fishbone diagram is to identify and analyze the root causes of a problem, rather than just treating its symptoms. By visually organizing and categorizing the potential causes, it becomes easier to understand the relationships between different factors and identify the most influential ones.
Key components and how they aid in cause identification
- Problem statement: At the head of the fishbone diagram, the specific problem or effect that needs to be analyzed is stated clearly. This serves as a starting point for identifying the causes.
- Categories: The fishbone diagram branches out into several categories, which are aligned with different potential causes. These categories typically include 6 M's: Manpower, Machine, Material, Method, Measurement, and Environment. By categorizing the causes, it becomes easier to analyze and prioritize them.
- Causes: Under each category, various potential causes are listed. These causes are brainstormed by a team or individuals involved in the analysis process. It's important to encourage diverse perspectives and input during this stage to ensure a comprehensive understanding of the problem.
- Analysis and prioritization : Once the causes are identified, they can be analyzed further to determine their likelihood of contributing to the problem. This can be done through data analysis, root cause analysis, or expert opinions. The causes can then be prioritized based on their significance and impact on the problem.
- Relationships: Fishbone diagrams also allow for the identification of relationships between different causes. This can be represented by connecting lines or arrows, showing how one cause may influence or interact with another cause. Understanding these relationships helps in developing effective strategies and solutions.

By utilizing these key components, fishbone diagrams enable a structured approach to problem-solving and aid in the identification of root causes. They promote collaboration and facilitate a deeper understanding of complex problems, ultimately leading to more informed decision-making and improved outcomes.
Part2. Methodology of Fishbone Diagrams
The cause-and-effect fishbone diagrams are useful tools for analyzing the potential causes of a problem or effect. They provide a visual representation of the various factors that can contribute to a specific issue and help in identifying the root causes.
Steps to Construct a Cause-and-Effect Fishbone Diagram
- Identify the problem or effect: Begin by clearly stating the specific problem or effect that needs to be analyzed. This will serve as the starting point for constructing the cause-and-effect fishbone diagram.
- Determine categories: Identify the major categories or factors that could potentially contribute to the problem. These categories are often represented by the 6 M's: Manpower, Machine, Material, Method, Measurement, and Environment. Other categories may be relevant depending on the nature of the problem.
- Brainstorm causes: Under each category, brainstorm and list all possible causes that could contribute to the problem. Encourage input from a team or individuals with different perspectives and expertise to ensure a comprehensive list.
- Analyze and prioritize causes: Once the causes have been identified, analyze them further to determine their likelihood of contributing to the problem. This can be done through data analysis, root cause analysis, or expert opinions. Consider factors such as frequency, impact, and feasibility when prioritizing the causes.
- Draw the diagram: Draw the fishbone diagram by connecting each cause to its respective category using lines or arrows. This visually represents the relationships between different causes and their respective categories.
- Review and refine: Review the fishbone diagram with the team or individuals involved in the analysis process. Make adjustments or additions as necessary to ensure accuracy and completeness.

How the Fishbone Diagram Reveals Core Issues
The fishbone diagram helps in revealing core issues by visually organizing and categorizing the potential causes of a problem. By analyzing the relationships between different causes and their respective categories, it becomes easier to identify the most influential factors or root causes.
The diagram allows for a systematic approach to problem-solving and promotes collaboration among team members. It provides a comprehensive view of the problem, which aids in understanding the complexity of the issue at hand.
By utilizing a fishbone diagram, organizations can gain insights into the underlying causes of problems and make more informed decisions on how to address them effectively. The diagram helps in focusing efforts on tackling the root causes rather than just treating the symptoms, leading to long-term solutions and improved outcomes.
Fishbone diagrams provide a structured methodology for cause analysis and aid in identifying core issues. By following the steps outlined above, organizations can leverage this tool to improve problem-solving capabilities and drive positive change.
Part3. Cause and Effect Fishbone Diagrams Example
Ishikawa diagrams are useful tools for analyzing the causes of quality issues or problems in a process or product. The fishbone diagram helps to identify potential causes and their relationships to the quality issue. Here is an example of how a Quality Analysis Fishbone Diagram can be used.

- Quality Issue: Start by identifying the quality issue or problem that needs to be analyzed. This could be a defect, error, or any other quality-related issue.
- Major Categories: Create the main branches of the fishbone diagram, representing the major categories of potential causes. Common categories include People, Methods, Machines, Materials, Measurements, and Environment. These categories are often referred to as the 6Ms.
- Causes: Under each major category, identify the specific causes or factors that could contribute to the quality issue. For example, under the People category, causes could include lack of training, inadequate skills, or poor communication. Under the Methods category, causes could include incorrect procedures, lack of standardization, or outdated processes.
- Sub-causes: For each cause identified, you can further break it down into sub-causes or contributing factors. This helps to identify the root causes of the quality issue. For example, if the cause is lack of training, sub-causes could include budget constraints, time constraints, or lack of access to training resources.
- Analysis: Once all the causes and sub-causes have been identified, analyze their relationships to the quality issue. Determine which causes are most likely to contribute to the problem and prioritize them for further investigation or action.
- Solutions: Based on the analysis, develop appropriate solutions or actions to address the identified causes and improve the overall quality. These solutions can be implemented to prevent future occurrences of the quality issue.
Remember, this is just one example of how a Quality Analysis Fishbone Diagram can be used. The key is to adapt the diagram to the specific quality issue and customize the categories and causes accordingly.
By applying the Fishbone Diagram to quality analysis, organizations can gain a better understanding of the root causes of quality issues and take proactive measures to improve their processes and products.
Part4: Tips for Fishbone Diagrams to Uncover Core Issues
When creating cause-and-effect fishbone diagrams to uncover core issues, here are some additional tips to consider:
- Dig deeper into the problem statement: Make sure your problem statement is specific and clear. This will help you uncover the underlying core issues more effectively.
- Use a collaborative approach: Engage a diverse group of stakeholders or subject matter experts to brainstorm causes and potential core issues. Different perspectives can lead to a more comprehensive analysis.
- Consider the external environment: Explore external factors that may be contributing to the quality issue. This can include economic, social, or political influences that may have an impact on your organization or industry.
- Look for patterns and trends: Analyze the causes and their relationships on the fishbone diagram to identify patterns or trends. This can help you pinpoint the core issues that are most critical to address.
- Prioritize core issues: Once you have identified the core issues, prioritize them based on their significance and potential impact on the overall quality. This will guide your problem-solving efforts and ensure that resources are allocated effectively.
- Validate core issues: Validate the identified core issues through data analysis, customer feedback, or other reliable sources of information. This will provide evidence to support your analysis and ensure that you are addressing the right problems.
- Develop targeted solutions: Develop solutions or actions that specifically address the core issues. These solutions should be focused and tailored to effectively resolve the underlying problems.
- Monitor progress and adjust: Implement the solutions and regularly monitor their progress. Evaluate whether the core issues have been effectively resolved or if further adjustments are needed.

By following these additional tips, you can enhance your cause-and-effect fishbone diagram analysis and uncover the core issues that need to be addressed for improved quality.
In the pursuit of comprehensive analysis and effective problem-solving, uncovering core issues stands as a pivotal step, in guiding organizations toward sustainable solutions. Boardmix, with its commitment to optimizing process visualization, presents an ideal platform for harnessing the power of Fishbone Diagrams. The integration of these diagrams into the Boardmix toolkit enhances the depth and precision of analyses, providing a holistic understanding of the factors influencing a given scenario. Embrace the potential within Boardmix, and let the visual prowess of Fishbone Diagrams guide your journey towards unparalleled insights and sustainable problem resolution.
Join Boardmix to collaborate with your team.

AI Writing Generator: Double Your Writing Efficiency With One Click!

What is Gap Analysis: Identifying Business Discrepancies

Genogram Template Free: Simplify the Process of Creating Your Family Tree

How it works
For Business
Join Mind Tools
Video • 2 min read
Solving Problems With Cause and Effect Analysis
How to use cause and effect diagrams.
By the Mind Tools Content Team
Cause and Effect Analysis is a technique that helps you identify all the likely causes of a problem. This means that you can find and fix the main cause, first time around, without the problem running on and on.
The diagrams you create with this type of analysis are sometimes known as fishbone diagrams, because they look like the skeleton of a fish. The technique was developed by Professor Ishikawa in the 1960s.
To solve a problem with this technique, write down your problem in a box on the left-hand side of a piece of paper. Then draw a straight line from the box to the other side of the paper.
Once you've written down the problem, draw several lines that extend out from your long horizontal line. You're now going to brainstorm all of the factors that could be contributing to this problem. These may be systems, equipment, materials, external forces, people involved with the problem, and so on.
In this example, which looks at the issue of high staff turnover, the possible factors are management, the working environment, training and development, the corporate culture, and pay.
When you've brainstormed possible factors, draw several horizontal lines that extend outward from each one. You're now going to brainstorm possible causes of the problem, related each factor.
In this example, possible causes could be that managers micromanage their teams. They may not spend enough time on site. Or, they may not provide team members with the guidance they need to do their jobs effectively.
You repeat this for each of the factors that you identified in the last step, until you've identified all possible causes of the problem. From here, you can review all of these to identify the most likely cause.
Now, read the article that accompanies this video to learn more about Cause and Effect Analysis.
You've accessed 1 of your 2 free resources.
Get unlimited access
Discover more content
Cause and effect analysis.
Identifying the Likely Causes of Problems
Problem Solving
How to solve problems using the Cause and Effect Analysis technique
Add comment
Comments (0)
Be the first to comment!
Sign-up to our newsletter
Subscribing to the Mind Tools newsletter will keep you up-to-date with our latest updates and newest resources.
Subscribe now
Business Skills
Personal Development
Leadership and Management
Member Extras
Most Popular
Latest Updates

Pain Points Podcast - Presentations Pt 2

NEW! Pain Points - How Do I Decide?
Mind Tools Store
About Mind Tools Content
Discover something new today
Finding the Best Mix in Training Methods
Using Mediation To Resolve Conflict
Resolving conflicts peacefully with mediation
How Emotionally Intelligent Are You?
Boosting Your People Skills
Self-Assessment
What's Your Leadership Style?
Learn About the Strengths and Weaknesses of the Way You Like to Lead
Recommended for you
Perfecting your pitch: how to succeed in business and in life by finding words that work.
Ronald M. Shapiro
Book Insights
Business Operations and Process Management
Strategy Tools
Customer Service
Business Ethics and Values
Handling Information and Data
Project Management
Knowledge Management
Self-Development and Goal Setting
Time Management
Presentation Skills
Learning Skills
Career Skills
Communication Skills
Negotiation, Persuasion and Influence
Working With Others
Difficult Conversations
Creativity Tools
Self-Management
Work-Life Balance
Stress Management and Wellbeing
Coaching and Mentoring
Change Management
Team Management
Managing Conflict
Delegation and Empowerment
Performance Management
Leadership Skills
Developing Your Team
Talent Management
Decision Making
Member Podcast
Fishbone Diagram Essay

Show More Often when in teams using the fishbone diagram is a great solution for identifying and analyzing problems. The fishbone diagram is very helpful because it allows you to visually display multiple problems and effects that lie in a company for example materials,Assessment,People,method,Equipment, and environments. Using this diagram we can start with a simple question to the right of diagram for an example such as what process are hindering us from producing more products? Why are we having orders mixed in different containers? How can we cut down cycle times and eliminate waste in the Tan/Fan cell to increase quality and productivity? A lot of question and suggestions will be made while gathering information but it 's important that the team gathers up all factors that have influenced the problem on each topic so that these issues get corrected in a timely manner. …show more content… At this time your team should feel an urge to create various plans on manufacturing process and flows to improve the situation. When working in manufacturing setting management can be very overwhelming when products are not out in time which leads to working massive amounts of overtime until completed. As an employee of smith and nephew, I understand the magnitude of change and wanting to improve quality and lean manufacturing . After gathering important data and several staff meetings the team from nails department has cleaned up some issue in certain areas in the cell and machine capabilities so that we can meet the demands of our customers. To keep in mind it 's our duty to keep smith and nephew quality and attitude characteristics so that we can keep striving for new customers and better
Related Documents
Interpersonal communication skills of feedback as a business analyst.
Feedback can also be used to discus with others solutions and seek their input before going to senior management when coming to a final solution (Overton 2007). 4.0 Questioning 4.1 Explanation and Demonstration of Effective…
Hrm 531 Week 9 Final Paper
Currently the sales department is call based for receiving customer orders. Orders are then placed through calling each different manufacturer. The receiving department is manual based to check and group all the items. The shipping department is manual based to send the items with the customer.…
EGT1 Task 1
The team has discovered right away, that it will take a superb level of communication throughout the facility in order to be successful and accomplish the goal. Business analytics can be very complicated to an organization if the communication is not well. Business analytics is only a portion of the overall process, it takes constant communication to be successful Killekar, Shah, & Kolge, (2013). In order to ensure that everyone is on the same page, we will use a local business to assist with some coaching that will help with the communication piece. The plan is to organize groups about sixteen in size to work on communication.…
Nt1310 Unit 1 Assignment 1.1
Develop Possibilities: In this phase we create the solutions. We need to ensure that we find a perfect solution this problem. A group discussion is best solution for developing possibilities. A good range of ideas plays role to commit it. 5).Select the best…
Cracker Barrell Old Country Store Inc.: Case Study
The cmpany that I currently work for is Cracker Barrell Old Country Store INC. As the lead TOGO server I am responsible for implementing changes to the TOGO processes as well as training all new TOGO hires and furthered training of current employees on any new processes or changes that are implemented. The change that will be taking place in the near future is a new TOGO and catering process, which includes many changes to the current process as well as the addition of new steps, services and menu choices to the process. The change goal is the new TOGO procedures and Catering introduction being implemented effectively. The purpose of the change and introduction of the new process is to increase the amount of TOGO order volumes, increase simplicity…
Write An Essay On The Three Spineed Stickleback Fish
The three-spined stickleback fish is a well known fish to Alaskans it has two pointy spikes on its back and it is a yellowish brown color. It is located in the Pacific Ocean and some salt water lakes near Alaska. The first recorded spotting of the stickleback was in 1964. The rates of fish being caught near Alaska have been recorded for many years and the rate of stickleback caught in the 1990's is double what is being caught now. Mating occurs in early spring and summer for these fish and it starts with the male building a hollow nest with seaweeds or aquatic plants.…
Fishbowl Research Paper
Such beautiful and majestic sea animal should not be trapped inside of a fishbowl for human entertainment. Initially the orcas are ripped away from their families destroying any social kills acquired in their natural habitat. Accordingly, the orcas suffer from loneliness which causes them to become aggressive and even threating the lives of many trainers. On the other hand, some of the orcas even grind at the iron bars with their teeth’s wanting to escape resulting them painful dental damage. Most of the time the dental damage is so critical that they must go under extremely harsh dental drilling without no anesthesia.…
Tsc Stores Case Study
TSC Stores, Supply Chain Management for Profitable Growth Brad is currently in a process of creating a long term supply chain strategy that will support the company’s corporate growth, cost objective and also the program of the Project 275. However, the rapidly growing volumes and complexities in the supply chain are causing concerns, and Brad is worried that the company may not be able to handle the planned growth. In addition to that the company is faced with several other challenges that threaten its plans, namely, stock-outs in stores and DC, low service level, too much inventory in enterprise, slow inventory turnover, and tied up working capital. 1. What does your analysis of the data in Exhibit 3 suggest that Brad Twiddy might want…
Costco Capital Structure
Capital Structure Debt and equity are the principal components of a company’s long term capital and capital structure describes this composition (combination of debt and equity) of the company’s permanent/long term capital. Capital structure is an indicator of how a firm finances its overall operations and growth using the different sources of funds available. It is a mix of long-term debt, short-term debt, common equity and preferred equity. Debt is in the form of bond issues or long-term notes payable while equity can be common stock, preferred stock or retained earnings. The proportion of short and long term debt is considered while analyzing the capital structure.…
Improving Team Decision Making
The decisions our team made affected how our team placed in comparison to the other teams in the class. The first day the that simulation began, our team payed close attention to what Dr. Clough was doing and speculated about what his purchases must have been to get his results. This may not have been the most effective way to purchase machines because there was no way to know when his next purchase was going to be. The decisions made were mostly qualitative, and based on prior assumptions. To make decisions easier on the entire group, we decided early on that if a purchase was to be made, consult the group and come to a majority vote.…
Case Study: Improving The Scanlon Plan At Engstrom
Question 3 A. The first factor that is internal to the organization: Haley had told Ron that we both know the employees have been complaining for months, but yesterday and today the talk has been pretty hostile. He wasn’t saying that there is a definite connection between nearly late delivery and the grumbling I heard, but you've got to wonder. Product-quality issues had also been creeping into the work done at Engstrom.…
Within our organisation we write down using bullet points in order, what we are going to do and once we have finished each step we cross it off so we can focus on the next step. 2.2 Describe different ways of solving business problems In a business environment, there are many different types of problems that you end up faced with and each problem has its own method to solve it. For each problem to be solved you need to come up with targets, strategies, resources, communication, decisions and commands.…
Fish Cheeks Character Analysis
Character Trait Essay “Most bade and unusual behavior comes from insecurity” (Winger). Many people struggle with insecurities. In the stories “Fish Cheeks” and Identical, the two main characters, Raeanne and Amy, both struggle with insecurities in their own ways and handle them both differently. First of all, Raeanne the novel Identical; is a girl who is emotionally abused by her parents and struggles with many insecurities.…
Walmart Case Study Pros And Cons
• Few of the trends in plant layouts are as follows: • Cellular layouts within a larger process layout. • Usage of automated material handling equipment, espec8ially automated storage and retrieval systems, automated guided vehicle systems, automatic transfer devices and turntables. • ‘U’ shaped production lines (refer figure 2.2.6) that allow workers to see the entire product line and easily travel between workstations. Moreover, it allows the rotation if workers among the workstations along the lines to relieve boredom and relieve work imbalances between workstations.…
Fatima Fertilizer Case Study
FATIMA FERTILIZERS Prof. F.A. Fareedy MBA II SEC B 29th July, 2015 Presented by: Babar Zahoor Ul Hasan Saman Iqbal Contents Introduction: 2 Policy Statement of Ethics and Business Practices 3 Products & Services 4 Industrial Solutions 5 Farmer Support & Education 5 ORGANIZATIONAL STRUCTURE 6 Competitors: 7 Fauji fertilizer 7 Engro Fertilizers Limited:- 9 Financial ratios 11 Models 28 SWOT ANALYSIS 30 IFAS 35 EFAS 36 SFAS 37 New strategy 38 New proposed Vision Statement 40 New mission statement 40 Recommendations 41 Conclusion 42 Executive summary Fatima fertilizer has done well over the past few years, it is currently number three in terms of market share, but is steadily rising and is said that it will soon beat engro fertilizer.…
Related Topics
- Manufacturing
- Lean manufacturing
- Ishikawa diagram
Ready To Get Started?
- Create Flashcards
- Mobile apps
- Cookie Settings
Quality and Safety Education for Nurses
Strategy submission, using a fishbone (rca) diagram to problem solve falls.
Lori Rodriguez
Associate Professor
Institution:
San Jose State University
Competency Categories:
Quality Improvement, Safety
Learner Level(s):
Pre-Licensure BSN, RN to BSN
Learner Setting(s):
Strategy Type:
Case Studies
Learning Objectives:
- Describe strategies for learning about the outcomes of care in the setting in which one is engaged in clinical practice
- Use tools (such as flow charts, cause-effect diagrams) to make processes of care explicit
- Participate appropriately in analyzing errors and designing system improvements
Strategy Overview:
- analyze a safety problem,
- work with a fishbone diagram,
- search out root causes,
- identify limits of doing an RCA with limited input,
- identify the importance and use of statistical data for making a case, and
- identify one strategy that would impact the incidence of falls in this unit.
There has been a sharp increase in the number of falls on your unit. Last year there were 2 in a 1 year period. This year there have been 3 over the last 3 months. During this same time period there were several staff transfers out of your unit and the positions have not been filled due to a hiring freeze. You are dealing with what could be called chronic understaffing, staff working double shifts, and low morale. The float personnel who are sent to your unit have not been implementing the existing fall risk assessment protocol when they admit a patient. A spot check of your charts show that 50% of the patients on your unit have not had a standard fall risk assessment done on admission. When you go to find the tool or form that is used for the assessment you can find no forms.
Next, you look at the facts involving an individual patient who fell on your unit. Mrs. Nguyen is an 85 year old non English speaking patient who was admitted because of a transient ischemic attack and to rule out a stroke. She was in for observation and diagnostic testing. She got up to go to the bathroom. Since it was 2 a.m. apparently all the lights were out in the room. She tripped over a wheelchair that had been used earlier in the day to take her to interventional radiology.
Using the attached fishbone diagram, fill in the problem statement and the causes that you identify. Be prepared to discuss one impactful intervention that you would like to make to address the problem.
Discussion Questions:
- What contributory causes did you identify?
- Where did you place on the fishbone diagram such things as lack of staff, overworked staff, lighting conditions, the absence of a bed alarm, not following basic safety practices, the absence of fall risk assessments being done, the absence of fall risk assessment forms, the lack of availability of basic safety equipment (i.e. a walker), etc.
- Can all of the causes that you identified be placed somewhere on the fishbone diagram?
- Can you add other bones to the fishbone?
- Does it matter if a cause is shown in more than one area?
- If you were going to do an in-service to bring the attention of the staff to this problem, what data and information would you use and how would you display it?
- Would it be helpful to analyze the other two recent cases on your unit where the patients fell. Why or why not?
- Choose one intervention that might make an impact immediately and one long term
- Ensuing discussion on how the evidence shows that the prevention of falls requires a multipronged attack and a falls prevention program.
Submitted Materials:
113.Fishbone-diagram-for-QSEN-submission-WORKSHEET.docx - https://drive.google.com/open?id=1n2JkfiPECmbp6oAtiFaSwpbE23mfGPmG&usp=drive_copy
Additional Materials:
Evaluation Description:
COMMENTS
A fishbone diagram is a problem-solving approach that uses a fish-shaped diagram to model possible root causes of problems and troubleshoot possible solutions. It is also called an Ishikawa diagram, after its creator, Kaoru Ishikawa, as well as a herringbone diagram or cause-and-effect diagram. Fishbone diagrams are often used in root cause ...
The Fishbone Diagram is a visual tool used in Lean Six Sigma to identify root causes of problems. It resembles a fish skeleton, with the main problem at the head and potential causes branching off the spine into categories, facilitating a systematic approach to problem-solving. Also commonly known as a Cause and Effect Diagram or an Ishikawa ...
Download. A fishbone diagram, also known as a "cause and effect" diagram is a problem solving technique used in project management. It has also been referred to as an Ishikawa diagram after a Japanese professor; Kaoru Ishikawa. Problems arising in projects usually have many causes and in some cases, these problems may be interrelated and ...
Fish bone structures, also known as Ishikawa diagrams or cause-and-effect diagrams, are a visual representation that helps identify and analyze the possible causes of a specific problem. The…
Also called: cause-and-effect diagram, Ishikawa diagram. This cause analysis tool is considered one of the seven basic quality tools. The fishbone diagram identifies many possible causes for an effect or problem. It can be used to structure a brainstorming session. It immediately sorts ideas into useful categories.
An example of the application of a fishbone diagram will be the typical 4S fishbone used in manufacturing. The 4S's represent - systems, surroundings, skills, and suppliers. Each 's' factor is accompanied by adjoint 'bones' which represent the issues in these attributes of the manufacturing process. Below is an example of a 4S ...
A fishbone diagram, also referred to as a cause and effect diagram or an Ishikawa diagram, is a helpful tool for identifying the root cause of a problem.It allows you to list all the potential causes that may be contributing to the effect you are currently experiencing. This visual aid takes the shape of a fishbone, hence its name, and is commonly used during brainstorming sessions.
In this video, we provide a fishbone diagram (aka Ishikawa diagram) tutorial.In the video we'll cover:- The key components of a fishbone.- A fishbone diagram...
Professor Kaoru Ishikawa created Cause and Effect Analysis in the 1960s. The technique uses a diagram-based approach for thinking through all of the possible causes of a problem. This helps you to carry out a thorough analysis of the situation. There are four steps to using the tool. Identify the problem. Work out the major factors involved.
A fishbone diagram is a visualization tool, developed by Dr. Kaoru Ishikawa, a quality control specialist, for identifying the root causes of a problem, categorizing them, and generating solutions. Also called the Ishikawa diagram, or cause and effect diagram, the fishbone analysis is often used in troubleshooting and product development ...
A fishbone diagram, also known as cause and effect diagrams, Ishikawa diagram and Herringbone diagram, is a visualization tool used to find the root cause of a problem. It helps you group all the potential causes of a problem in a structured way to find the ultimate cause of your problem. Kaoru Ishikawa invented this diagram in the 1960s to use ...
The Fishbone Diagram is a graphical tool used for identifying and organizing possible causes of a specific problem or outcome. The diagram resembles the skeletal structure of a fish, hence its name. ... With all potential causes visually represented in one place, it becomes easier to analyze and discuss the issues. 2. Team Collaboration:
Fishbone Diagram in Education Essay. For this brainstorming activity, I decided to apply a fishbone diagram to discuss possible solutions for the low reading performance of some students. The teachers involved in the process were participating in the discussion and sharing the ideas. The chosen approach helped them structure their thoughts ...
Fishbone (Ishakawa) Diagram. Each rib is for a separate cause contributing to the effect. Once the ribs have been completed with brief detail (which you can check as you go), the student can write a short introduction followed by a paragraph for each cause. The student has used the fishbone plan to write a tightly focused text on the causes of ...
The tool helps in identifying the potential causes that could have caused the problem. A sample fishbone diagram looks like this: It is called a fishbone as it looks like the skeleton of a fish. The head of the fish explains the problem statement (or the effect) and the bones attached explain the possible cause and sub-causes.
The cause-and-effect fishbone diagram, also known as the Ishikawa diagram, serves as a powerful tool in problem-solving and root-cause analysis. Uncovering core issues is at the heart of the Fishbone Diagram methodology. By meticulously examining the potential causes branching off the main spine, teams can delve deep into the complexities of a ...
The Fishbone Diagram offers a visual way to organize the problem's multiple causal chains. Each primary bone represents a causal chain. The primary cause is written in the box at the end of the bone, and subcauses are written underneath the secondary bones jutting from the primary bone. Follow the steps below to use this template.
The diagrams you create with this type of analysis are sometimes known as fishbone diagrams, because they look like the skeleton of a fish. The technique was developed by Professor Ishikawa in the 1960s. To solve a problem with this technique, write down your problem in a box on the left-hand side of a piece of paper. Then draw a straight line ...
Fishbone diagram (also called Ishikawa diagrams or cause-and-effect diagrams) is a graphical technique to show the several causes of a specific event or phenomenon.
Fishbone Diagram Essay. Often when in teams using the fishbone diagram is a great solution for identifying and analyzing problems. The fishbone diagram is very helpful because it allows you to visually display multiple problems and effects that lie in a company for example materials,Assessment,People,method,Equipment, and environments.
This strategy is a participative exercise that gets students to. analyze a safety problem, work with a fishbone diagram, search out root causes, identify limits of doing an RCA with limited input, identify the importance and use of statistical data for making a case, and. identify one strategy that would impact the incidence of falls in this unit.