- Free Teaching Resources
- Universities
- Public Colleges
- Private Colleges
- N6 Question Papers and Memorandums with Study Guides
- N5 Question Papers and Memorandums with Study Guides
- N4 Question Papers and Memorandums with Study Guides
- N3 Question Papers and Memorandums with Study Guides
- N2 Question Papers and Memorandums with Study Guides
- N1 Question Papers and Memorandums with Study Guides
- Latest Updates
- Learning Content


A Guide to Formulating a Hypothesis on Drought in Northern Cape for Geography Students
A Guide to Formulating a Hypothesis on Drought in Northern Cape for Geography Students:
A hypothesis is a suggested explanation for an observable phenomenon or a prediction about a relationship between variables. Here’s a step-by-step guide on how to develop a hypothesis for the drought situation in Northern Cape, South Africa.
Table of Contents
Formulating a Hypothesis on Drought in Northern Cape for Geography Grade 12 Students
Read: Background Information About Drought in Northern Cape, South Africa
Step 1: Understanding the Situation
Begin by understanding the context of the drought in Northern Cape. Research the background, including when the drought started, its impacts, and the measures being taken to address it. Use reliable sources to understand the situation better.
Step 2: Identify Your Variables
Variables are factors that can change in an experiment. In the context of your hypothesis, you might consider the following:
- Dependent Variable: The phenomenon you’re interested in, which in this case is the drought in Northern Cape.
- Independent Variables: Factors that might influence the drought, such as climate change, rainfall patterns, human activity, agricultural practices, etc.
Step 3: Formulate Your Hypothesis
A good hypothesis is clear, concise, and testable. It should suggest a relationship between the variables you’ve identified.
Here are a few examples of possible hypotheses:
- “Increasing temperatures due to climate change lead to an increase in the severity of drought conditions in the Northern Cape.”
- “Changes in rainfall patterns over the past decade have contributed to the prolonged drought in the Northern Cape.”
- “Unsustainable agricultural practices in the Northern Cape have exacerbated the effects of the drought.”
Step 4: Make Predictions
Predictions are more specific than hypotheses and are often written in an “If…then…” format. For instance, if your hypothesis is the first one from the examples above, a prediction might be: “If average temperatures continue to rise due to climate change, then the Northern Cape will experience more severe and longer-lasting droughts.”
Step 5: Test Your Hypothesis
You won’t actually carry out this step, but it’s important to think about how your hypothesis could be tested. This usually involves identifying what kind of data you would need and how you would collect and analyze it. For instance, if you are studying the impact of rainfall patterns on drought, you might need historical data on rainfall and drought severity in the Northern Cape.
Remember, a hypothesis doesn’t need to be correct—it’s a starting point for investigation. The purpose of formulating a hypothesis is to provide direction for your research. Whether your hypothesis is proven or disproven, you’ll still learn something valuable about the drought in Northern Cape.
10 Hypothesis examples for the drought in Northern Cape
Here are 10 hypothesis examples for the drought in Northern Cape along with the background for each.
- Hypothesis: Increased global warming has led to the prolonged drought in Northern Cape. Background: Global warming leads to rising temperatures, which can increase evaporation rates and change rainfall patterns, potentially leading to drought conditions.
- Hypothesis: Decreased annual rainfall over the past decade has directly contributed to the drought in the Northern Cape. Background: Rainfall is a key factor in replenishing water supplies. A decrease in rainfall over an extended period can lead to drought conditions.
- Hypothesis: Overexploitation of groundwater resources for agriculture has exacerbated the drought in the Northern Cape. Background: Overuse of groundwater for irrigation can lead to water scarcity, particularly during periods of low rainfall.
- Hypothesis: Unsustainable farming practices have worsened the effects of the drought in the Northern Cape. Background: Practices such as overgrazing and poor soil management can degrade land and reduce its capacity to retain water, worsening drought conditions.
- Hypothesis: A lack of drought-resistant crops has intensified the agricultural impact of the drought in the Northern Cape. Background: Drought-resistant crops can help mitigate the impact of drought on agricultural output. A lack of these crops could intensify the effects of drought.
- Hypothesis: The destruction of native vegetation for agriculture has increased the severity of the drought in the Northern Cape. Background: Native vegetation can help maintain soil moisture and regulate the local climate. Its removal can disrupt these processes and potentially contribute to drought conditions.
- Hypothesis: Poor water management policies have worsened the drought in the Northern Cape. Background: Effective water management policies are crucial for ensuring water availability during dry periods. Poor policies could exacerbate drought conditions.
- Hypothesis: The migration of young people from rural areas due to the drought is leading to a decline in agricultural productivity in the Northern Cape. Background: Drought can lead to rural depopulation as people move to urban areas in search of work, potentially reducing agricultural productivity and worsening the effects of drought.
- Hypothesis: The frequent occurrence of El Niño events has led to the prolonged drought in the Northern Cape. Background: El Niño events can disrupt normal weather patterns, potentially leading to periods of low rainfall and drought conditions.
- Hypothesis: The lack of infrastructure to harness and store rainwater during periods of higher rainfall has contributed to the drought in the Northern Cape. Background: Infrastructure such as dams and reservoirs can help store water during periods of high rainfall for use during dry periods. A lack of such infrastructure could contribute to drought conditions.
Need Help with your School Project?
Are you struggling with your Project? Well, we can help you in terms of answering the questions and learning the key objectives of the topics. Please upload the pdf document of the Project and we will ensure we help you with the answering guide so that you pass it with distinctions.

Do you Need Help Regarding Your Studies/ Assignments?
You can ask any question from your subject for any Grade, including Tertiary Levels. We will do our best to ensure that you get a more relevant answer:
Did You See These?
Radiography studies High School Requirements in SA
ACT Cape Town Courses and Programmes 2024/2025 (Prospectus)
Discussing Why Unequal Access to Basic Services Could Give Rise to Social Injustices
Guide: Writing a Conclusion for an Essay on “Why the Bantu Education Act Is Interesting or Important to Know About Today”
Why I Admire Nelson Mandela Essay Guide and Example
How can the Notion of Ubuntu be Incorporated in Classroom Practice
All Conveyancing Exam Question Papers and Memorandums: South Africa
UKZN Masters Application Guide
- Share This Post:
Reset Password
Quantitative Analysis of Drought Management Strategies across Ethnographically-Researched African Societies: A Pilot Study
Land • vol/iss. 10(1062) • multidisciplinary digital publishing institute • basel, switzerland • published in 2021 • pages: 1-15 • cite, by biagetti, stefano , zurro, débora , alcaina-mateos, jonas , bortolini, eugenio , madella, marco.
Environmental conditions will be associated with the distribution of drought-coping strategies.
Environmental conditions are measured using aridity index. R-squared=0.11, adjusted R-squared=0.05. Hypothesis was also analyzed using canonical correspondence analysis.
Related Hypotheses
Advertisement
Drought in the Eastern Cape region of South Africa and trends in rainfall characteristics
- Published: 14 August 2020
- Volume 55 , pages 2743–2759, ( 2020 )
Cite this article

- P. T. Mahlalela 1 ,
- R. C. Blamey 1 ,
- N. C. G. Hart 2 &
- C. J. C. Reason ORCID: orcid.org/0000-0002-3224-5243 1
101k Accesses
62 Citations
124 Altmetric
19 Mentions
Explore all metrics
Much of the Eastern Cape province in South Africa has been experiencing a severe drought since 2015. This drought has had major socio-economic effects particularly on the large impoverished rural population as well as on some urban areas where supplied water services have broken down in several cases. The region is influenced by both midlatitude and tropical systems leading to a complex regional meteorology that hitherto has not been much studied compared to other parts of South Africa. Here, the ongoing drought is examined in the context of long-term trends and the interannual rainfall variability of the region. Although the region has experienced drought in all seasons since 2015, focus here is placed on the spring (September–November) which shows the most consistent and robust signal. On average, this season contributes between about 25–35% of the annual rainfall total. Based on CHIRPS data, it is found that this season shows a significant decreasing trend in both rainfall totals as well as the number of rainfall days (but not heavy rainfall days) for spring over most of the province since 1981. On interannual time scales, the results indicate that dry (wet) springs over the Eastern Cape are associated with a cyclonic (anticyclonic) anomaly southeast of South Africa as part of a shift in the zonal wavenumber 3 pattern in the midlatitudes. Over the landmass, a stronger (weaker) Botswana High is also apparent with increased (decreased) subsidence over and near the Eastern Cape which is less (more) favourable for cloud band development and hence reduced (enhanced) rainfall during dry (wet) springs. Analysis of mid-century (2040–2060) CMIP5 rainfall projections suggests that there may be a flattening of the annual cycle over the Eastern Cape with the winter becoming wetter and the summer drier. For the spring season of interest here, the multi-model projections also indicate drying but less pronounced than that projected for the summer.
Extreme rainfall events in southeastern Africa during the summer
Drivers and physical processes of drought events over the State of São Paulo, Brazil

Signatures of midsummer droughts over Central America and Mexico
Avoid common mistakes on your manuscript.
1 Introduction
South Africa is facing severe pressure with respect to water security due to an increased water demand with increasing population, poor planning and management of water resources, limited investment into water reservoir infrastructure, and recurring droughts over the past decade. Although droughts often happen in South Africa, in recent decades there has been a tendency for more multi-year droughts to occur. For example, summer rainfall time series for various parts of South Africa, including the Eastern Cape and adjoining KwaZulu Natal Province show more multi-year droughts during late 1970s to 2017 than during 1950-late 1970s (Fig. 5 of Blamey et al. 2018a ). In February 2018, the Western Cape Province was declared a disaster area after a severe drought which occurred between 2015 and 2018 (Pienaar and Boonzaaier 2018 ; Sousa et al. 2018 ; Mahlalela et al. 2019 ; Burls et al. 2019 ). In October 2019, the Eastern Cape Province (see Fig. 1 for its location in South Africa) was declared a drought disaster region following pronounced water shortages in many urban and rural areas.

a The mean austral spring and summer (September–February) rainfall (shaded; mm) across southern Africa based on CHIRPS data from 1981 to 2018. b A zoomed in version of the mean spring and summer rainfall for the southeast region of the domain. The green polygon in both panels illustrates the location of the Eastern Cape Province in South Africa. Also shown in panel b are the locations of the South African Weather Service rain-gauges used in the study
The Eastern Cape is of interest not just because of the severe drought that it is currently experiencing but also because its western parts lie near the transition zone between the summer (most of southern Africa) and winter rainfall regions (southwestern South Africa, Reason et al. 2002 ; Blamey et al. 2018b ) and because it is a region of sharp vegetation, soil moisture and topographic gradients (Fig. 2 a). As a result, the meteorology here is complex and often involves interactions with the regional topography or the neighbouring warm Agulhas Current (e.g., Rouault et al. 2002 ; Singleton and Reason 2006 ). It was argued by Jury et al. ( 1993 ) that the distance from the Eastern Cape coast to the core of this current which is of order a few 10 s of kms north of 33° S but of order 100 km by the time the current reaches 34° S, may play a role in the strong decrease in mean rainfall along the Eastern Cape coast (see Fig. 1 b). The coast near Port Elizabeth at 34° S is relatively dry as is the western interior which forms part of the Karoo semidesert of the central-western inland regions of South Africa. The western coast of the Eastern Cape merges into the small all-season rainfall region that extends along the south coast of South Africa between about 22–25° E (Weldon and Reason 2014 ; Engelbrecht et al. 2015 ). From about East London (~ 28° E, 33° S) northwards, the coastal regions are much wetter as are the northeastern inland regions of the Eastern Cape near the Drakensberg and Maluti mountains (Lesotho). Figure 1 shows the rainfall gradients and totals across the Eastern Cape during the spring and summer in relation to those that exist across the rest of southern Africa (summer rainfall dominated everywhere except for western South Africa and the south coast of South Africa) .
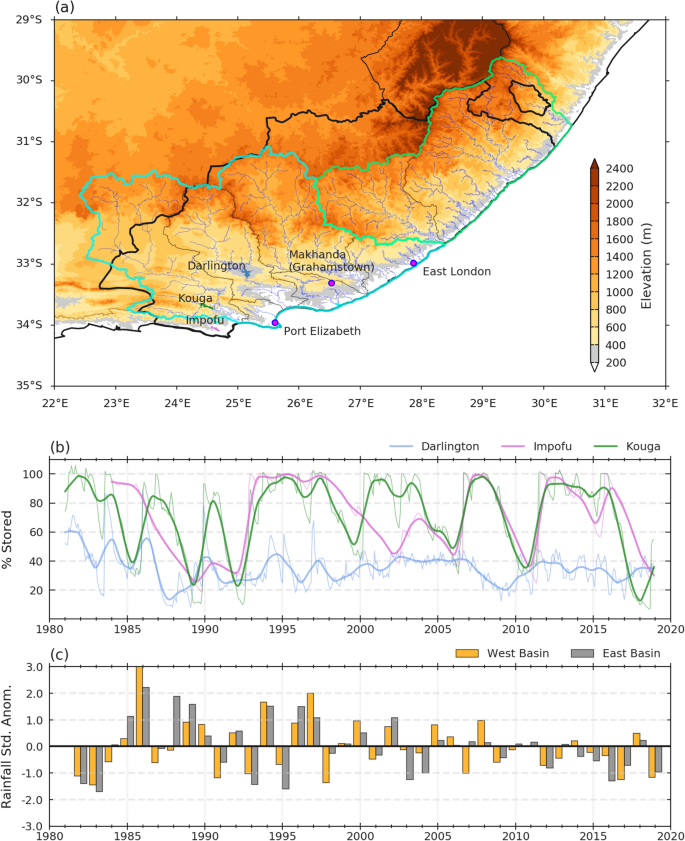
Panel a illustrates the topography (shaded; m) of the domain along with the various rivers and river basins. The river basins have been merged into a “west” and “east” basin to highlight some of the regional rainfall differences. Also shown are the locations of the main dams of the region that have seen large water level drops as well as locations of the main towns/cities. Panel b shows the smoothed monthly dam levels (given in % stored) from around 1981 until 2018, while panel c shows the austral summer rainfall standardized anomalies, based on CHIRPS, for the regions defined as west and east basin in panel a
Precipitation over the Eastern Cape region is influenced by weather systems from both the tropics and midlatitudes, ranging from small-scale convective storms to synoptic-scale tropical-extratropical cloud bands (known locally as tropical-temperate troughs—TTTs). These cloud bands are the major synoptic rainfall producing system over subtropical southern Africa during the early to mid-summer (Harrison 1984 ; Diab et al. 1991 ; Todd and Washington 1999 ; Hart et al. 2010 ; Manhique et al. 2011 ). Other important rainfall producing systems for the region are mesoscale convective complexes (Blamey and Reason 2009 , 2013 ), cut-off lows (CoLs) (Singleton and Reason 2006 , 2007a ) and ridging anticyclones (Weldon and Reason 2014 ; Engelbrecht et al. 2015 ; Engelbrecht and Landman 2016 ).
Also shown in Fig. 2 a are the catchment areas of the main dams supplying the province’s largest municipality (Nelson Mandela Bay) which contains the major coastal city of Port Elizabeth (located near 34° S) (termed the “west” basin) as well as those for rivers draining the wetter northeastern part of the province (termed the “east” basin). The impact of the current drought can be seen in the levels (Fig. 2 b) of two of the larger supply dams (Impofu and Kouga). After being close to full in 2015, both dams have fallen to their lowest levels since 1985 with the decline during 2017–2019 being especially sharp. As of June 2020, the Kouga dam sits at 7% with the combined supply dam capacity for the Nelson Mandela Bay metro having fallen below 20%. Several other major towns in the province (Grahamstown, Graaff-Reinet, Bedford and Queenstown) have also been experiencing very severe water shortages. The ongoing drought has already cost the province over R120 million for drought relief measures. Due to the increased threat to water security in the Eastern Cape and more broadly, South Africa as whole, understanding the variability and trends in rainfall features that influence water availability over this region is of crucial importance for effective management and planning. Furthermore, relatively little work has been done on the climate of the Eastern Cape region compared to other parts of South Africa despite it being an important agricultural part of the country with a sizeable rural population. The region is also one of the least developed of South Africa’s nine provinces with many impoverished rural settlements which are particularly vulnerable to drought and severe weather events. It has also been impacted severely by the COVID-19 crisis with almost 20% of South Africa’s total of ~ 400,000 cases by late July 2020 as compared to having less than 12% of the national population.
Here, focus is placed on the spring season (September–November SON) which seems to show the strongest and most consistent drought signal since 2015. As discussed below, SON contributes between 25 and 35% of the annual rainfall over the Eastern Cape on average. Furthermore, given its importance for agriculture (fruit, dairy and angora goats are the main exports), severe drought is highly problematic at this time of year when solar insolation, ground temperatures and potential evapotranspiration are also increasing. Thus, the aims of the study are to investigate the post-2015 drought within the context of previous large anomalies in spring rainfall over the last forty years and any long-term rainfall change and to examine the potential mechanisms associated with spring drought in the region.
2 Data and methods
Daily rainfall data over the Eastern Cape were provided by the South African Weather Service (SAWS) for January 1981–December 2018 for comparison against daily gridded data (CHIRPS). Only stations with 90% data available for the full period were included in the analysis, and for which the station location has stayed more or less the same. The locations of 11 weather stations used in this study are shown in Fig. 1 b. Due to the restricted spatial coverage of the available SAWS rain gauges, Climate Hazards Infrared Precipitation with Stations (CHIRPS) daily data were used to consider spatial variability of rainfall variability and trends across the Eastern Cape. CHIRPS is a merge of different products including satellite imagery and station values available at 0.05° (5 km) spatial resolution on a quasi-global (50° S–50° N) grid, for the period 1980 to present (Funk et al. 2015 ). A correlation analysis was done between CHIRPS and station data to assess confidence in the ability of CHIRPS to represent the region.
Daily rainfall data were converted to seasonal totals with Fig. 3 showing the seasonal rainfall climatology across the Eastern Cape. It is clear that spring (SON) and summer (DJF) contribute most of the annual rainfall on average for the bulk of the province. For the coastal zone, spring and summer each contribute about 30% of the annual total whereas summer dominates in the northern interior (40–45%). The autumn accounts for about 20–25% over most of the province with a small region in the far west reaching 30% whereas for winter, only in the far south, does rainfall in this season reach 15% of the annual total on average. Here, focus is placed on SON which seems to show the strongest and most coherent drought signal. However, the extended summer (September–April) is also considered when determining anomalously wet and dry seasons for composite analysis of the interannual variability in the seasonal rainfall totals. These anomalously wet (dry) SON seasons were chosen such that they occur in the same year as the overall (SONDJFMA) summer being wet (dry).
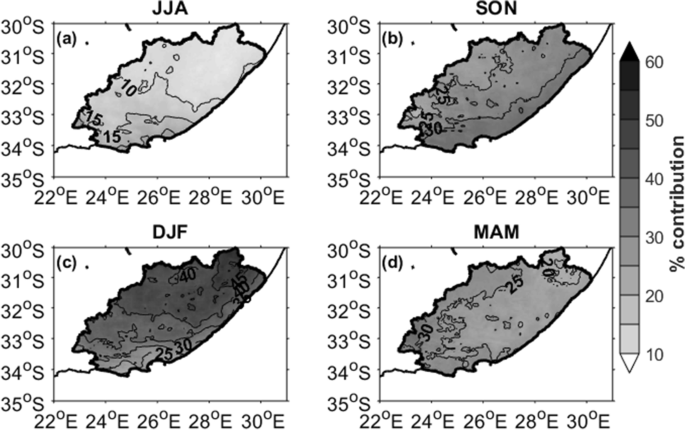
The mean seasonal rainfall contribution (shaded with contours; in percentage) to the annual rainfall total for a winter—JJA, b spring—SON, c summer—DJF and d autumn—MAM
Compositing of fields from the NCEP-DOE II reanalysis data (Kanamitsu et al. 2002 ), at a spatial resolution of 2.5°, are used to examine the circulation anomalies associated with anomalously dry and wet seasons during the study period. Moisture fluxes were computed from the product of the horizontal wind and the specific humidity at the level of interest. NCEP II reanalyses are also used to plot features of semi-permanent anticyclones in the Indian and Atlantic Oceans. For the purpose of this study, the northern, southern, eastern and western extension of the anticyclones is determined as the outer boundary of the 1020 hPa contour in the mean sea level pressure field (MSLP). This contour level is chosen as it is easily identified as closed contour level around the anticyclones, which is not intersected with the neighbouring land masses in either the early or late summer periods. The latitude and longitude of the centre of the South Indian Ocean High is defined here as the location with the maximum in the MSLP field (after applying a spatial smoothing filter) within the climatological mean area (40°–110° E; 15°–40° S).
Trends in various seasonal rainfall characteristics such as the number of rainy days (daily rain > 1 mm) and heavy rainfall days (daily rain > 10 mm) were evaluated using a non-parametric Mann–Kendall test over the analysis period 1981–2018. This test was used as it makes no assumption about the data distribution and is insensitive to outliers. The magnitude of the trend is calculated using the Sen’s slope estimator. This method uses the median of all possible slopes for the given series making it statistically robust. The probability of the trend occurring was measured at a 5% significance level.
To see whether some insight may be obtained about future rainfall scenarios, a topic of great interest to both the public and the government, future rainfall projections in the region are considered using 36 models from the Coupled Model Intercomparison Project Phase 5 (CMIP5) ensemble (Taylor et al. 2012 ). A 21 year mid-twenty-first century future period (2040–2060), under the high energy intensive scenario, Representative Concentration Pathway (RCP) 8.5, was chosen. Only one ensemble member (r1i1p1) per model is included in the analysis. For ease of comparison, precipitation (atmosphere variables) in the models are re-gridded using bilinear interpolation to a common 1.5° × 1.5° (2.5° × 2.5°) grid. Rainfall from the models is compared with satellite-based estimates from the Global Precipitation Climatology Project (GPCP) monthly precipitation data set (Adler et al. 2003 ) and Climate Prediction Center Merged Analysis of Precipitation (CMAP) (Xie and Arkin 1997 ).
3 Spring rainfall variability
3.1 rainfall means and trends.
Figure 4 plots standardized anomalies of SON rainfall for the period 1981–2018 for the 11 available SAWS stations together with CHIRPS data averaged from the 4 grid points surrounding each station (small red boxes in Fig. 1 b). Note that the annual cycle from the two datasets is the same for each case (not shown). The time series are correlated at 95% significance at each station with r values ranging from 0.61 to 0.90. Note that it is possible that topographic effects or other local forcing may lead to the differences between the time series. Although the sign of the anomalies is almost always the same for each station, there are some springs when there are sizeable differences in magnitude at some stations. However, the correspondence between the two time series during the almost 40 year period at both coastal and inland stations provides sufficient confidence in the ability of the CHIRPS data to adequately represent rainfall variability and change across the province. All of the stations except the two western near-coastal locations (Joubertina and Humewood) show a decreasing tendency in spring rainfall but only the negative trends at Dohne and Philadelphia are statistically significant.
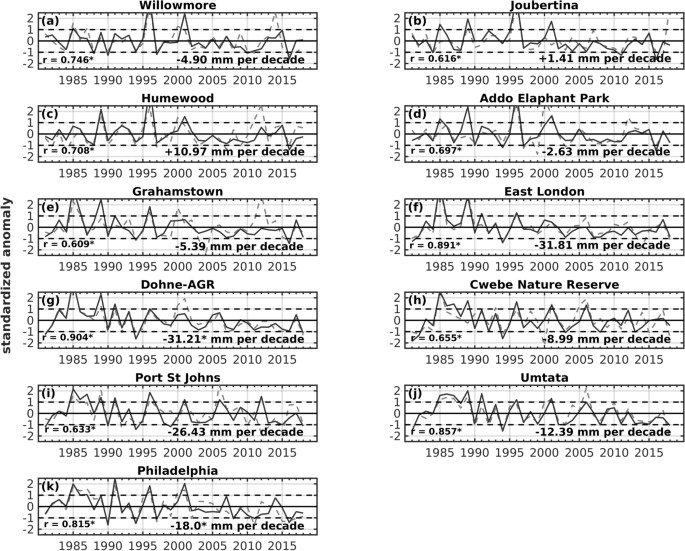
Spring (SON) standardised anomalies for the eleven stations (grey-dashed line) across Eastern Cape (see Fig. 1 b) and the corresponding CHIRPS (black-solid line) anomalies. The station names are indicated at the top of each panel. The correlation between the two datasets is given at the bottom left of each panel. The trend in SON rainfall for each station is given the bottom right hand corner of the panel (in mm per decade). For both the correlation and the trend analyses, the asterisk denotes significance at the 95% level using a Student t-test
Figure 5 shows the mean SON rainfall over the region from CHIRPS data along with that of the available stations (panel a) together with their trend over the 1981–2018 period (panel b). Most of the region shows a statistically significant decline in spring rainfall, particularly in the east, north and northeast. The weak decrease near Port Elizabeth is not significant but part of the catchment areas in the “west” basin to the north and northwest of this city are. Given that the decrease is much stronger in the wetter eastern half of the province, the results imply that the rainfall gradient across the province (Fig. 5 a) is weakening, at least in spring. The stronger decrease in the east is concerning given the larger rural population here and its greater importance for agriculture to the provincial economy (particularly dairy, pineapples and tea).

a The mean SON rainfall in CHIRPS (shaded; mm) and SAWS stations (circles; mm) and b the corresponding trend in SON rainfall over the period 1981–2018. Stippling or larger circles denotes values significant at a 95% level using a two-tailed Mann–Kendall test
Maps of the number of rain days (> 1 mm per day), heavy rain days (> 10 mm per day) and their trend across the province are plotted in Fig. 6 using CHIRPS data. A contrast exists between fewer (more) rain days in the west/southwest (northeast) consistent with rainfall totals being of order 50–150 mm in the former and 250–400 mm in the latter region (Figs. 5 a, 6 a). There is less of a contrast in the distribution of heavy rainfall days across the province with only the north coast showing a much greater frequency than the south (Fig. 6 c). In terms of trends (Fig. 6 b, d), the strongest negative trends are again in the north and northeast with that in rain days making a more obvious contribution to the rainfall total decreasing trends (Fig. 5 b) than that in heavy rain days. In the far west, it is notable that the area of significant decrease in both rain and heavy rain days represents part of the Kouga and Impofu dam catchment areas in the “west” basin that feed into the Port Elizabeth urban area.
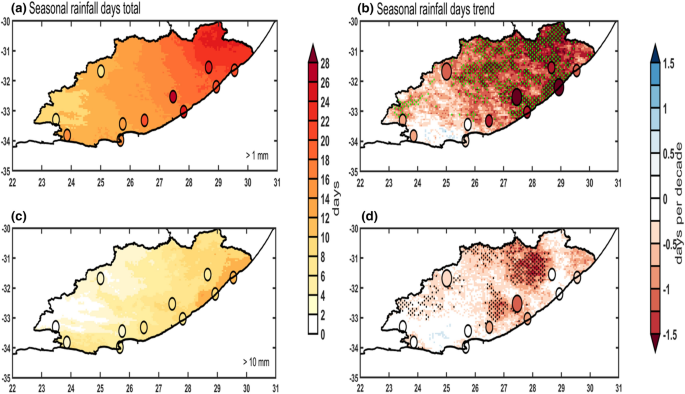
a The climatological number of rain days in SON (daily rain ≥ 1 mm) over the Eastern Cape Province and b the trend in the SON rain days (given as days per decade) in CHIRPS data and SAWS stations (circles) over the period 1981–2018. c , d , same as a , b but for rain days ≥ 10 mm. Stippling (green or black) or larger circles denotes values significant at a 95% level using a two-tailed Mann–Kendall test
In terms of the recent period, all stations (Fig. 4 ) show average to well below average rainfall during SON 2015 with several also showing that a sharp decline occurred in this season with little or no recovery during 2016–2018. Only Willowmore appears to show average rainfall by SON 2018 whereas the partial recovery at the other two westernmost stations (Humewood and Joubertina) in 2017 is then followed by more negative rainfall anomalies in 2018. Examination of GPCC data (not shown) indicates that most of South Africa including the entire Eastern Cape received below average rainfall in SON 2019. Although a run of several years of below average rainfall is not uncommon in spring (Fig. 4 ), or indeed in summer (Blamey et al. 2018a ), in the Eastern Cape, it is clear that most of the consecutive years of dry springs have occurred in the most recent decade whereas most of the well above average rainfall springs occurred between 1981–2005. This run of recent consecutive dry springs is consistent with the trend results (Figs. 5 , 6 ) and implies that the sharp decline at most stations since 2015, with little recovery in rainfall since, has led to the recent drought having more devastating impacts than would otherwise be the case due to depletion of surface and groundwater resources over a long period. Furthermore, spatial maps (not shown) of CHIRPS rainfall anomalies across the region for spring show that the last significantly wet season (spatially averaged standardised anomaly of 1.35) occurred in 2001 with only three of the springs between 2003 and 2018 showing positive anomalies (0.18 in 2006, 0.26 in 2007 and 0.09 in 2014). The remaining springs are all dry to very dry except for 2005 (− 0.01) with the recent springs of 2016 and 2018 showing anomalies of − 1.11 and − 0.84, respectively.
Based on springs that were followed by summers of the same signed anomaly, then the following seasons were respectively defined as significantly dry (1981, 1990, 1994, 2008, 2016) or wet (1985, 1989, 1993, 1996, 2001) (Table 1 ). Even with this stricter criterion of the extended summer “half” of the year (September–April) being anomalously dry or wet, it is evident that all of the latter occurred in the first two decades of the period. The dry seasons are more evenly spread out although 2 of the 5 occurred in the last decade. However, if the criterion about the subsequent summer is relaxed, then the wet springs remain the same but the dry seasons are slightly changed (1990, 1994, 2011, 2016, 2018) with now 3 of the 5 in the last decade. To examine potential mechanisms associated with these anomalous seasons, the next section considers composites of various circulation fields.
3.2 Interannual variability: potential mechanisms
To assess potential mechanisms associated with the interannual rainfall anomalies, composites of 500 hPa geopotential height and omega, 850 hPa moisture flux and divergence, and OLR are analysed for the spring seasons in Table 1 . Figure 7 shows that dry (wet) springs over the Eastern Cape are associated with a cyclonic (anticyclonic) anomaly to the southeast of South Africa which is part of a wavenumber 3 or 4 pattern in the Southern Hemisphere midlatitudes. Further north over Namibia, Botswana and Angola there are positive (negative) anomalies implying a stronger (weaker) mid-level Botswana High which has been previously associated with drier (wetter) conditions over subtropical southern Africa in late summer (Reason 2016 ; Driver and Reason 2017 ). The cyclonic (anticyclonic) anomaly southeast of South Africa is also evident at lower levels leading to an enhancement (reduction) in offshore dry flow (Fig. 8 b, c) relative to the 850 hPa climatological moisture flux (Fig. 8 a) in the dry (wet) springs. There is relative divergence (convergence) of this low-level moisture over the neighbouring Agulhas Current unfavourable for the strengthening (weakening) of rain-producing weather systems in the region such as ridging anticyclones, cold fronts and cloud bands. SST composites (not shown) indicate cool (warm) anomalies in the greater Agulhas Current region which have previously been associated with dry (wet) summers over eastern South Africa (e.g., Walker 1990 ; Mason 1995 ; Reason and Mulenga 1999 ; Reason 1999 ). The omega anomalies (Fig. 9 a, b) support this suggestion of changes in the strength of weather systems over the Eastern Cape with strong relative subsidence (uplift) over most of the Eastern Cape as well as much of South Africa and the ocean to the south of the country in the dry (wet) composite. The northwest-southeast orientation of the omega anomalies across western southern Africa suggests unfavourable (favourable) conditions for cloud band development during the dry (wet) springs. Using the met-bot cloud band tracking methodology developed by Hart et al ( 2012 ), it is found that there are indeed about 1–2 less (more) cloud band days than average during the dry (wet) springs over much of South Africa, including most of the Eastern Cape. Also evident in Fig. 8 b, c is a weakening (strengthening) of the Angola Low and relative offshore (onshore) moisture flow from the tropical South East Atlantic. A stronger Angola Low and this moisture inflow have been found to be important for both synoptic and seasonal scale wet spells in summer over South Africa and the reverse during dry conditions (Mulenga et al. 2003 ; Cook et al. 2004 ) since it often acts as the source region for cloud bands. Figure 10 shows the corresponding OLR composite anomalies again revealing a northwest–southeast orientation which is consistent with less (more) cloud bands/other convective systems and hence decreased (increased) rainfall over the Eastern Cape during the dry (wet) spring seasons.
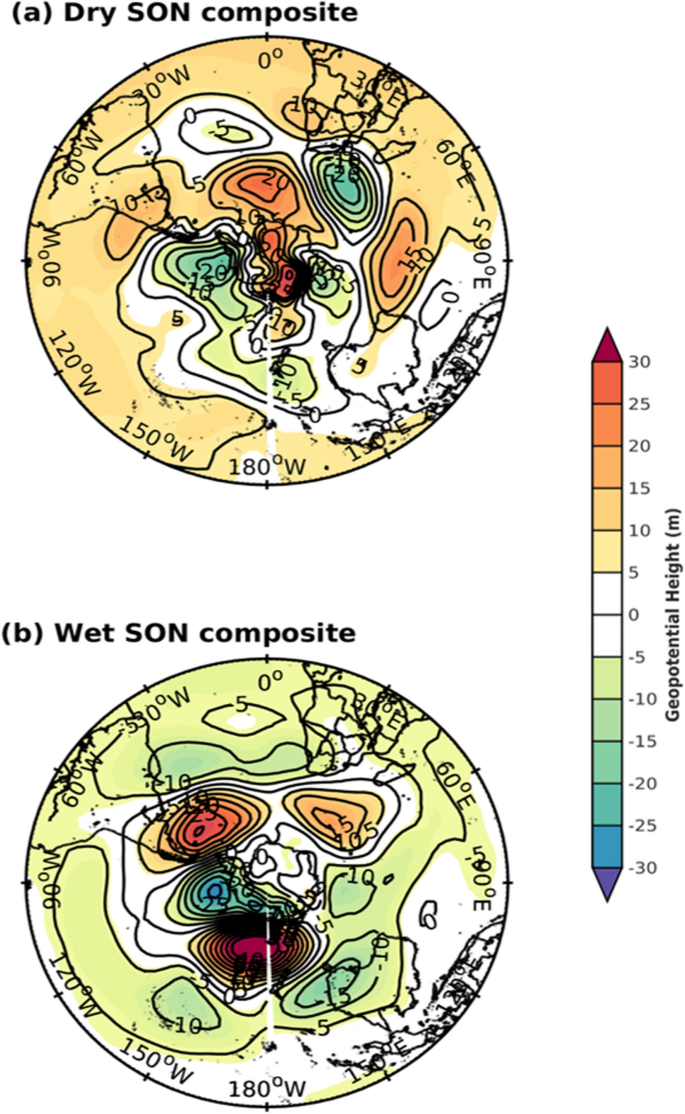
SON geopotential height composite anomaly (shaded with contours; m) at the 500 hPa level for a dry and b wet springs
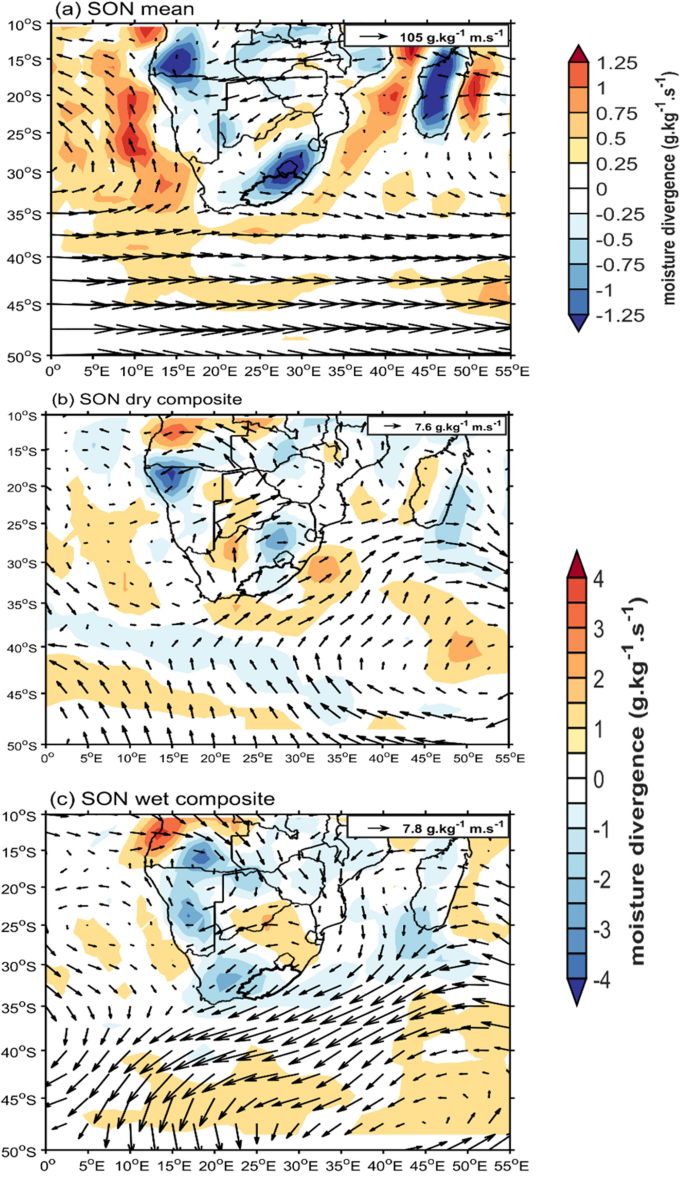
a The mean moisture flux divergence (shaded; g kg −1 s −1 × 10 –5 ) and moisture flux (scale vector shown) during SON at the 850 hPa level. Panels b , c show the composite anomalies for dry and wet springs respectively (shaded; g kg −1 s −1 × 10 –6 )
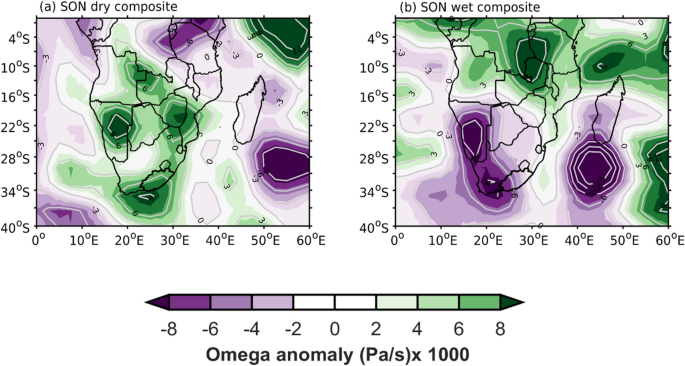
SON composite anomaly of omega (shaded with contours; Pa s −1 ) at the 500 hPa level for a dry and b wet springs
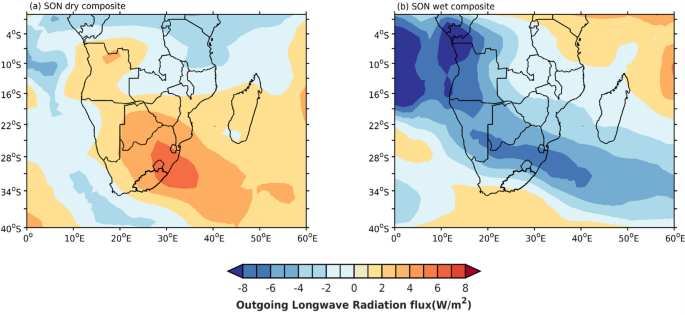
Composite anomaly of OLR (shaded; W/m −2 ) for a wet and b dry springs
It is unclear as to whether these circulation patterns for the anomalous springs are related to any of the large-scale climate modes that are known to directly affect rainfall over subtropical southern Africa. Indeed none of the hemispheric circulation anomalies in Fig. 7 are obviously reminiscent of these climate modes which are ENSO, the South Indian Ocean subtropical dipole (SIOD), the Benguela Niño, and the Southern Annular Mode (SAM). All of these have strong seasonality to their impacts on regional rainfall over subtropical southern Africa with the first two being important in mid-late summer (December–March) (Lindesay 1988 ; Mason 1995 ; Reason et al. 2000 ; Behera and Yamagata 2001 ; Reason 2001 ), the third in the late summer and typically more over Namibia and Angola than South Africa (Rouault et al. 2003 ; Hansingo and Reason 2009 ) while SAM impacts have been found in summer (Gillett et al. 2006 ) over much of the region and over western South Africa in winter (Reason and Rouault 2005 ). Indeed, correlations of Niño 3.4, the Benguela Niño, the SIOD index (Behera and Yamagata 2001 ) or the SAM index (Marshall 2003 ) do not show any significant or coherent signal over the Eastern Cape in spring. Correlations of the spring Eastern Cape rainfall with the Indian Ocean Dipole (DMI) (Saji et al. 1999 ) which manifests in spring (and is strongly correlated with equatorial East African rainfall) show a negative correlation over the Eastern Cape but it is not statistically significant. For summer, only the SAM index shows a coherent and statistically significant correlation (positive in sense) over the Eastern Cape region (not shown). This lack of consistency of climate signals in not just spring but also in summer (except for SAM) further adds to the challenge of trying to understand the climate variability of this complex region. Because the Eastern Cape includes the transition zone between the winter and summer rainfall dominated regions of South Africa, even small changes in the ways that individual ENSO, SIOD, IOD or SAM events influence the tracks or strengths of rain-producing weather systems crossing the region can have substantial impacts on seasonal rainfall and may preclude any consistent signal.
Although there does not appear to any obvious linkage between these large-scale climate modes and spring rainfall over the Eastern Cape, the wavenumber 3 or 4 patterns in Fig. 7 suggest that changes in the South Atlantic or South Indian Ocean semi-permanent anticyclones might be important. On average during spring, the former anticyclone tends to move southeastward towards southwestern South Africa, signalling the end of the winter rainy season there. The South Indian Ocean High (SIHP) also tends to retreat southeastwards in spring and the continental high over southern Africa breaks down then, coincident with the end of the dry winter half of the year for southern Africa (except the far southwest). On examining the spatial extent and centre of these anticyclones for the composite seasons, it is found that the South Atlantic anticyclone tends to be located further to the southeast (and closer to western South Africa) in drier than wetter springs while the SIHP tends to located nearer Western Australia (eastern South Africa) in the dry (wet) case. These anomalous locations of the anticyclones further encourage less (more) cloud bands and cold fronts over the Eastern Cape region during dry (wet) springs.
For the SIHP, its eastern extent (Fig. 11 a) is strongly negatively correlated with SON rainfall over the “west” basin of the Eastern Cape as well as most of western South Africa. The “west” basin also shows a significant negative correlation with the northern extent of the SIHP (Fig. 11 d). Based on the climatological moisture flux shown in Fig. 8 a, this negative correlation might be related to a more northward extending SIHP leading to a reduced easterly moisture flux into northern South Africa, Zimbabwe and Mozambique and subsequent weaker northerly moisture inflow towards the Eastern Cape and thus drier conditions. It is not obvious that a more eastward extending SIHP could also lead to a negative correlation with rainfall but a possibility is that this location of the SIHP tends to favour cloud bands being located more over the South West Indian Ocean rather than over the landmass (Fauchereau et al. 2009 ; Hart et al. 2018 ). The southern and western extents of the SIHP (Fig. 11 b, c) are also mainly negatively correlated with Eastern Cape SON rainfall but this is only statistically significant for small areas in the far northeast near Lesotho.
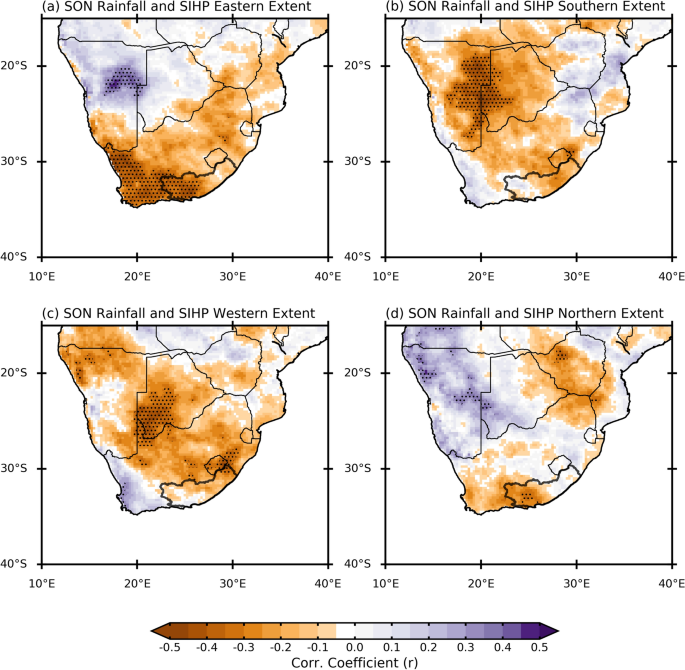
The correlation between SON rainfall and a eastern, b southern, c western and d northern extent of the South Indian Ocean High Pressure (see text for details). Areas that are statistically significant at the 95% level are denoted by stippling. The location of the Eastern Cape river basins is denoted with the black polygon
Although Fig. 7 indicated shifts in wavenumber 3 pattern, it can be seen that only the circulation anomaly in the midlatitude South Indian Ocean is consistent between the dry and wet spring composites since the anomalies in the midlatitude South Pacific and South Atlantic are not exactly in the same place. Nevertheless, using a zonal wavenumber 3 index such as that proposed by Raphael ( 2004 ) leads to a fairly strong and statistically significant correlation (Fig. 12 a) with spring rainfall over much of the Eastern Cape as well as part of the northeast of South Africa. If an index for only the South Indian Ocean component of the wavenumber 3 index is used (standardised anomalies in 500 hPa geopotential height spatially averaged over 45–50° S, 45–60° E) then Fig. 12 b indicates a statistically significant correlation over the central third of the Eastern Cape (with stronger r values than for the full index) as well as some other parts of subtropical southern Africa in a NW–SE cloud band type orientation.
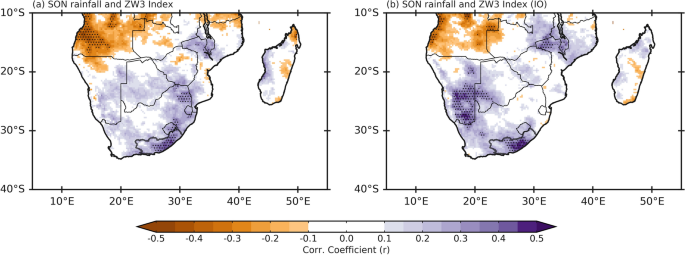
The correlation between SON rainfall and a the zonal wave number 3 index of Raphael ( 2004 ) and b only the South Indian Ocean High component of that index. Areas that are statistically significant at the 95% level are denoted by stippling. The location of the Eastern Cape river basins is denoted with the black polygon
3.3 Model rainfall projections
Given the trends in spring rainfall and rain days (Figs. 4 , 5 , 6 ) over the Eastern Cape and the great concern of the public and government about climate change, it is of interest to examine CMIP5 model projections for future rainfall over the region, particularly since there is a likelihood of more extreme rainfall events occurring over southern Africa in the future (IPCC 2013 ). As already seen in Fig. 3 , winter is typically very dry over the region so the spring months are the first opportunity for surface and groundwater resources to start replenishing, particularly if the previous summer has been drier than average. Thus, it is of concern to know whether climate models are projecting that these spring months might become drier in future and how well the models can represent the annual cycle in rainfall.
Figure 13 a plots the annual cycle of rainfall over the Eastern Cape for 36 CMIP5 models and for two observed gridded rainfall products that have similar resolution to the models (GPCP and CMAP). The latter show a weak bimodal cycle with November and February as the wettest months; however, the bimodal aspects in the dry season are not obvious since May, June and July are all very similar and then the average rainfall starts increasing from August. This bimodal cycle is a weaker version of that evident in Southern Hemisphere regions (and related to the semiannual oscillation) which are located more in the mid-latitudes such as southern Victoria, Australia which extends to 38° S as compared to the Eastern Cape which lies north of 33–34° S. Almost all the models show a much wetter summer half of the year than winter but only some show February or November as the wettest months. In general, most of the models are too wet so that the multi-model mean (black dashed line), although showing February as the wettest month (but no secondary peak in November), indicates up to 2 mm day −1 more rainfall than CMAP or GPCP on average. However during spring, the wet bias is smaller (1 mm day −1 ) with November being the wettest month as observed; the lack of a small decrease from November to December in the multi-model mean unlike in the observed is not directly relevant to the spring focus in this study.
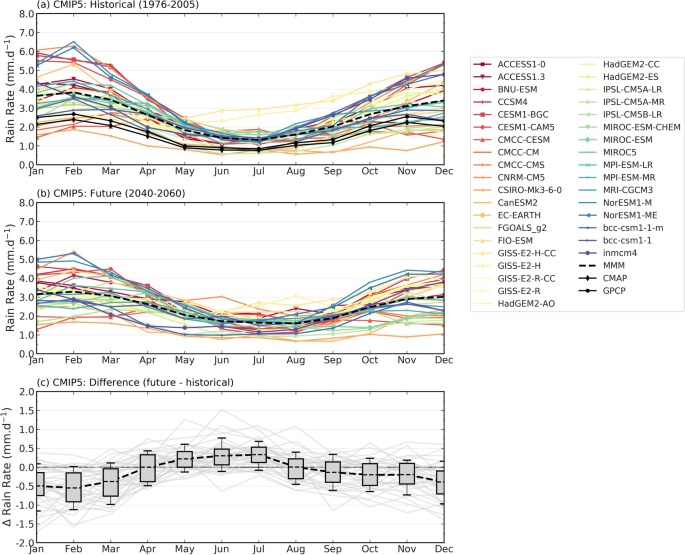
The annual cycle of rainfall (rain rate; mm/day) averaged across the river basin polygon for the Eastern Cape in 36 CMIP5 models for a the historical runs for the 1979–2005, b the mid-twenty-first century projections (2040–2060) and c the difference between the mid-twenty-first century projections and the historical runs. For comparison, two observation products (CMAP and GPCP) are included in a (black solid lines). The multi-model mean (MMM) is represented by a black dashed line in all three panels. Box plots in c cover the 10th–90th percentile range of a change in rain rate
Figure 13 b, c plot the mid-century (2040–2060) projections in the annual cycle under the RCP8.5 scenario for each model and the multi-model mean together with the difference from the current climate. These figures indicate that the models are projecting a slight flattening of the annual cycle with the winter becoming wetter and the summer drier. For the spring season of interest here, the multi-model projections also indicate a drying but less pronounced than for the summer. From Fig. 14 it is evident that most of the 36 models project drying in spring but since 8 models project wetter conditions, then when averaged across the province, the multi-model mean indicates only very slight drying in this season. However, given the complex topography and meteorology, highly varying soil and vegetation conditions in this province (e.g. 6 of the 7 biomes found in South Africa also occur in the Eastern Cape) together with the presence of the highly variable and intense Agulhas Current to its south, it is not surprising that the models should show a spread in projections over the Eastern Cape and have difficulties in accurately representing its climate. A substantial part of the difficulties that such models have with representing the region’s climate likely results from their ability to adequately represent the characteristics of the cloud bands. As previously highlighted, changes in the frequency of cloud bands during SON can result in wetter (more cloud bands) or drier (fewer cloud bands) conditions in the Eastern Cape. In a comprehensive analysis of the ability of CMIP5 models to represent cloud bands over southern Africa, James et al. ( 2020 ) found that there are large variations in the modelled average locations and frequencies of these weather systems between the models even though all models correctly simulate the large scale generation and evolution of the cloud bands. Since the Eastern Cape is only part of the large area in southern Africa affected by cloud bands, small errors in the model simulations of cloud bands can therefore lead to substantial discrepancies in the resulting model simulation of seasonal rainfall. This large model spread in seasonal rainfall simulation means that future projections need to be viewed with caution and that the complex geography and meteorology of this region is likely to continue to pose significant challenges for climate models.
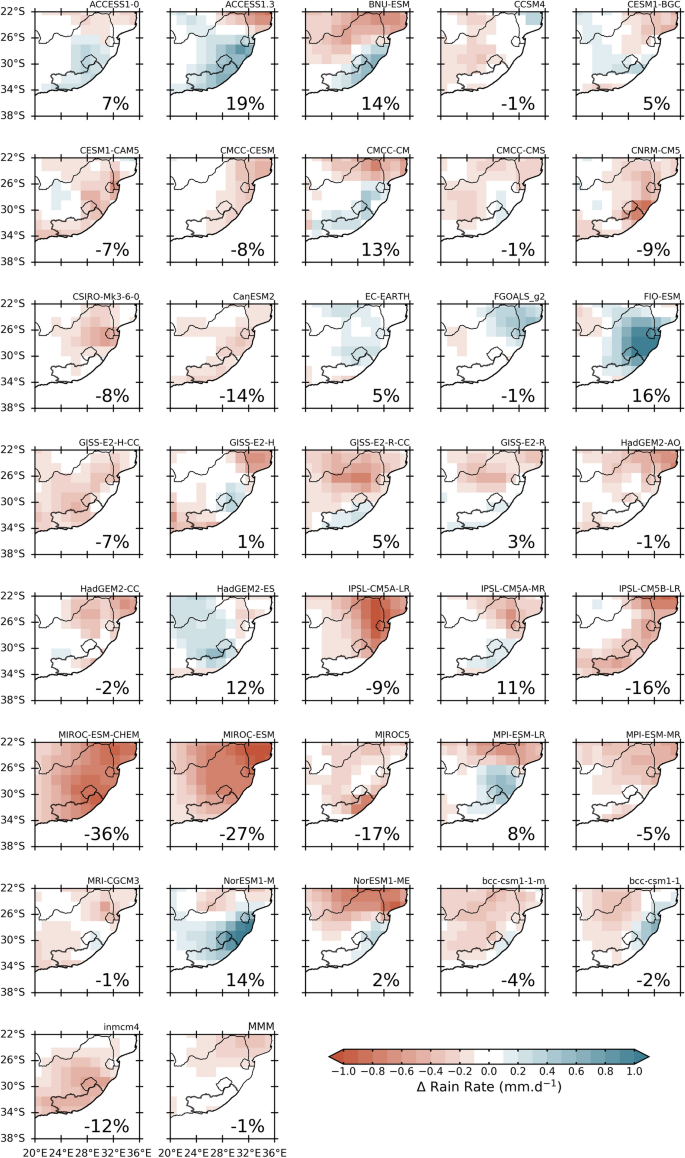
Mid-twenty-first century (2040–2060) projected changes in austral spring (SON) rainfall (shaded; in mm per day) in comparison to the historical period of 1976–2005 for the eastern half of South Africa in 36 CMIP5 models. The percentage change (%) given in the right-hand corner of each panel denotes the change averaged across the polygon (charcoal line) across the Eastern Cape river basins. The multi-model mean (MMM) in given in the last panel
4 Conclusions
The Eastern Cape province of South Africa lies in the transition zone between the winter rainfall (western South Africa) and the summer rainfall (rest of subtropical southern Africa) regions which makes it an interesting but complex region to study. It is characterised by strong topographic, soil moisture and vegetation gradients and its coast is close to the highly variable Agulhas Current (the most intense western boundary current in the global oceans). Given its latitudinal range of about 30–34° S, the Eastern Cape is influenced by both tropical and midlatitude weather systems and their interactions further adding to the complexity of its meteorology. Severe droughts and flooding events are frequently experienced in the Eastern Cape which cause substantial socio-economic impacts, including loss of life in some cases. Currently, the province is suffering an intense drought (which started in 2015) with several urban areas under stringent water restrictions and having been close to have run out of piped water from the corresponding dams.
Although the 2015-drought has manifest itself throughout all seasons, focus here has been placed on spring (September–November) which shows the strongest and most coherent signal. On average, this season contributes between 25 and 35% of the annual total rainfall. A composite analysis of the 5 driest (wettest) springs since 1981 which are chosen on the basis that the extended summer are also anomalously dry (wet) indicated that these were related to a large cyclonic (anticyclonic) mid-tropospheric anomaly located to the south and southeast of South Africa that seems in turn to be related to changes in the zonal wavenumber 3 pattern. Over southern Africa, the composites suggest that dry (wet) springs are associated with a weaker (stronger) near-surface Angola Low and stronger (weaker) mid-level Botswana High with enhanced (reduced) subsidence which lead to less (more) favourable conditions for cloud bands to develop. None of the large-scale climate modes that are known to affect subtropical southern Africa show statistically significant correlations with spring rainfall over the Eastern Cape but the Southern Annular Mode is significantly correlated (positive) with summer rainfall.
Trends in spring rainfall characteristics were also investigated. Most of the Eastern Cape shows a statistically significant decline in spring rainfall, particularly in the east and northeast of the province. This east/northeastern region is in fact part of a larger region of eastern South Africa (with strongest trends in this part of the Eastern Cape, Lesotho and eastern Free State) (not shown) which shows significant decreasing trends in spring rainfall totals and rain days. Elsewhere, part of the dam catchment areas for the largest city of Port Elizabeth also show significantly decreasing trends. Overall, the results suggest that the rainfall gradient across the province is weakening, at least in spring. Most of the decreasing rainfall trend seems to result from a reduction in the number of rainfall days but not in heavy rainfall days (defined as more than > 10 mm per day).
Analysis of mid-century (2040–2060) projections under the RCP8.5 scenario suggested that there may be a slight flattening of the annual cycle over the Eastern Cape with the winter becoming wetter and the summer drier. For the spring season of interest here, the multi-model projections also indicated drying but less pronounced than for the summer. Although most of the 36 models analysed project a spring drying over the Eastern Cape, the multi-model mean indicates only very slight drying in this season. However, given the strong land and ocean surface gradients in the region and its sensitivity to both tropical and midlatitude circulation, it is not surprising that the models should show a spread in projections over the Eastern Cape and have difficulties in accurately representing its climate. Furthermore, the difficulties relative to observations that CMIP5 models have in simulating the frequency and location of cloud bands (James et al. 2020 ), a key rainfall-producing system over the region, adds to the uncertainty in future rainfall changes. Caution therefore needs to be taken regarding future projections over this region. Nonetheless, the complex geography and meteorology of this region does provide an interesting test bed for climate models.
Adler RF, Huffman GJ, Chang A, Ferraro R, Xie P-P, Janowiak J, Rudolf B, Schneider U, Curtis S, Bolvin D (2003) The version-2 global precipitation climatology project (GPCP) monthly precipitation analysis (1979–present). J Hydrometeorol 4(6):1147–1167
Google Scholar
Behera SK, Yamagata T (2001) Subtropical SST dipole events in the southern Indian Ocean. Geophys Res Lett 28(2):327–330
Blamey R, Reason CJC (2009) Numerical simulation of a mesoscale convective system over the east coast of South Africa. Tellus A Dyn Meteorol Oceanogr 61:17–34
Blamey R, Reason CJC (2013) The role of mesoscale convective complexes in southern Africa summer rainfall. J Clim 26:1654–1668
Blamey RC, Kolusu S, Mahlalela P, Todd M, Reason CJC (2018a) The role of regional circulation features in regulating El Niño climate impacts over southern Africa: a comparison of the 2015/2016 drought with previous events. Int J Climatol 38:4276–4295
Blamey RC, Ramos AM, Trigo R, Tomé R, Reason CJC (2018b) The influence of atmospheric rivers over the South Atlantic on winter rainfall in South Africa. J Hydrometeorol 19:127–142
Botai CM, Botai JO, Adeola AM (2018) Spatial distribution of temporal precipitation contrasts in South Africa. S Afr J Sci 114:70–78
Burls NJ, Blamey RC, Cash BA, Swenson ET, al Fahad A, Bopape M-JM, Straus DM, Reason CJC (2019) The Cape Town “Day Zero” drought and Hadley cell expansion. NPJ Clim Atmos Sci 2(1):1–8
Cook C, Reason CJC, Hewitson BC (2004) Wet and dry spells within particularly wet and dry summers in the South African summer rainfall region. Clim Res 26(1):17–31
Diab R, Preston-Whyte R, Washington R (1991) Distribution of rainfall by synoptic type over Natal, South Africa. Int J Climatol 11:877–888
Driver P, Reason CJC (2017) Variability in the Botswana High and its relationships with rainfall and temperature characteristics over southern Africa. Int J Climatol 37:570–581
Engelbrecht CJ, Landman WA (2016) Interannual variability of seasonal rainfall over the Cape south coast of South Africa and synoptic type association. Clim Dyn 47:295–313
Engelbrecht CJ, Landman WA, Engelbrecht FA, Malherbe J (2015) A synoptic decomposition of rainfall over the Cape south coast of South Africa. Clim Dyn 44:2589–2607
Fauchereau N, Pohl B, Reason CJC, Rouault M, Richard Y (2009) Recurrent daily OLR patterns in the Southern Africa/Southwest Indian Ocean region, implications for South African rainfall and teleconnections. Clim Dyn 32(4):575–591
Funk C, Peterson P, Landsfeld M, Pedreros D, Verdin J, Shukla S, Husak G, Rowland J, Harrison L, Hoell A, Michaelsen J (2015) The climate hazards infrared precipitation with stations—a new environmental record for monitoring extremes. Sci Data 2:150066
Gillett NP, Kell TD, Jones PD (2006) Regional climate impacts of the Southern Annular Mode. Geophys Res Lett 33:L23704. https://doi.org/10.1029/2006GL027721
Hansingo K, Reason CJC (2009) Modelling the atmospheric response over southern Africa to SST forcing in the southeast tropical Atlantic and southwest subtropical Indian Oceans. Int J Climatol 29(7):1001–1012
Harrison MSJ (1984) A generalized classification of South African summer rain-bearing synoptic systems. J Climatol 4:547–560
Hart N, Reason CJC, Fauchereau N (2010) Tropical–extratropical interactions over southern Africa: three cases of heavy summer season rainfall. Mon Weather Rev 138:2608–2623
Hart NCG, Reason CJC, Fauchereau N (2012) Building a tropical–extratropical cloud band metbot. Mon Weather Rev 140:4005–4016. https://doi.org/10.1175/MWR-D-12-00127.1
Article Google Scholar
Hart NCG, Washington R, Reason CJC (2018) On the likelihood of tropical-extratropical cloud bands in the South Indian Convergence Zone during ENSO events. J Clim 31:2797–2817
IPCC (2013) Climate change 2013: the physical science basis. contribution of working group i to the fifth assessment report of the intergovernmental panel on climate change. In: Stocker TF, Qin D, Plattner G-K, Tignor M, Allen SK, Boschung J, Nauels A, Xia Y, Bex V, Midgley PM (eds) Cambridge University Press, Cambridge, United Kingdom and New York, NY, USA, 1535 pp
James R, Hart N, Munday C, Reason CJC, Washington R (2020) Coupled climate model simulation of tropical–extratropical cloud bands over southern Africa. J Clim. https://doi.org/10.1175/JCLI-D-19-0731.s1 (in press)
Jury MR, Valentine HR, Lutjeharms JRE (1993) Influence of the agulhas current on summer rainfall along the southeast coast of South Africa. J Appl Meteorol 32:1282–1287
Kanamitsu M, Ebisuzaki W, Woollen J, Yang S-K, Hnilo J, Fiorino M, Potter G (2002) NCEP-DOE AMIP-ii reanalysis (r-2). Bull Am Meteorol Soc 83:1631–1644
Lindesay J (1988) South African rainfall, the Southern Oscillation and a Southern Hemisphere semi-annual cycle. J Climatol 8(1):17–30
Mahlalela P, Blamey RC, Reason CJC (2019) Mechanisms behind early winter rainfall variability in the southwestern Cape, South Africa. Clim Dyn 53:21–39
Manhique A, Reason CJC, Rydberg L, Fauchereau N (2011) ENSO and Indian Ocean sea surface temperatures and their relationships with tropical temperate troughs over Mozambique and the Southwest Indian Ocean. Int J Climatol 31:1–13
Marshall GJ (2003) Trends in the Southern Annular Mode from observations and reanalyses. J Clim 16:4134–4143
Mason S (1995) Sea-surface temperature—South African rainfall associations 1910–1989. Int J Climatol 15:119–135
Mulenga H, Rouault M, Reason C (2003) Dry summers over northeastern South Africa and associated circulation anomalies. Clim Res 25:29–41
Pienaar L, Boonzaaier J (2018) Drought policy brief Western Cape Agriculture. Western Cape Department of Agriculture (WCDoA) and the Bureau for Food and Agricultural Policy (BFAP), Elsenburg
Raphael MN (2004) A zonal wave number 3 index for the Southern Hemisphere. Geophys Res Lett 31:L23212. https://doi.org/10.1029/2004GL020365
Reason CJC (1999) Interannual warm and cool events in the subtropical/mid-latitude South Indian Ocean region. Geophys Res Lett 26:215–218
Reason CJC (2001) Subtropical Indian Ocean SST dipole events and southern African rainfall. Geophys Res Lett 28(11):2225–2227
Reason CJC (2016) The Bolivian, Botswana, and Bilybara Highs and Southern Hemisphere drought/floods. Geophys Res Lett 43(3):1280–1286
Reason CJC, Mulenga H (1999) Relationships between South African rainfall and SST anomalies in the southwest Indian Ocean. Int J Climatol 19(15):1651–1673
Reason CJC, Rouault M (2005) Links between the Antarctic Oscillation and winter rainfall over western South Africa. Geophys Res Lett 32:1–4. https://doi.org/10.1029/2005GL022419
Reason CJC, Allan RJ, Lindesay JA, Ansell TJ (2000) ENSO and climatic signals across the Indian Ocean basin in the global context: part I, Interannual composite patterns. Int J Climatol 20(11):1285–1327
Reason CJC, Rouault M, Melice J-L, Jagadheesha D (2002) Interannual winter rainfall variability in SW South Africa and large scale ocean–atmosphere interactions. Meteorol Atmos Phys 80(1–4):19–29
Rouault M, White S, Reason CJC, Lutjeharms J, Jobard I (2002) Ocean–atmosphere interaction in the Agulhas Current region and a South African extreme weather event. Weather Forecast 17(4):655–669
Rouault M, Florenchie P, Fauchereau N, Reason CJ (2003) South East tropical Atlantic warm events and southern African rainfall. Geophys Res Lett 30(5):8009. https://doi.org/10.1029/2002GL014840
Saji N, Goswami B, Vinayachandran P, Yamagata T (1999) A dipole mode in the tropical Indian Ocean. Nature 401(6751):360–363
Singleton AT, Reason CJC (2006) Numerical Simulations of a Severe Rainfall Event over the Eastern Cape coast of South Africa: sensitivity to sea surface temperature and topography. Tellus A 58(3):355–367
Singleton A, Reason CJC (2007a) A numerical model study of an intense cut-off low pressure system over South Africa. Mon Weather Rev 135:1128–1150
Singleton A, Reason CJC (2007b) Variability in the characteristics of cut-off low pressure systems over subtropical southern Africa. Int J Climatol 27:295–310
Sousa PM, Blamey RC, Reason CJC, Ramos AM, Trigo RM (2018) The ‘Day Zero’ Cape Town drought and the poleward migration of moisture corridors. Environ Res Lett 13:124025
Taljaard JJ (1985) Cut-off lows in the South African region. Weather Bureau, Department of Transport., 1996: Atmospheric circulation systems, synoptic climatology and weather phenomena of South Africa. Part 6, Rainfall in South Africa. Department of Environmental Affairs and Tourism
Taylor KE, Stouffer RJ, Meehl GA (2012) An overview of CMIP5 and the experiment design. Bull Am Meteorol Soc 93(4):485–498
Todd M, Washington R (1999) Circulation anomalies associated with tropical-temperate troughs in southern Africa and the south west Indian Ocean. Clim Dyn 15(12):937–951
Walker N (1990) Links between South African summer rainfall and temperature variability of the Agulhas and Benguela Current systems. J Geophys Res Oceans 95(C3):3297–3319
Weldon D, Reason CJC (2014) Variability of rainfall characteristics over the South Coast region of South Africa. Theor Appl Climatol 115(1–2):177–185
Xie P, Arkin PA (1997) Global precipitation: a 17-year monthly analysis based on gauge observations, satellite estimates, and numerical model outputs. Bull Am Meteorol Soc 78(11):2539–2558
Download references
Acknowledgements
The first author gratefully acknowledges the South African National Antarctic Programme of the NRF for partially funding her PhD research. The authors thank the South African Weather Service (SAWS) for providing rainfall data and Pierre Kloppers (CSAG, UCT) for assistance with data quality control. NCEP and OISST data were obtained from the NOAA/ESRL Physical Sciences Division, Boulder Colorado website at https://www.esrl.noaa.gov/psd/ . Daily CHIRPS data have been downloaded from the Climate Hazards Group data website ( https://www.chc.ucsb.edu/data/chirps ). The Nino 3.4 index, SAM index and SIOD were downloaded from the KNMI Climate Explorer ( https://climexp.knmi.nl ). We also acknowledge the World Climate Research Programme’s Working Group on Coupled Modelling responsible for CMIP5 model data, which was provided by the Program for Climate Model Diagnosis and Intercomparison (PCMDI; https://pcmdi.llnl.gov/ ).
Author information
Authors and affiliations.
Department of Oceanography, University of Cape Town, Rondebosch, South Africa
P. T. Mahlalela, R. C. Blamey & C. J. C. Reason
OUCE, Oxford University, Oxford, UK
N. C. G. Hart
You can also search for this author in PubMed Google Scholar
Corresponding author
Correspondence to C. J. C. Reason .
Additional information
Publisher's note.
Springer Nature remains neutral with regard to jurisdictional claims in published maps and institutional affiliations.
Rights and permissions
Reprints and permissions
About this article
Mahlalela, P.T., Blamey, R.C., Hart, N.C.G. et al. Drought in the Eastern Cape region of South Africa and trends in rainfall characteristics. Clim Dyn 55 , 2743–2759 (2020). https://doi.org/10.1007/s00382-020-05413-0
Download citation
Received : 25 March 2020
Accepted : 07 August 2020
Published : 14 August 2020
Issue Date : November 2020
DOI : https://doi.org/10.1007/s00382-020-05413-0
Share this article
Anyone you share the following link with will be able to read this content:
Sorry, a shareable link is not currently available for this article.
Provided by the Springer Nature SharedIt content-sharing initiative
- Drought/floods
- Rainfall variability
- South Africa
- Find a journal
- Publish with us
- Track your research
- Announcements
- About AOSIS
- Editorial Team
- Submission Procedures
- Submission Guidelines
- Submit and Track Manuscript
- Publication fees
- Make a payment
- Journal Information
- Journal Policies
- Frequently Asked Questions
- Reviewer Guidelines
- Article RSS
- Support Enquiry (Login required)
- Aosis Newsletter
Open Journal Systems
Crossref Citations

Subscribe to our newsletter
Get specific, domain-collection newsletters detailing the latest CPD courses, scholarly research and call-for-papers in your field.
Jàmbá: Journal of Disaster Risk Studies | ISSN: 2072-845X (PRINT) | ISSN: 1996-1421 (ONLINE)
ISSN: 1996-1421
An official website of the United States government
The .gov means it’s official. Federal government websites often end in .gov or .mil. Before sharing sensitive information, make sure you’re on a federal government site.
The site is secure. The https:// ensures that you are connecting to the official website and that any information you provide is encrypted and transmitted securely.
- Publications
- Account settings
Preview improvements coming to the PMC website in October 2024. Learn More or Try it out now .
- Advanced Search
- Journal List
- J Korean Med Sci
- v.36(50); 2021 Dec 27

Formulating Hypotheses for Different Study Designs
Durga prasanna misra.
1 Department of Clinical Immunology and Rheumatology, Sanjay Gandhi Postgraduate Institute of Medical Sciences, Lucknow, India.
Armen Yuri Gasparyan
2 Departments of Rheumatology and Research and Development, Dudley Group NHS Foundation Trust (Teaching Trust of the University of Birmingham, UK), Russells Hall Hospital, Dudley, UK.
Olena Zimba
3 Department of Internal Medicine #2, Danylo Halytsky Lviv National Medical University, Lviv, Ukraine.
Marlen Yessirkepov
4 Department of Biology and Biochemistry, South Kazakhstan Medical Academy, Shymkent, Kazakhstan.
Vikas Agarwal
George d. kitas.
5 Centre for Epidemiology versus Arthritis, University of Manchester, Manchester, UK.
Generating a testable working hypothesis is the first step towards conducting original research. Such research may prove or disprove the proposed hypothesis. Case reports, case series, online surveys and other observational studies, clinical trials, and narrative reviews help to generate hypotheses. Observational and interventional studies help to test hypotheses. A good hypothesis is usually based on previous evidence-based reports. Hypotheses without evidence-based justification and a priori ideas are not received favourably by the scientific community. Original research to test a hypothesis should be carefully planned to ensure appropriate methodology and adequate statistical power. While hypotheses can challenge conventional thinking and may be controversial, they should not be destructive. A hypothesis should be tested by ethically sound experiments with meaningful ethical and clinical implications. The coronavirus disease 2019 pandemic has brought into sharp focus numerous hypotheses, some of which were proven (e.g. effectiveness of corticosteroids in those with hypoxia) while others were disproven (e.g. ineffectiveness of hydroxychloroquine and ivermectin).
Graphical Abstract


DEFINING WORKING AND STANDALONE SCIENTIFIC HYPOTHESES
Science is the systematized description of natural truths and facts. Routine observations of existing life phenomena lead to the creative thinking and generation of ideas about mechanisms of such phenomena and related human interventions. Such ideas presented in a structured format can be viewed as hypotheses. After generating a hypothesis, it is necessary to test it to prove its validity. Thus, hypothesis can be defined as a proposed mechanism of a naturally occurring event or a proposed outcome of an intervention. 1 , 2
Hypothesis testing requires choosing the most appropriate methodology and adequately powering statistically the study to be able to “prove” or “disprove” it within predetermined and widely accepted levels of certainty. This entails sample size calculation that often takes into account previously published observations and pilot studies. 2 , 3 In the era of digitization, hypothesis generation and testing may benefit from the availability of numerous platforms for data dissemination, social networking, and expert validation. Related expert evaluations may reveal strengths and limitations of proposed ideas at early stages of post-publication promotion, preventing the implementation of unsupported controversial points. 4
Thus, hypothesis generation is an important initial step in the research workflow, reflecting accumulating evidence and experts' stance. In this article, we overview the genesis and importance of scientific hypotheses and their relevance in the era of the coronavirus disease 2019 (COVID-19) pandemic.
DO WE NEED HYPOTHESES FOR ALL STUDY DESIGNS?
Broadly, research can be categorized as primary or secondary. In the context of medicine, primary research may include real-life observations of disease presentations and outcomes. Single case descriptions, which often lead to new ideas and hypotheses, serve as important starting points or justifications for case series and cohort studies. The importance of case descriptions is particularly evident in the context of the COVID-19 pandemic when unique, educational case reports have heralded a new era in clinical medicine. 5
Case series serve similar purpose to single case reports, but are based on a slightly larger quantum of information. Observational studies, including online surveys, describe the existing phenomena at a larger scale, often involving various control groups. Observational studies include variable-scale epidemiological investigations at different time points. Interventional studies detail the results of therapeutic interventions.
Secondary research is based on already published literature and does not directly involve human or animal subjects. Review articles are generated by secondary research. These could be systematic reviews which follow methods akin to primary research but with the unit of study being published papers rather than humans or animals. Systematic reviews have a rigid structure with a mandatory search strategy encompassing multiple databases, systematic screening of search results against pre-defined inclusion and exclusion criteria, critical appraisal of study quality and an optional component of collating results across studies quantitatively to derive summary estimates (meta-analysis). 6 Narrative reviews, on the other hand, have a more flexible structure. Systematic literature searches to minimise bias in selection of articles are highly recommended but not mandatory. 7 Narrative reviews are influenced by the authors' viewpoint who may preferentially analyse selected sets of articles. 8
In relation to primary research, case studies and case series are generally not driven by a working hypothesis. Rather, they serve as a basis to generate a hypothesis. Observational or interventional studies should have a hypothesis for choosing research design and sample size. The results of observational and interventional studies further lead to the generation of new hypotheses, testing of which forms the basis of future studies. Review articles, on the other hand, may not be hypothesis-driven, but form fertile ground to generate future hypotheses for evaluation. Fig. 1 summarizes which type of studies are hypothesis-driven and which lead on to hypothesis generation.

STANDARDS OF WORKING AND SCIENTIFIC HYPOTHESES
A review of the published literature did not enable the identification of clearly defined standards for working and scientific hypotheses. It is essential to distinguish influential versus not influential hypotheses, evidence-based hypotheses versus a priori statements and ideas, ethical versus unethical, or potentially harmful ideas. The following points are proposed for consideration while generating working and scientific hypotheses. 1 , 2 Table 1 summarizes these points.
Evidence-based data
A scientific hypothesis should have a sound basis on previously published literature as well as the scientist's observations. Randomly generated (a priori) hypotheses are unlikely to be proven. A thorough literature search should form the basis of a hypothesis based on published evidence. 7
Unless a scientific hypothesis can be tested, it can neither be proven nor be disproven. Therefore, a scientific hypothesis should be amenable to testing with the available technologies and the present understanding of science.
Supported by pilot studies
If a hypothesis is based purely on a novel observation by the scientist in question, it should be grounded on some preliminary studies to support it. For example, if a drug that targets a specific cell population is hypothesized to be useful in a particular disease setting, then there must be some preliminary evidence that the specific cell population plays a role in driving that disease process.
Testable by ethical studies
The hypothesis should be testable by experiments that are ethically acceptable. 9 For example, a hypothesis that parachutes reduce mortality from falls from an airplane cannot be tested using a randomized controlled trial. 10 This is because it is obvious that all those jumping from a flying plane without a parachute would likely die. Similarly, the hypothesis that smoking tobacco causes lung cancer cannot be tested by a clinical trial that makes people take up smoking (since there is considerable evidence for the health hazards associated with smoking). Instead, long-term observational studies comparing outcomes in those who smoke and those who do not, as was performed in the landmark epidemiological case control study by Doll and Hill, 11 are more ethical and practical.
Balance between scientific temper and controversy
Novel findings, including novel hypotheses, particularly those that challenge established norms, are bound to face resistance for their wider acceptance. Such resistance is inevitable until the time such findings are proven with appropriate scientific rigor. However, hypotheses that generate controversy are generally unwelcome. For example, at the time the pandemic of human immunodeficiency virus (HIV) and AIDS was taking foot, there were numerous deniers that refused to believe that HIV caused AIDS. 12 , 13 Similarly, at a time when climate change is causing catastrophic changes to weather patterns worldwide, denial that climate change is occurring and consequent attempts to block climate change are certainly unwelcome. 14 The denialism and misinformation during the COVID-19 pandemic, including unfortunate examples of vaccine hesitancy, are more recent examples of controversial hypotheses not backed by science. 15 , 16 An example of a controversial hypothesis that was a revolutionary scientific breakthrough was the hypothesis put forth by Warren and Marshall that Helicobacter pylori causes peptic ulcers. Initially, the hypothesis that a microorganism could cause gastritis and gastric ulcers faced immense resistance. When the scientists that proposed the hypothesis themselves ingested H. pylori to induce gastritis in themselves, only then could they convince the wider world about their hypothesis. Such was the impact of the hypothesis was that Barry Marshall and Robin Warren were awarded the Nobel Prize in Physiology or Medicine in 2005 for this discovery. 17 , 18
DISTINGUISHING THE MOST INFLUENTIAL HYPOTHESES
Influential hypotheses are those that have stood the test of time. An archetype of an influential hypothesis is that proposed by Edward Jenner in the eighteenth century that cowpox infection protects against smallpox. While this observation had been reported for nearly a century before this time, it had not been suitably tested and publicised until Jenner conducted his experiments on a young boy by demonstrating protection against smallpox after inoculation with cowpox. 19 These experiments were the basis for widespread smallpox immunization strategies worldwide in the 20th century which resulted in the elimination of smallpox as a human disease today. 20
Other influential hypotheses are those which have been read and cited widely. An example of this is the hygiene hypothesis proposing an inverse relationship between infections in early life and allergies or autoimmunity in adulthood. An analysis reported that this hypothesis had been cited more than 3,000 times on Scopus. 1
LESSONS LEARNED FROM HYPOTHESES AMIDST THE COVID-19 PANDEMIC
The COVID-19 pandemic devastated the world like no other in recent memory. During this period, various hypotheses emerged, understandably so considering the public health emergency situation with innumerable deaths and suffering for humanity. Within weeks of the first reports of COVID-19, aberrant immune system activation was identified as a key driver of organ dysfunction and mortality in this disease. 21 Consequently, numerous drugs that suppress the immune system or abrogate the activation of the immune system were hypothesized to have a role in COVID-19. 22 One of the earliest drugs hypothesized to have a benefit was hydroxychloroquine. Hydroxychloroquine was proposed to interfere with Toll-like receptor activation and consequently ameliorate the aberrant immune system activation leading to pathology in COVID-19. 22 The drug was also hypothesized to have a prophylactic role in preventing infection or disease severity in COVID-19. It was also touted as a wonder drug for the disease by many prominent international figures. However, later studies which were well-designed randomized controlled trials failed to demonstrate any benefit of hydroxychloroquine in COVID-19. 23 , 24 , 25 , 26 Subsequently, azithromycin 27 , 28 and ivermectin 29 were hypothesized as potential therapies for COVID-19, but were not supported by evidence from randomized controlled trials. The role of vitamin D in preventing disease severity was also proposed, but has not been proven definitively until now. 30 , 31 On the other hand, randomized controlled trials identified the evidence supporting dexamethasone 32 and interleukin-6 pathway blockade with tocilizumab as effective therapies for COVID-19 in specific situations such as at the onset of hypoxia. 33 , 34 Clues towards the apparent effectiveness of various drugs against severe acute respiratory syndrome coronavirus 2 in vitro but their ineffectiveness in vivo have recently been identified. Many of these drugs are weak, lipophilic bases and some others induce phospholipidosis which results in apparent in vitro effectiveness due to non-specific off-target effects that are not replicated inside living systems. 35 , 36
Another hypothesis proposed was the association of the routine policy of vaccination with Bacillus Calmette-Guerin (BCG) with lower deaths due to COVID-19. This hypothesis emerged in the middle of 2020 when COVID-19 was still taking foot in many parts of the world. 37 , 38 Subsequently, many countries which had lower deaths at that time point went on to have higher numbers of mortality, comparable to other areas of the world. Furthermore, the hypothesis that BCG vaccination reduced COVID-19 mortality was a classic example of ecological fallacy. Associations between population level events (ecological studies; in this case, BCG vaccination and COVID-19 mortality) cannot be directly extrapolated to the individual level. Furthermore, such associations cannot per se be attributed as causal in nature, and can only serve to generate hypotheses that need to be tested at the individual level. 39
IS TRADITIONAL PEER REVIEW EFFICIENT FOR EVALUATION OF WORKING AND SCIENTIFIC HYPOTHESES?
Traditionally, publication after peer review has been considered the gold standard before any new idea finds acceptability amongst the scientific community. Getting a work (including a working or scientific hypothesis) reviewed by experts in the field before experiments are conducted to prove or disprove it helps to refine the idea further as well as improve the experiments planned to test the hypothesis. 40 A route towards this has been the emergence of journals dedicated to publishing hypotheses such as the Central Asian Journal of Medical Hypotheses and Ethics. 41 Another means of publishing hypotheses is through registered research protocols detailing the background, hypothesis, and methodology of a particular study. If such protocols are published after peer review, then the journal commits to publishing the completed study irrespective of whether the study hypothesis is proven or disproven. 42 In the post-pandemic world, online research methods such as online surveys powered via social media channels such as Twitter and Instagram might serve as critical tools to generate as well as to preliminarily test the appropriateness of hypotheses for further evaluation. 43 , 44
Some radical hypotheses might be difficult to publish after traditional peer review. These hypotheses might only be acceptable by the scientific community after they are tested in research studies. Preprints might be a way to disseminate such controversial and ground-breaking hypotheses. 45 However, scientists might prefer to keep their hypotheses confidential for the fear of plagiarism of ideas, avoiding online posting and publishing until they have tested the hypotheses.
SUGGESTIONS ON GENERATING AND PUBLISHING HYPOTHESES
Publication of hypotheses is important, however, a balance is required between scientific temper and controversy. Journal editors and reviewers might keep in mind these specific points, summarized in Table 2 and detailed hereafter, while judging the merit of hypotheses for publication. Keeping in mind the ethical principle of primum non nocere, a hypothesis should be published only if it is testable in a manner that is ethically appropriate. 46 Such hypotheses should be grounded in reality and lend themselves to further testing to either prove or disprove them. It must be considered that subsequent experiments to prove or disprove a hypothesis have an equal chance of failing or succeeding, akin to tossing a coin. A pre-conceived belief that a hypothesis is unlikely to be proven correct should not form the basis of rejection of such a hypothesis for publication. In this context, hypotheses generated after a thorough literature search to identify knowledge gaps or based on concrete clinical observations on a considerable number of patients (as opposed to random observations on a few patients) are more likely to be acceptable for publication by peer-reviewed journals. Also, hypotheses should be considered for publication or rejection based on their implications for science at large rather than whether the subsequent experiments to test them end up with results in favour of or against the original hypothesis.
Hypotheses form an important part of the scientific literature. The COVID-19 pandemic has reiterated the importance and relevance of hypotheses for dealing with public health emergencies and highlighted the need for evidence-based and ethical hypotheses. A good hypothesis is testable in a relevant study design, backed by preliminary evidence, and has positive ethical and clinical implications. General medical journals might consider publishing hypotheses as a specific article type to enable more rapid advancement of science.
Disclosure: The authors have no potential conflicts of interest to disclose.
Author Contributions:
- Data curation: Gasparyan AY, Misra DP, Zimba O, Yessirkepov M, Agarwal V, Kitas GD.
share this!
May 14, 2024
This article has been reviewed according to Science X's editorial process and policies . Editors have highlighted the following attributes while ensuring the content's credibility:
fact-checked
peer-reviewed publication
trusted source
How 'glowing' plants could help scientists predict flash drought
by Sally Younger, NASA
An unusual boost in plant productivity can foreshadow severe soil water loss, and NASA satellites are following the clues.
Flaring up rapidly and with little warning, the drought that gripped much of the United States in the summer of 2012 was one of the most extensive the country had seen since the years-long Dust Bowl of the 1930s. The "flash drought," stoked by extreme heat that baked the moisture from soil and plants, led to widespread crop failure and economic losses costing more than $30 billion.
While archetypal droughts may develop over seasons, flash droughts are marked by rapid drying. They can take hold within weeks and are tough to predict. In a recent study published in Geophysical Research Letters , a team led by scientists from NASA's Jet Propulsion Laboratory in Southern California was able to detect signs of flash droughts up to three months before onset. In the future, such advance notice could aid mitigation efforts.
How did the team do it? By following the glow.
A signal seen from space
During photosynthesis, when a plant absorbs sunlight to convert carbon dioxide and water into food, its chlorophyll will "leak" some unused photons. This faint glow is called solar-induced fluorescence, or SIF. The stronger the fluorescence, the more carbon dioxide a plant is taking from the atmosphere to power its growth.
While the glow is invisible to the naked eye , it can be detected by instruments aboard satellites such as NASA's Orbiting Carbon Obsevatory-2 (OCO-2). Launched in 2014, OCO-2 has observed the U.S. Midwest aglow during the growing season.
The researchers compared years of fluorescence data to an inventory of flash droughts that struck the U.S. between May and July from 2015 to 2020. They found a domino effect: In the weeks and months leading up to a flash drought, vegetation initially thrived as conditions turned warm and dry. The flourishing plants emitted an unusually strong fluorescence signal for the time of year.
But by gradually drawing down the water supply in the soil, the plants created a risk. When extreme temperatures hit, the already low moisture levels plummeted, and flash drought developed within days.
The team correlated the fluorescence measurements with moisture data from NASA's SMAP satellite. Short for Soil Moisture Active Passive, SMAP tracks changes in soil water by measuring the intensity of natural microwave emissions from Earth's surface.
The scientists found that the unusual fluorescence pattern correlated extremely well with soil moisture losses in the six to 12 weeks before a flash drought. A consistent pattern emerged across diverse landscapes, from the temperate forests of the Eastern U.S. to the Great Plains and Western shrublands.
For this reason, plant fluorescence "shows promise as a reliable early warning indicator of flash drought with enough lead time to take action," said Nicholas Parazoo, an Earth scientist at JPL and lead author of the recent study.
Jordan Gerth, a scientist with the National Weather Service Office of Observations who was not involved in the study, said he was pleased to see work on flash droughts, given our changing climate. He noted that agriculture benefits from predictability whenever possible.
While early warning can't eliminate the impacts of flash droughts, Gerth said, "Farmers and ranchers with advanced operations can better use water for irrigation to reduce crop impacts, avoid planting crops that are likely to fail, or plant a different type of crop to achieve the most ideal yield if they have weeks to months of lead time."
Tracking carbon emissions
In addition to trying to predict flash droughts, the scientists wanted to understand how these impact carbon emissions .
By converting carbon dioxide into food during photosynthesis, plants and trees are carbon "sinks," absorbing more CO 2 from the atmosphere than they release. Many kinds of ecosystems, including farmlands, play a role in the carbon cycle—the constant exchange of carbon atoms between the land, atmosphere, and ocean.
The scientists used carbon dioxide measurements from the OCO-2 satellite, along with advanced computer models, to track carbon uptake by vegetation before and after flash droughts. Heat-stressed plants absorb less CO 2 from the atmosphere, so the researchers expected to find more free carbon. What they found instead was a balancing act.
Warm temperatures prior to the onset of flash drought tempted plants to increase their carbon uptake compared to normal conditions. This anomalous uptake was, on average, sufficient to fully offset decreases in carbon uptake due to the hot conditions that ensued. The surprising finding could help improve carbon cycle model predictions.
Celebrating its 10th year in orbit this summer, the OCO-2 satellite maps natural and human-made carbon dioxide concentrations and vegetation fluorescence using three camera-like spectrometers tuned to detect the unique light signature of CO 2 . They measure the gas indirectly by tracking how much reflected sunlight it absorbs in a given column of air.
Journal information: Geophysical Research Letters
Provided by NASA
Explore further
Feedback to editors

Machine learning model uncovers new drug design opportunities
2 hours ago

Astronomers find the biggest known batch of planet ingredients swirling around young star

New GPS-based method can measure daily ice loss in Greenland
3 hours ago

New candidate genes for human male infertility found by analyzing gorillas' unusual reproductive system
4 hours ago

Study uncovers technologies that could unveil energy-efficient information processing and sophisticated data security
5 hours ago

Scientists develop an affordable sensor for lead contamination

Chemists succeed in synthesizing a molecule first predicted 20 years ago

New optical tweezers can trap large and irregularly shaped particles

An easy pill to swallow—new 3D printing research paves way for personalized medication
6 hours ago

Finding the chink in coronavirus's armor—experiment reveals how the main protease of SARS-CoV-2 protects itself
Relevant physicsforums posts, the secrets of prof. verschure's rosetta stones.
May 9, 2024
A very puzzling rock or a pallasite / mesmosiderite or a nothing burger
May 8, 2024
M 4.8 - Whitehouse Station, New Jersey, US
What is global warming due to, large eruption at ruang volcano, indonesia.
May 2, 2024
Tidal friction and global warming
Apr 20, 2024
More from Earth Sciences
Related Stories

For advance drought warning, look to the plants
Aug 5, 2022

What is a flash drought? An Earth scientist explains
Nov 10, 2022

Researcher studies worst western US megadrought in 1,200 years
Apr 18, 2024

Flash droughts are becoming more common in Australia. What's causing them?
Apr 9, 2024

Climate models often miss how plants respond to drought, research suggests
Feb 6, 2024

'Flash droughts' coming on faster, global study shows
Apr 1, 2022
Recommended for you

2023 was the hottest summer in 2,000 years, study finds
7 hours ago

How wildfires change soil chemistry

Chemical analysis of natural CO₂ rise over the last 50,000 years shows that today's rate is 10 times faster
May 13, 2024

New study examines the price tag of phasing-out coal

Research team develops an impact-based forecasting system for improved early flood warning
Let us know if there is a problem with our content.
Use this form if you have come across a typo, inaccuracy or would like to send an edit request for the content on this page. For general inquiries, please use our contact form . For general feedback, use the public comments section below (please adhere to guidelines ).
Please select the most appropriate category to facilitate processing of your request
Thank you for taking time to provide your feedback to the editors.
Your feedback is important to us. However, we do not guarantee individual replies due to the high volume of messages.
E-mail the story
Your email address is used only to let the recipient know who sent the email. Neither your address nor the recipient's address will be used for any other purpose. The information you enter will appear in your e-mail message and is not retained by Phys.org in any form.
Newsletter sign up
Get weekly and/or daily updates delivered to your inbox. You can unsubscribe at any time and we'll never share your details to third parties.
More information Privacy policy
Donate and enjoy an ad-free experience
We keep our content available to everyone. Consider supporting Science X's mission by getting a premium account.
E-mail newsletter

IMAGES
VIDEO
COMMENTS
Hypothesis: The migration of young people from rural areas due to the drought is leading to a decline in agricultural productivity in the Northern Cape. Background: Drought can lead to rural depopulation as people move to urban areas in search of work, potentially reducing agricultural productivity and worsening the effects of drought.
Hydrological models can have heuristic value in drought research, to formulate new theories and identify research directions, but formulated theories on driving processes should always be backed up by observations. ... our hypothesis is that climate is reflected in the sensitivity of parameters representing different mechanisms. However ...
1. Introduction. Climate change, altering teleconnection patterns, rising human water usage, and a history of human influence on the environment are all contributing to the emergence of new kinds of drought throughout the world, raising the possibility of transformative ecological impacts (Anderegg et al., 2020).Ecological drought is defined as a lack of available water that causes an organism ...
We hope to build upon previous studies by presenting a broader evaluation of the drought cascade hypothesis incorporating the following novel aspects: (a) a more comprehensive assessment of drought cascade through the terrestrial water cycle by using observations of all key variables from atmosphere to groundwater: VPD, precipitation, soil ...
the hypothesis that there was a signi cant difference in terms of drought impact for the three categories of farmers (i.e. small, medium and large scale), particularly with regard to the
Drought is a prolonged period of low precipitation that negatively impacts agriculture, animals, and people. Over the last decades, gradual changes in drought indices have been observed. Therefore, understanding and forecasting drought is essential to avoid its economic impacts and appropriate water resource planning and management. This paper presents a recent literature review, including a ...
In this paper, we address these challenges by developing a typology for understanding decision making about drought preparedness and response by synthesizing insights from 10 place-based research studies in the Western United States (Fig. 1; also see Supplemental Material, Table S1).We generate a typology with four elements that collectively describe how decisions about drought preparedness ...
To mitigate the effects of drought in water-stressed agro-ecological zones (AEZs), it is crucial to implement efficient monitoring of drought characteristics and establish proactive water-use strategies. The Western Cape (WC) province is being confronted with an escalating threat of diminished water availability due to unsustainable human activities. The objective of this study was to assess ...
Drought over the Western Cape was characterized by using the SPI (McKee et al., 1993) and the SPEI (Vicente-Serrano et al., 2010). Many studies (e.g. Meque and Abiodun, 2015; Ujeneza and Abiodun, 2015; Araujo et al., 2016) have demonstrated the usefulness of the SPI/SPEI in the Southern African context. The two indices are similar, and both are ...
Hypothesis. Environmental conditions will be associated with the distribution of drought-coping strategies. Note. Environmental conditions are measured using aridity index. R-squared=0.11, adjusted R-squared=0.05. Hypothesis was also analyzed using canonical correspondence analysis.
forecast and its uncertainty, and formulating the eventual drought warning. Here, one has to find a balance between two ends of the spectrum. On the one side is the "here is the data, explore and make your own interpretation" approach. In that case, an early warning system presents
Drought is a natural phenomenon which can cause widespread socio-economic and environmental impacts. Recent predictions suggest that drought frequency and intensity will increase in Southern Africa; therefore, there is a need for more scientific information on drought impacts and responses by vulnerable groups such as smallholder farmers. This scoping review examines the current state of ...
The Eastern Cape is of interest not just because of the severe drought that it is currently experiencing but also because its western parts lie near the transition zone between the summer (most of southern Africa) and winter rainfall regions (southwestern South Africa, Reason et al. 2002; Blamey et al. 2018b) and because it is a region of sharp vegetation, soil moisture and topographic ...
The testable research hypotheses can be summarised as follows: • Hypothesis 1: The impact of drought will be different amongst the farm categories (small-, medium- and large-scale farmers) under consideration; this will be tested using t-test statistics on the number of livestock lost and percentage increase in expenditure during the drought season.
Drought is a creeping phenomenon whose effects evolve with time, yet the start and end is often only clear in the hindsight. The present study assessed drought conditions using two categories of drought indicators computed from precipitation data sets measured by weather stations across the Western Cape Province, South Africa for the period 1985 to 2016. The first category was the Standardized ...
Drought characterization in South Africa under a changing climate
Found. Redirecting to https://research.assaf.org.za/assafserver/api/core/bitstreams/059a48d2-d31d-4085-b793-6fe8e36e5875/content
5. Phrase your hypothesis in three ways. To identify the variables, you can write a simple prediction in if…then form. The first part of the sentence states the independent variable and the second part states the dependent variable. If a first-year student starts attending more lectures, then their exam scores will improve.
One is based on the soil moisture stress (SMS) formulation and the other is based on leaf water potential ... The drought classification based on SSWEI from the offline land models and ERA5 exhibit certain spatial similarities regarding the occurrence of snow droughts and the progression of droughts over time. However, there are variations in ...
1.5 Null hypothesis 4 Chapter 2 - Literature Review 5 2.1 Introduction 5 2.2 Drought impact on the South African agricultural sector 6 2.2.1 Impact of drought on socio-economic aspects 7 2.2.2 Impact of drought on crop production 9 2.2.4 Impact of drought on livestock production 11 2.3 Drought implications on agricultural sector skills 12
The researcher states a hypothesis to be tested, formulates an analysis plan, analyzes sample data. according to the plan, and accepts or rejects the null hypothesis, based on r esults of the ...
Drought is a serious problem in the province considering that it is in a semi-arid area with low, unreliable rainfall (LDA, 2010). As a result of the severe drought, the province experienced reduced grazing land and water for livestock and irrigation. The province was worst affected by drought in the past eight years when dams were only ...
Formulating Hypotheses for Different Study Designs. Generating a testable working hypothesis is the first step towards conducting original research. Such research may prove or disprove the proposed hypothesis. Case reports, case series, online surveys and other observational studies, clinical trials, and narrative reviews help to generate ...
The hypothesis underpinning the study read as follows: "Water shortages in rural areas deprive the people of social justice and quality of life leading to poor livelihood strategies." The theoretical framework used for the study was the Basic Human Needs Approach and Systems Theory. These theories were used as lenses for the study.
The "flash drought," stoked by extreme heat that baked the moisture from soil and plants, led to widespread crop failure and economic losses costing more than $30 billion. While archetypal ...
Before formulating your null hypothesis, clearly define the scope of your research. This involves identifying the variables you will study and understanding the context of your business management ...
To uncover the internal mechanisms of various drought stress intensities affecting the soluble sugar content in organs and its regulation by endogenous abscisic acid (ABA), we selected the saplings of Platycladus orientalis, a typical tree species in the Beijing area, as our research subject. We investigated the correlation between tree soluble sugars and endogenous ABA in the organs ...