- Privacy Policy
Home » Observational Research – Methods and Guide

Observational Research – Methods and Guide
Table of Contents

Observational Research
Definition:
Observational research is a type of research method where the researcher observes and records the behavior of individuals or groups in their natural environment. In other words, the researcher does not intervene or manipulate any variables but simply observes and describes what is happening.
Observation
Observation is the process of collecting and recording data by observing and noting events, behaviors, or phenomena in a systematic and objective manner. It is a fundamental method used in research, scientific inquiry, and everyday life to gain an understanding of the world around us.
Types of Observational Research
Observational research can be categorized into different types based on the level of control and the degree of involvement of the researcher in the study. Some of the common types of observational research are:
Naturalistic Observation
In naturalistic observation, the researcher observes and records the behavior of individuals or groups in their natural environment without any interference or manipulation of variables.
Controlled Observation
In controlled observation, the researcher controls the environment in which the observation is taking place. This type of observation is often used in laboratory settings.
Participant Observation
In participant observation, the researcher becomes an active participant in the group or situation being observed. The researcher may interact with the individuals being observed and gather data on their behavior, attitudes, and experiences.
Structured Observation
In structured observation, the researcher defines a set of behaviors or events to be observed and records their occurrence.
Unstructured Observation
In unstructured observation, the researcher observes and records any behaviors or events that occur without predetermined categories.
Cross-Sectional Observation
In cross-sectional observation, the researcher observes and records the behavior of different individuals or groups at a single point in time.
Longitudinal Observation
In longitudinal observation, the researcher observes and records the behavior of the same individuals or groups over an extended period of time.
Data Collection Methods
Observational research uses various data collection methods to gather information about the behaviors and experiences of individuals or groups being observed. Some common data collection methods used in observational research include:
Field Notes
This method involves recording detailed notes of the observed behavior, events, and interactions. These notes are usually written in real-time during the observation process.
Audio and Video Recordings
Audio and video recordings can be used to capture the observed behavior and interactions. These recordings can be later analyzed to extract relevant information.
Surveys and Questionnaires
Surveys and questionnaires can be used to gather additional information from the individuals or groups being observed. This method can be used to validate or supplement the observational data.
Time Sampling
This method involves taking a snapshot of the observed behavior at pre-determined time intervals. This method helps to identify the frequency and duration of the observed behavior.
Event Sampling
This method involves recording specific events or behaviors that are of interest to the researcher. This method helps to provide detailed information about specific behaviors or events.
Checklists and Rating Scales
Checklists and rating scales can be used to record the occurrence and frequency of specific behaviors or events. This method helps to simplify and standardize the data collection process.
Observational Data Analysis Methods
Observational Data Analysis Methods are:
Descriptive Statistics
This method involves using statistical techniques such as frequency distributions, means, and standard deviations to summarize the observed behaviors, events, or interactions.
Qualitative Analysis
Qualitative analysis involves identifying patterns and themes in the observed behaviors or interactions. This analysis can be done manually or with the help of software tools.
Content Analysis
Content analysis involves categorizing and counting the occurrences of specific behaviors or events. This analysis can be done manually or with the help of software tools.
Time-series Analysis
Time-series analysis involves analyzing the changes in behavior or interactions over time. This analysis can help identify trends and patterns in the observed data.
Inter-observer Reliability Analysis
Inter-observer reliability analysis involves comparing the observations made by multiple observers to ensure the consistency and reliability of the data.
Multivariate Analysis
Multivariate analysis involves analyzing multiple variables simultaneously to identify the relationships between the observed behaviors, events, or interactions.
Event Coding
This method involves coding observed behaviors or events into specific categories and then analyzing the frequency and duration of each category.
Cluster Analysis
Cluster analysis involves grouping similar behaviors or events into clusters based on their characteristics or patterns.
Latent Class Analysis
Latent class analysis involves identifying subgroups of individuals or groups based on their observed behaviors or interactions.
Social network Analysis
Social network analysis involves mapping the social relationships and interactions between individuals or groups based on their observed behaviors.
The choice of data analysis method depends on the research question, the type of data collected, and the available resources. Researchers should choose the appropriate method that best fits their research question and objectives. It is also important to ensure the validity and reliability of the data analysis by using appropriate statistical tests and measures.
Applications of Observational Research
Observational research is a versatile research method that can be used in a variety of fields to explore and understand human behavior, attitudes, and preferences. Here are some common applications of observational research:
- Psychology : Observational research is commonly used in psychology to study human behavior in natural settings. This can include observing children at play to understand their social development or observing people’s reactions to stress to better understand how stress affects behavior.
- Marketing : Observational research is used in marketing to understand consumer behavior and preferences. This can include observing shoppers in stores to understand how they make purchase decisions or observing how people interact with advertisements to determine their effectiveness.
- Education : Observational research is used in education to study teaching and learning in natural settings. This can include observing classrooms to understand how teachers interact with students or observing students to understand how they learn.
- Anthropology : Observational research is commonly used in anthropology to understand cultural practices and beliefs. This can include observing people’s daily routines to understand their culture or observing rituals and ceremonies to better understand their significance.
- Healthcare : Observational research is used in healthcare to understand patient behavior and preferences. This can include observing patients in hospitals to understand how they interact with healthcare professionals or observing patients with chronic illnesses to better understand their daily routines and needs.
- Sociology : Observational research is used in sociology to understand social interactions and relationships. This can include observing people in public spaces to understand how they interact with others or observing groups to understand how they function.
- Ecology : Observational research is used in ecology to understand the behavior and interactions of animals and plants in their natural habitats. This can include observing animal behavior to understand their social structures or observing plant growth to understand their response to environmental factors.
- Criminology : Observational research is used in criminology to understand criminal behavior and the factors that contribute to it. This can include observing criminal activity in a particular area to identify patterns or observing the behavior of inmates to understand their experience in the criminal justice system.
Observational Research Examples
Here are some real-time observational research examples:
- A researcher observes and records the behaviors of a group of children on a playground to study their social interactions and play patterns.
- A researcher observes the buying behaviors of customers in a retail store to study the impact of store layout and product placement on purchase decisions.
- A researcher observes the behavior of drivers at a busy intersection to study the effectiveness of traffic signs and signals.
- A researcher observes the behavior of patients in a hospital to study the impact of staff communication and interaction on patient satisfaction and recovery.
- A researcher observes the behavior of employees in a workplace to study the impact of the work environment on productivity and job satisfaction.
- A researcher observes the behavior of shoppers in a mall to study the impact of music and lighting on consumer behavior.
- A researcher observes the behavior of animals in their natural habitat to study their social and feeding behaviors.
- A researcher observes the behavior of students in a classroom to study the effectiveness of teaching methods and student engagement.
- A researcher observes the behavior of pedestrians and cyclists on a city street to study the impact of infrastructure and traffic regulations on safety.
How to Conduct Observational Research
Here are some general steps for conducting Observational Research:
- Define the Research Question: Determine the research question and objectives to guide the observational research study. The research question should be specific, clear, and relevant to the area of study.
- Choose the appropriate observational method: Choose the appropriate observational method based on the research question, the type of data required, and the available resources.
- Plan the observation: Plan the observation by selecting the observation location, duration, and sampling technique. Identify the population or sample to be observed and the characteristics to be recorded.
- Train observers: Train the observers on the observational method, data collection tools, and techniques. Ensure that the observers understand the research question and objectives and can accurately record the observed behaviors or events.
- Conduct the observation : Conduct the observation by recording the observed behaviors or events using the data collection tools and techniques. Ensure that the observation is conducted in a consistent and unbiased manner.
- Analyze the data: Analyze the observed data using appropriate data analysis methods such as descriptive statistics, qualitative analysis, or content analysis. Validate the data by checking the inter-observer reliability and conducting statistical tests.
- Interpret the results: Interpret the results by answering the research question and objectives. Identify the patterns, trends, or relationships in the observed data and draw conclusions based on the analysis.
- Report the findings: Report the findings in a clear and concise manner, using appropriate visual aids and tables. Discuss the implications of the results and the limitations of the study.
When to use Observational Research
Here are some situations where observational research can be useful:
- Exploratory Research: Observational research can be used in exploratory studies to gain insights into new phenomena or areas of interest.
- Hypothesis Generation: Observational research can be used to generate hypotheses about the relationships between variables, which can be tested using experimental research.
- Naturalistic Settings: Observational research is useful in naturalistic settings where it is difficult or unethical to manipulate the environment or variables.
- Human Behavior: Observational research is useful in studying human behavior, such as social interactions, decision-making, and communication patterns.
- Animal Behavior: Observational research is useful in studying animal behavior in their natural habitats, such as social and feeding behaviors.
- Longitudinal Studies: Observational research can be used in longitudinal studies to observe changes in behavior over time.
- Ethical Considerations: Observational research can be used in situations where manipulating the environment or variables would be unethical or impractical.
Purpose of Observational Research
Observational research is a method of collecting and analyzing data by observing individuals or phenomena in their natural settings, without manipulating them in any way. The purpose of observational research is to gain insights into human behavior, attitudes, and preferences, as well as to identify patterns, trends, and relationships that may exist between variables.
The primary purpose of observational research is to generate hypotheses that can be tested through more rigorous experimental methods. By observing behavior and identifying patterns, researchers can develop a better understanding of the factors that influence human behavior, and use this knowledge to design experiments that test specific hypotheses.
Observational research is also used to generate descriptive data about a population or phenomenon. For example, an observational study of shoppers in a grocery store might reveal that women are more likely than men to buy organic produce. This type of information can be useful for marketers or policy-makers who want to understand consumer preferences and behavior.
In addition, observational research can be used to monitor changes over time. By observing behavior at different points in time, researchers can identify trends and changes that may be indicative of broader social or cultural shifts.
Overall, the purpose of observational research is to provide insights into human behavior and to generate hypotheses that can be tested through further research.
Advantages of Observational Research
There are several advantages to using observational research in different fields, including:
- Naturalistic observation: Observational research allows researchers to observe behavior in a naturalistic setting, which means that people are observed in their natural environment without the constraints of a laboratory. This helps to ensure that the behavior observed is more representative of the real-world situation.
- Unobtrusive : Observational research is often unobtrusive, which means that the researcher does not interfere with the behavior being observed. This can reduce the likelihood of the research being affected by the observer’s presence or the Hawthorne effect, where people modify their behavior when they know they are being observed.
- Cost-effective : Observational research can be less expensive than other research methods, such as experiments or surveys. Researchers do not need to recruit participants or pay for expensive equipment, making it a more cost-effective research method.
- Flexibility: Observational research is a flexible research method that can be used in a variety of settings and for a range of research questions. Observational research can be used to generate hypotheses, to collect data on behavior, or to monitor changes over time.
- Rich data : Observational research provides rich data that can be analyzed to identify patterns and relationships between variables. It can also provide context for behaviors, helping to explain why people behave in a certain way.
- Validity : Observational research can provide high levels of validity, meaning that the results accurately reflect the behavior being studied. This is because the behavior is being observed in a natural setting without interference from the researcher.
Disadvantages of Observational Research
While observational research has many advantages, it also has some limitations and disadvantages. Here are some of the disadvantages of observational research:
- Observer bias: Observational research is prone to observer bias, which is when the observer’s own beliefs and assumptions affect the way they interpret and record behavior. This can lead to inaccurate or unreliable data.
- Limited generalizability: The behavior observed in a specific setting may not be representative of the behavior in other settings. This can limit the generalizability of the findings from observational research.
- Difficulty in establishing causality: Observational research is often correlational, which means that it identifies relationships between variables but does not establish causality. This can make it difficult to determine if a particular behavior is causing an outcome or if the relationship is due to other factors.
- Ethical concerns: Observational research can raise ethical concerns if the participants being observed are unaware that they are being observed or if the observations invade their privacy.
- Time-consuming: Observational research can be time-consuming, especially if the behavior being observed is infrequent or occurs over a long period of time. This can make it difficult to collect enough data to draw valid conclusions.
- Difficulty in measuring internal processes: Observational research may not be effective in measuring internal processes, such as thoughts, feelings, and attitudes. This can limit the ability to understand the reasons behind behavior.
About the author

Muhammad Hassan
Researcher, Academic Writer, Web developer
You may also like

Explanatory Research – Types, Methods, Guide

Quantitative Research – Methods, Types and...

Quasi-Experimental Research Design – Types...

Qualitative Research – Methods, Analysis Types...

Exploratory Research – Types, Methods and...

Questionnaire – Definition, Types, and Examples
- Skip to main content
- Skip to primary sidebar
- Skip to footer
- QuestionPro

- Solutions Industries Gaming Automotive Sports and events Education Government Travel & Hospitality Financial Services Healthcare Cannabis Technology Use Case NPS+ Communities Audience Contactless surveys Mobile LivePolls Member Experience GDPR Positive People Science 360 Feedback Surveys
- Resources Blog eBooks Survey Templates Case Studies Training Help center
Home Market Research
Observational Research: What is, Types, Pros & Cons + Example

Researchers can gather customer data in a variety of ways, including surveys, interviews, and research. But not all data can be collected by asking questions because customers might not be conscious of their behaviors.
It is when observational research comes in. This research is a way to learn about people by observing them in their natural environment. This kind of research helps researchers figure out how people act in different situations and what things in the environment affect their actions.
This blog will teach you about observational research, including types and observation methods. Let’s get started.
What is observational research?
Observational research is a broad term for various non-experimental studies in which behavior is carefully watched and recorded.
The goal of this research is to describe a variable or a set of variables. More broadly, the goal is to capture specific individual, group, or setting characteristics.
Since it is non-experimental and uncontrolled, we cannot draw causal research conclusions from it. The observational data collected in research studies is frequently qualitative observation , but it can also be quantitative or both (mixed methods).
Types of observational research
Conducting observational research can take many different forms. There are various types of this research. These types are classified below according to how much a researcher interferes with or controls the environment.
Naturalistic observation
Taking notes on what is seen is the simplest form of observational research. A researcher makes no interference in naturalistic observation. It’s just watching how people act in their natural environments.
Importantly, there is no attempt to modify factors in naturalistic observation, as there would be when comparing data between a control group and an experimental group.
Case studiesCase studies
A case study is a sort of observational research that focuses on a single phenomenon. It is a naturalistic observation because it captures data in the field. But case studies focus on a specific point of reference, like a person or event, while other studies may have a wider scope and try to record everything that happens in the researcher’s eyes.
For example, a case study of a single businessman might try to find out how that person deals with a certain disease’s ups and down or loss.
Participant observation
Participant observation is similar to naturalistic observation, except that the researcher is a part of the natural environment they are studying. In such research, the researcher is also interested in rituals or cultural practices that can only be evaluated by sharing experiences.
For example, anyone can learn the basic rules of table Tennis by going to a game or following a team. Participant observation, on the other hand, lets people take part directly to learn more about how the team works and how the players relate to each other.
It usually includes the researcher joining a group to watch behavior they couldn’t see from afar. Participant observation can gather much information, from the interactions with the people being observed to the researchers’ thoughts.
Controlled observation
A more systematic structured observation entails recording the behaviors of research participants in a remote place. Case-control studies are more like experiments than other types of research, but they still use observational research methods. When researchers want to find out what caused a certain event, they might use a case-control study.
Longitudinal observation
This observational research is one of the most difficult and time-consuming because it requires watching people or events for a long time. Researchers should consider longitudinal observations when their research involves variables that can only be seen over time.
After all, you can’t get a complete picture of things like learning to read or losing weight in a single observation. Longitudinal studies keep an eye on the same people or events over a long period of time and look for changes or patterns in behavior.
Observational research methods
When doing this research, there are a few observational methods to remember to ensure that the research is done correctly. Along with other research methods, let’s learn some key research methods of it:
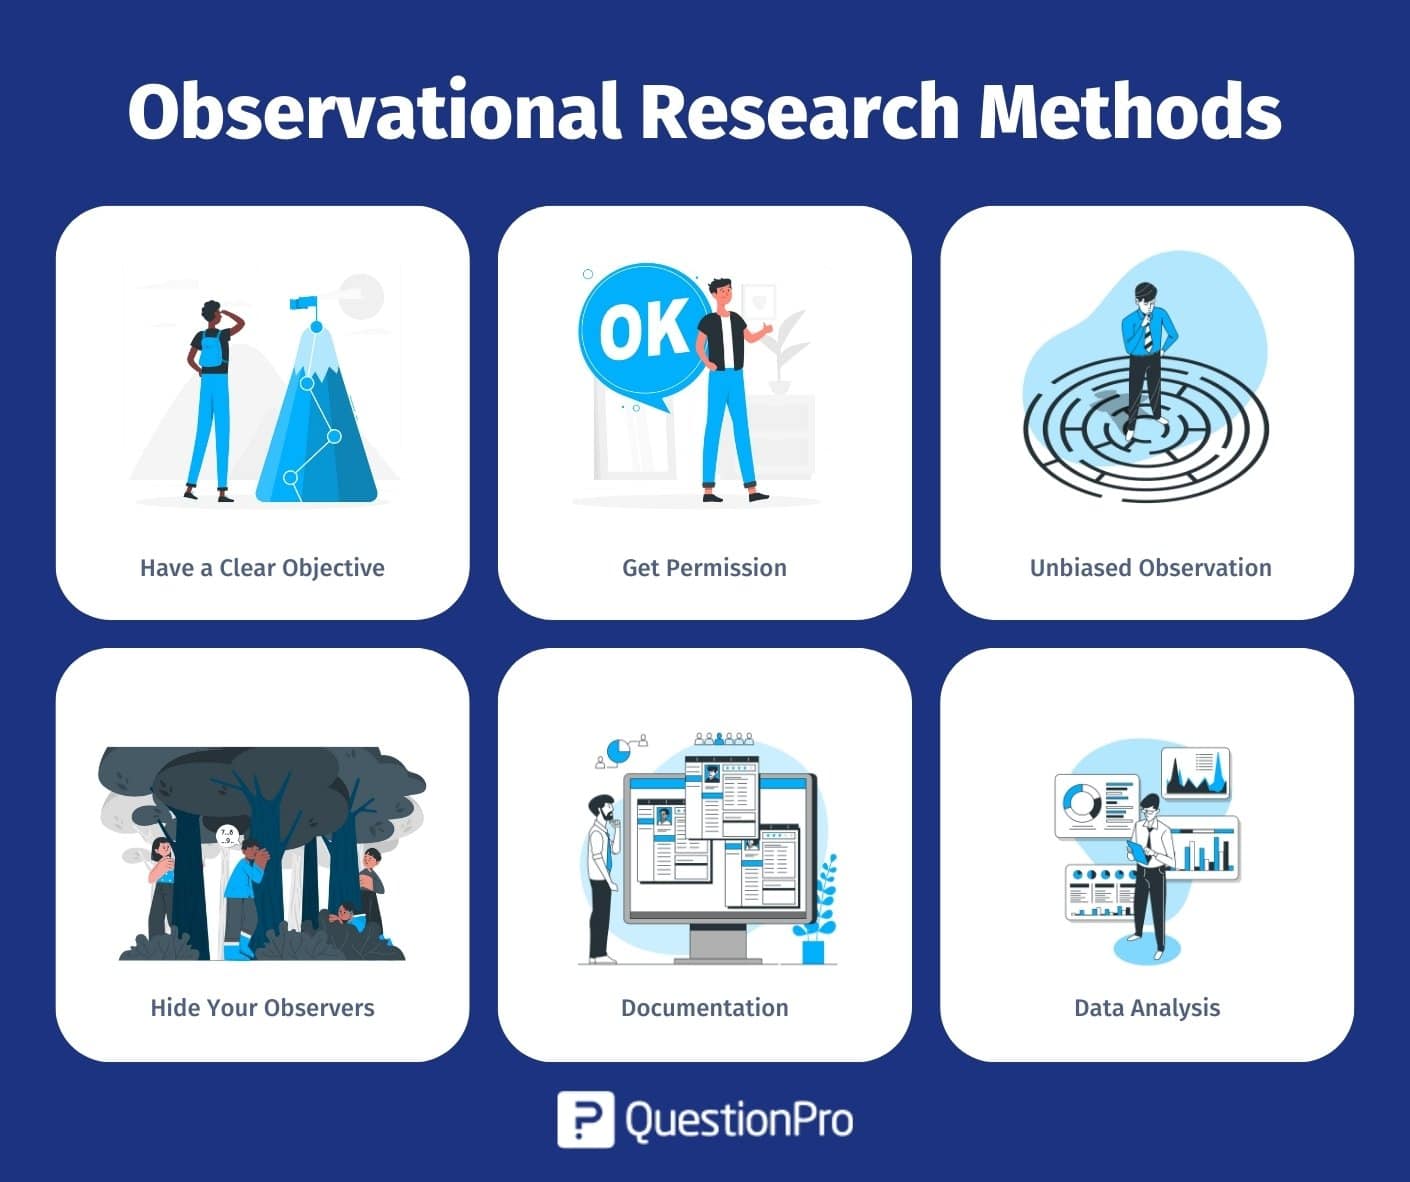
Have a clear objective
For an observational study to be helpful, it needs to have a clear goal. It will help guide the observations and ensure they focus on the right things.
Get permission
Get permission from your participants. Getting explicit permission from the people you will be watching is essential. It means letting them know that they will be watched, the observation’s goal, and how their data will be used.
Unbiased observation
It is important to make sure the observations are fair and unbiased. It can be done by keeping detailed notes of what is seen and not putting any personal meaning on the data.
Hide your observers
In the observation method, keep your observers hidden. The participants should be unaware of the observers to avoid potential bias in their actions.
Documentation
It is important to document the observations clearly and straightforwardly. It will allow others to examine the information and confirm the observational research findings.
Data analysis
Data analysis is the last method. The researcher will analyze the collected data to draw conclusions or confirm a hypothesis.
Pros and cons of observational research
Observational studies are a great way to learn more about how your customers use different parts of your business. There are so many pros and cons of observational research. Let’s have a look at them.
- It provides a practical application for a hypothesis. In other words, it can help make research more complete.
- You can see people acting alone or in groups, such as customers. So, you can answer a number of questions about how people act as customers.
- There is a chance of researcher bias in observational research. Experts say that this can be a very big problem.
- Some human activities and behaviors can be difficult to understand. We are unable to see memories or attitudes. In other words, there are numerous situations in which observation alone is inadequate.
Example of observational research
The researcher observes customers buying products in a mall. Assuming the product is soap, the researcher will observe how long the customer takes to decide whether he likes the packaging or comes to the mall with his decision already made based on advertisements.
If the customer takes their time making a decision, the researcher will conclude that packaging and information on the package affect purchase behavior. If a customer makes a quick decision, the decision is likely predetermined.
As a result, the researcher will recommend more and better advertisements in this case. All of these findings were obtained through simple observational research.
How to conduct observational research with QuestionPro?
QuestionPro can help with observational research by providing tools to collect and analyze data. It can help in the following ways:
Define the research goals and question types you want to answer with your observational study . Use QuestionPro’s customizable survey templates and questions to do a survey that fits your research goals and gets the necessary information.
You can distribute the survey to your target audience using QuestionPro’s online platform or by sending a link to the survey.
With QuestionPro’s real-time data analysis and reporting features, you can collect and look at the data as people fill out the survey. Use the advanced analytics tools in QuestionPro to see and understand the data and find insights and trends.
If you need to, you can export the data from QuestionPro into the analysis tools you like to use. Draw conclusions from the collected and analyzed data and answer the research questions that were asked at the beginning of the research.
For a deeper understanding of human behaviors and decision-making processes, explore the realm of Behavioral Research .
To summarize, observational research is an effective strategy for collecting data and getting insights into real-world phenomena. When done right, this research can give helpful information and help people make decisions.
QuestionPro is a valuable tool that can help with observational research by letting you create online surveys, analyze data in real time, make surveys your own, keep your data safe, and use advanced analytics tools.
To do this research with QuestionPro, researchers need to define their research goals, do a survey that matches their goals, send the survey to participants, collect and analyze the data, visualize and explain the results, export data if needed, and draw conclusions from the data collected.
By keeping in mind what has been said above, researchers can use QuestionPro to help with their observational research and gain valuable data. Try out QuestionPro today!
FREE TRIAL LEARN MORE
Frequently Asked Questions (FAQ)
Observational research is a method in which researchers observe and systematically record behaviors, events, or phenomena without directly manipulating them.
There are three main types of observational research: naturalistic observation, participant observation, and structured observation.
Naturalistic observation involves observing subjects in their natural environment without any interference.
MORE LIKE THIS

QuestionPro Thrive: A Space to Visualize & Share the Future of Technology
Jun 18, 2024

Relationship NPS Fails to Understand Customer Experiences — Tuesday CX

CX Platform: Top 13 CX Platforms to Drive Customer Success
Jun 17, 2024

How to Know Whether Your Employee Initiatives are Working
Other categories.
- Academic Research
- Artificial Intelligence
- Assessments
- Brand Awareness
- Case Studies
- Communities
- Consumer Insights
- Customer effort score
- Customer Engagement
- Customer Experience
- Customer Loyalty
- Customer Research
- Customer Satisfaction
- Employee Benefits
- Employee Engagement
- Employee Retention
- Friday Five
- General Data Protection Regulation
- Insights Hub
- Life@QuestionPro
- Market Research
- Mobile diaries
- Mobile Surveys
- New Features
- Online Communities
- Question Types
- Questionnaire
- QuestionPro Products
- Release Notes
- Research Tools and Apps
- Revenue at Risk
- Survey Templates
- Training Tips
- Tuesday CX Thoughts (TCXT)
- Uncategorized
- Video Learning Series
- What’s Coming Up
- Workforce Intelligence

The Ultimate Guide to Qualitative Research - Part 1: The Basics

- Introduction and overview
- What is qualitative research?
- What is qualitative data?
- Examples of qualitative data
- Qualitative vs. quantitative research
- Mixed methods
- Qualitative research preparation
- Theoretical perspective
- Theoretical framework
- Literature reviews
- Research question
- Conceptual framework
- Conceptual vs. theoretical framework
Data collection
- Qualitative research methods
- Focus groups
What is observational research?
Uses for observational research, observations in research, the different types of observational research, conducting observational studies, uses with other methods, challenges of observational studies.
- Case studies
- Ethnographical research
- Ethical considerations
- Confidentiality and privacy
- Power dynamics
- Reflexivity
Observational research
Observational research is a social research technique that involves the direct observation of phenomena in their natural setting.
An observational study is a non-experimental method to examine how research participants behave. Observational research is typically associated with qualitative methods , where the data ultimately require some reorganization and analysis .

Contemporary research is often associated with controlled experiments or randomized controlled trials, which involve testing or developing a theory in a controlled setting. Such an approach is appropriate for many physical and material sciences that rely on objective concepts such as the melting point of substances or the mass of objects. On the other hand, observational studies help capture socially constructed or subjective phenomena whose fundamental essence might change when taken out of their natural setting.
What is an example of observational research?
For example, imagine a study where you want to understand the actions and behaviors of single parents taking care of children. A controlled experiment might prove challenging, given the possibility that the behaviors of parents and their children will change if you isolate them in a lab or an otherwise unfamiliar context.
Instead, researchers pursuing such inquiries can observe participants in their natural environment, collecting data on what people do, say, and behave in interaction with others. Non-experimental research methods like observation are less about testing theories than learning something new to contribute to theories.
The goal of the observational study is to collect data about what people do and say. Observational data is helpful in several fields:
- market research
- health services research
- educational research
- user research
Observational studies are valuable in any domain where researchers want to learn about people's actions and behaviors in a natural setting. For example, observational studies in market research might seek out information about the target market of a product or service by identifying the needs or problems of prospective consumers. In medical contexts, observers might be interested in how patients cope with a particular medical treatment or interact with doctors and nurses under certain conditions.

Researchers may still be hung up on science being all about experiments to the point where they may overlook the empirical contribution that observations bring to research and theory. With that in mind, let's look at the strengths and weaknesses of observations in research .
Strengths of observational research
Observational research, especially those conducted in natural settings, can generate more insightful knowledge about social processes or rituals that one cannot fully understand by reading a plain-text description in a book or an online resource. Think about a cookbook with recipes, then think about a series of videos showing a cook making the same recipes. Both are informative, but the videos are often easier to understand as the cook can describe the recipe and show how to follow the steps at the same time. When you can observe what is happening, you can emulate the process for yourself.
Observing also allows researchers to create rich data about phenomena that cannot be explained through numbers. The quality of a theatrical performance, for example, cannot easily be reduced to a set of numbers. Qualitatively, a researcher can analyze aspects gleaned from observing that performance and create a working theory about the quality of that performance. Through data analysis, the researcher can identify patterns related to the aesthetics and creativity of the performance to provide a framework to judge the quality of other performances.
Weaknesses of observational research
Science is about organizing knowledge for the purposes of identifying the aspects of a concept or of determining cause-and-effect relationships between different phenomena. Experiments look to empirically accomplish these tasks by controlling certain variables to determine how other variables change under changing conditions. Those conducting observational research, on the other hand, exert no such control, which makes replication by other researchers difficult or even impossible when observing dynamic environments.
Observational studies take on various forms. There are various types of observational research, each of which has strengths and weaknesses. These types are organized below by the extent to which an experimenter intrudes upon or controls the environment.
Naturalistic observation
Naturalistic observation refers to a method where researchers study participants in their natural environment without manipulating variables or intervening in any way. It provides a realistic snapshot of behavior as it occurs in real-life settings, thereby enhancing ecological validity.

Examples of naturalistic observation include people-watching in public places, observing animal behaviors in the wild, and longitudinally studying children's social development at school. This method can reveal insights about behavior and relationships that might not surface in experimental designs, such as patterns of social interaction, routines, or responses to environmental changes.
Participant observation
Participant observation is similar to naturalistic observation, except that the researcher is part of the natural environment they are observing. In such studies, the researcher is also interested in rituals or cultural practices where they can only determine their value by actually experiencing them firsthand. For example, any individual can understand the basic rules of baseball by watching a game or following a team. Participant observation, on the other hand, allows for direct participation to develop a better sense of team dynamics and relationships among fellow players.
Most commonly, this process involves the researcher inserting themselves into a group to observe behavior that otherwise would not be accessible by observing from afar. Participant observation can capture rich data from the interactions with those who are observed to the reflections of the researchers themselves.
Controlled observation
A more structured observation involves capturing the behaviors of research participants in an isolated environment. Case-control studies have a greater resemblance to experimental research while still relying on observational research methods. Researchers may utilize a case-control study when they want to establish the causation of a particular phenomenon.
For example, a researcher may want to establish a structured observation of a control group and an experimental group, each with randomly assigned research participants, to observe the effects of variables such as distractions on people completing a particular task. By subjecting the experimental group to distractions such as noise and lights, researchers can observe the time it takes participants to complete a task and determine causation accordingly.
Longitudinal study
Among the different types of observational research, this observational method is quite arduous and time-consuming as it requires observation of people or events over extended periods. Researchers should consider longitudinal observations when their inquiry involves variables that can only be observed over time. After all, variables such as literacy development or weight loss cannot be fully captured in any particular moment of observation. Longitudinal studies keep track of the same research participants or events through multiple observations to document changes to or patterns in behavior.
A cohort study is a specific type of longitudinal study where researchers observe participants with similar traits (e.g., a similar risk factor or biological characteristic). Cohort studies aim to observe multiple participants over time to identify a relationship between observed phenomena and a common characteristic.
All forms of observational or field research benefit extensively from the special capabilities of qualitative research tools like ATLAS.ti . Our software can accommodate the major forms of data , such as text, audio, video, and images . The ATLAS.ti platform can help you organize all your observations , whatever method you employ.

Whatever your research, make it happen with ATLAS.ti.
Powerful analytical tools at your fingertips. Try for free by clicking here.
Like any other study design, observational studies begin by posing research questions . Inquiries common when employing observational methods include the study of different cultures, interactions between people from different communities, or people in particular circumstances warranting further study (e.g., people coping with a rare disease).
Generally, a research question that seeks to learn more about a relatively unfamiliar phenomenon would be best suited for observational research. On the other hand, quantitative methods or experimental research methods may be more suitable for inquiries where the theory about a social phenomenon is fairly established.
Study design
Study design for observational research involves thinking about who to observe, where they should be observed, and what the researcher should look for during observation. Many events can occur in a natural, dynamic environment in a short period, so it is challenging to document everything. If the researcher knows what they want to observe, they can pursue a structured observation which involves taking notes on a limited set of phenomena.
The actual data collection for an observational study can take several forms. Note-taking is common in observational research, where the researcher writes down what they see during the course of their observation. The goal of this method is to provide a record of the events that are observed to determine patterns and themes useful for theoretical development.

Observation can also involve taking pictures or recording audio for a richer understanding of social phenomena. Video recorded from observations can also provide data that the researcher can use to document the facial expressions, gestures, and other body language of research participants.
Note that there are ethical considerations when conducting observational research. Researchers should respect the privacy and confidentiality of their research participants to ensure they are not adversely affected by the research. Researchers should obtain informed consent from participants before any observation where possible.
Observational studies can be supplemented with other methods to further contextualize the research inquiry. Researchers can conduct interviews or focus groups with research participants to gather data about what they recall about their actions and behaviors in a natural setting. Focus groups, in particular, provide further opportunities to observe participants interacting with each other. In both cases, these research methods are ideal where the researcher needs to follow up with research participants about the evidence they've collected regarding their behaviors or actions.
As with many other methods in qualitative research , conducting an observational study is time-consuming. While experimental methods can quickly generate data , observational research relies on documenting events and interactions in detail that can be analyzed for theoretical development.
Unstructured data
One common critique of observational research is that it lacks the structure inherent to experimental research, which has concepts such as selection bias and interrater reliability to ensure research quality. On the other hand, qualitative research relies on the assumption that the study and its data are presented transparently and honestly . Under this principle, researchers are responsible for convincing their audiences that the assertions they make are connected empirically to the observations they have made and the data they have collected.
Researcher bias
In most qualitative research, but especially in observational research, the most important data collection instrument is the researcher themselves. This raises issues of bias and subjectivity influencing the collection and interpretation of the data.

Later in this guide, there will be discussion of reflexivity , a concept where the researcher comprehensively accounts for their place in the research relative to others in the environment. For now, it's important to know that social science researchers can and do adequately address critiques of researcher bias to maintain the empirical nature of their observational research.
Conduct your observational study with ATLAS.ti
From the inception of your study to disseminating to your research audience, get it all done with our powerful software platform. Start with a free trial.
Observation Method in Psychology: Naturalistic, Participant and Controlled
Saul Mcleod, PhD
Editor-in-Chief for Simply Psychology
BSc (Hons) Psychology, MRes, PhD, University of Manchester
Saul Mcleod, PhD., is a qualified psychology teacher with over 18 years of experience in further and higher education. He has been published in peer-reviewed journals, including the Journal of Clinical Psychology.
Learn about our Editorial Process
Olivia Guy-Evans, MSc
Associate Editor for Simply Psychology
BSc (Hons) Psychology, MSc Psychology of Education
Olivia Guy-Evans is a writer and associate editor for Simply Psychology. She has previously worked in healthcare and educational sectors.
On This Page:
The observation method in psychology involves directly and systematically witnessing and recording measurable behaviors, actions, and responses in natural or contrived settings without attempting to intervene or manipulate what is being observed.
Used to describe phenomena, generate hypotheses, or validate self-reports, psychological observation can be either controlled or naturalistic with varying degrees of structure imposed by the researcher.
There are different types of observational methods, and distinctions need to be made between:
1. Controlled Observations 2. Naturalistic Observations 3. Participant Observations
In addition to the above categories, observations can also be either overt/disclosed (the participants know they are being studied) or covert/undisclosed (the researcher keeps their real identity a secret from the research subjects, acting as a genuine member of the group).
In general, conducting observational research is relatively inexpensive, but it remains highly time-consuming and resource-intensive in data processing and analysis.
The considerable investments needed in terms of coder time commitments for training, maintaining reliability, preventing drift, and coding complex dynamic interactions place practical barriers on observers with limited resources.
Controlled Observation
Controlled observation is a research method for studying behavior in a carefully controlled and structured environment.
The researcher sets specific conditions, variables, and procedures to systematically observe and measure behavior, allowing for greater control and comparison of different conditions or groups.
The researcher decides where the observation will occur, at what time, with which participants, and in what circumstances, and uses a standardized procedure. Participants are randomly allocated to each independent variable group.
Rather than writing a detailed description of all behavior observed, it is often easier to code behavior according to a previously agreed scale using a behavior schedule (i.e., conducting a structured observation).
The researcher systematically classifies the behavior they observe into distinct categories. Coding might involve numbers or letters to describe a characteristic or the use of a scale to measure behavior intensity.
The categories on the schedule are coded so that the data collected can be easily counted and turned into statistics.
For example, Mary Ainsworth used a behavior schedule to study how infants responded to brief periods of separation from their mothers. During the Strange Situation procedure, the infant’s interaction behaviors directed toward the mother were measured, e.g.,
- Proximity and contact-seeking
- Contact maintaining
- Avoidance of proximity and contact
- Resistance to contact and comforting
The observer noted down the behavior displayed during 15-second intervals and scored the behavior for intensity on a scale of 1 to 7.

Sometimes participants’ behavior is observed through a two-way mirror, or they are secretly filmed. Albert Bandura used this method to study aggression in children (the Bobo doll studies ).
A lot of research has been carried out in sleep laboratories as well. Here, electrodes are attached to the scalp of participants. What is observed are the changes in electrical activity in the brain during sleep ( the machine is called an EEG ).
Controlled observations are usually overt as the researcher explains the research aim to the group so the participants know they are being observed.
Controlled observations are also usually non-participant as the researcher avoids direct contact with the group and keeps a distance (e.g., observing behind a two-way mirror).
- Controlled observations can be easily replicated by other researchers by using the same observation schedule. This means it is easy to test for reliability .
- The data obtained from structured observations is easier and quicker to analyze as it is quantitative (i.e., numerical) – making this a less time-consuming method compared to naturalistic observations.
- Controlled observations are fairly quick to conduct which means that many observations can take place within a short amount of time. This means a large sample can be obtained, resulting in the findings being representative and having the ability to be generalized to a large population.
Limitations
- Controlled observations can lack validity due to the Hawthorne effect /demand characteristics. When participants know they are being watched, they may act differently.
Naturalistic Observation
Naturalistic observation is a research method in which the researcher studies behavior in its natural setting without intervention or manipulation.
It involves observing and recording behavior as it naturally occurs, providing insights into real-life behaviors and interactions in their natural context.
Naturalistic observation is a research method commonly used by psychologists and other social scientists.
This technique involves observing and studying the spontaneous behavior of participants in natural surroundings. The researcher simply records what they see in whatever way they can.
In unstructured observations, the researcher records all relevant behavior with a coding system. There may be too much to record, and the behaviors recorded may not necessarily be the most important, so the approach is usually used as a pilot study to see what type of behaviors would be recorded.
Compared with controlled observations, it is like the difference between studying wild animals in a zoo and studying them in their natural habitat.
With regard to human subjects, Margaret Mead used this method to research the way of life of different tribes living on islands in the South Pacific. Kathy Sylva used it to study children at play by observing their behavior in a playgroup in Oxfordshire.
Collecting Naturalistic Behavioral Data
Technological advances are enabling new, unobtrusive ways of collecting naturalistic behavioral data.
The Electronically Activated Recorder (EAR) is a digital recording device participants can wear to periodically sample ambient sounds, allowing representative sampling of daily experiences (Mehl et al., 2012).
Studies program EARs to record 30-50 second sound snippets multiple times per hour. Although coding the recordings requires extensive resources, EARs can capture spontaneous behaviors like arguments or laughter.
EARs minimize participant reactivity since sampling occurs outside of awareness. This reduces the Hawthorne effect, where people change behavior when observed.
The SenseCam is another wearable device that passively captures images documenting daily activities. Though primarily used in memory research currently (Smith et al., 2014), systematic sampling of environments and behaviors via the SenseCam could enable innovative psychological studies in the future.
- By being able to observe the flow of behavior in its own setting, studies have greater ecological validity.
- Like case studies , naturalistic observation is often used to generate new ideas. Because it gives the researcher the opportunity to study the total situation, it often suggests avenues of inquiry not thought of before.
- The ability to capture actual behaviors as they unfold in real-time, analyze sequential patterns of interactions, measure base rates of behaviors, and examine socially undesirable or complex behaviors that people may not self-report accurately.
- These observations are often conducted on a micro (small) scale and may lack a representative sample (biased in relation to age, gender, social class, or ethnicity). This may result in the findings lacking the ability to generalize to wider society.
- Natural observations are less reliable as other variables cannot be controlled. This makes it difficult for another researcher to repeat the study in exactly the same way.
- Highly time-consuming and resource-intensive during the data coding phase (e.g., training coders, maintaining inter-rater reliability, preventing judgment drift).
- With observations, we do not have manipulations of variables (or control over extraneous variables), meaning cause-and-effect relationships cannot be established.
Participant Observation
Participant observation is a variant of the above (natural observations) but here, the researcher joins in and becomes part of the group they are studying to get a deeper insight into their lives.
If it were research on animals , we would now not only be studying them in their natural habitat but be living alongside them as well!
Leon Festinger used this approach in a famous study into a religious cult that believed that the end of the world was about to occur. He joined the cult and studied how they reacted when the prophecy did not come true.
Participant observations can be either covert or overt. Covert is where the study is carried out “undercover.” The researcher’s real identity and purpose are kept concealed from the group being studied.
The researcher takes a false identity and role, usually posing as a genuine member of the group.
On the other hand, overt is where the researcher reveals his or her true identity and purpose to the group and asks permission to observe.
- It can be difficult to get time/privacy for recording. For example, researchers can’t take notes openly with covert observations as this would blow their cover. This means they must wait until they are alone and rely on their memory. This is a problem as they may forget details and are unlikely to remember direct quotations.
- If the researcher becomes too involved, they may lose objectivity and become biased. There is always the danger that we will “see” what we expect (or want) to see. This problem is because they could selectively report information instead of noting everything they observe. Thus reducing the validity of their data.
Recording of Data
With controlled/structured observation studies, an important decision the researcher has to make is how to classify and record the data. Usually, this will involve a method of sampling.
In most coding systems, codes or ratings are made either per behavioral event or per specified time interval (Bakeman & Quera, 2011).
The three main sampling methods are:
Event-based coding involves identifying and segmenting interactions into meaningful events rather than timed units.
For example, parent-child interactions may be segmented into control or teaching events to code. Interval recording involves dividing interactions into fixed time intervals (e.g., 6-15 seconds) and coding behaviors within each interval (Bakeman & Quera, 2011).
Event recording allows counting event frequency and sequencing while also potentially capturing event duration through timed-event recording. This provides information on time spent on behaviors.
Coding Systems
The coding system should focus on behaviors, patterns, individual characteristics, or relationship qualities that are relevant to the theory guiding the study (Wampler & Harper, 2014).
Codes vary in how much inference is required, from concrete observable behaviors like frequency of eye contact to more abstract concepts like degree of rapport between a therapist and client (Hill & Lambert, 2004). More inference may reduce reliability.
Macroanalytic coding systems
Macroanalytic coding systems involve rating or summarizing behaviors using larger coding units and broader categories that reflect patterns across longer periods of interaction rather than coding small or discrete behavioral acts.
For example, a macroanalytic coding system may rate the overall degree of therapist warmth or level of client engagement globally for an entire therapy session, requiring the coders to summarize and infer these constructs across the interaction rather than coding smaller behavioral units.
These systems require observers to make more inferences (more time-consuming) but can better capture contextual factors, stability over time, and the interdependent nature of behaviors (Carlson & Grotevant, 1987).
Microanalytic coding systems
Microanalytic coding systems involve rating behaviors using smaller, more discrete coding units and categories.
For example, a microanalytic system may code each instance of eye contact or head nodding during a therapy session. These systems code specific, molecular behaviors as they occur moment-to-moment rather than summarizing actions over longer periods.
Microanalytic systems require less inference from coders and allow for analysis of behavioral contingencies and sequential interactions between therapist and client. However, they are more time-consuming and expensive to implement than macroanalytic approaches.
Mesoanalytic coding systems
Mesoanalytic coding systems attempt to balance macro- and micro-analytic approaches.
In contrast to macroanalytic systems that summarize behaviors in larger chunks, mesoanalytic systems use medium-sized coding units that target more specific behaviors or interaction sequences (Bakeman & Quera, 2017).
For example, a mesoanalytic system may code each instance of a particular type of therapist statement or client emotional expression. However, mesoanalytic systems still use larger units than microanalytic approaches coding every speech onset/offset.
The goal of balancing specificity and feasibility makes mesoanalytic systems well-suited for many research questions (Morris et al., 2014). Mesoanalytic codes can preserve some sequential information while remaining efficient enough for studies with adequate but limited resources.
For instance, a mesoanalytic couple interaction coding system could target key behavior patterns like validation sequences without coding turn-by-turn speech.
In this way, mesoanalytic coding allows reasonable reliability and specificity without requiring extensive training or observation. The mid-level focus offers a pragmatic compromise between depth and breadth in analyzing interactions.
Preventing Coder Drift
Coder drift results in a measurement error caused by gradual shifts in how observations get rated according to operational definitions, especially when behavioral codes are not clearly specified.
This type of error creeps in when coders fail to regularly review what precise observations constitute or do not constitute the behaviors being measured.
Preventing drift refers to taking active steps to maintain consistency and minimize changes or deviations in how coders rate or evaluate behaviors over time. Specifically, some key ways to prevent coder drift include:
- Operationalize codes : It is essential that code definitions unambiguously distinguish what interactions represent instances of each coded behavior.
- Ongoing training : Returning to those operational definitions through ongoing training serves to recalibrate coder interpretations and reinforce accurate recognition. Having regular “check-in” sessions where coders practice coding the same interactions allows monitoring that they continue applying codes reliably without gradual shifts in interpretation.
- Using reference videos : Coders periodically coding the same “gold standard” reference videos anchors their judgments and calibrate against original training. Without periodic anchoring to original specifications, coder decisions tend to drift from initial measurement reliability.
- Assessing inter-rater reliability : Statistical tracking that coders maintain high levels of agreement over the course of a study, not just at the start, flags any declines indicating drift. Sustaining inter-rater agreement requires mitigating this common tendency for observer judgment change during intensive, long-term coding tasks.
- Recalibrating through discussion : Having meetings for coders to discuss disagreements openly explores reasons judgment shifts may be occurring over time. Consensus on the application of codes is restored.
- Adjusting unclear codes : If reliability issues persist, revisiting and refining ambiguous code definitions or anchors can eliminate inconsistencies arising from coder confusion.
Essentially, the goal of preventing coder drift is maintaining standardization and minimizing unintentional biases that may slowly alter how observational data gets rated over periods of extensive coding.
Through the upkeep of skills, continuing calibration to benchmarks, and monitoring consistency, researchers can notice and correct for any creeping changes in coder decision-making over time.
Reducing Observer Bias
Observational research is prone to observer biases resulting from coders’ subjective perspectives shaping the interpretation of complex interactions (Burghardt et al., 2012). When coding, personal expectations may unconsciously influence judgments. However, rigorous methods exist to reduce such bias.
Coding Manual
A detailed coding manual minimizes subjectivity by clearly defining what behaviors and interaction dynamics observers should code (Bakeman & Quera, 2011).
High-quality manuals have strong theoretical and empirical grounding, laying out explicit coding procedures and providing rich behavioral examples to anchor code definitions (Lindahl, 2001).
Clear delineation of the frequency, intensity, duration, and type of behaviors constituting each code facilitates reliable judgments and reduces ambiguity for coders. Application risks inconsistency across raters without clarity on how codes translate to observable interaction.
Coder Training
Competent coders require both interpersonal perceptiveness and scientific rigor (Wampler & Harper, 2014). Training thoroughly reviews the theoretical basis for coded constructs and teaches the coding system itself.
Multiple “gold standard” criterion videos demonstrate code ranges that trainees independently apply. Coders then meet weekly to establish reliability of 80% or higher agreement both among themselves and with master criterion coding (Hill & Lambert, 2004).
Ongoing training manages coder drift over time. Revisions to unclear codes may also improve reliability. Both careful selection and investment in rigorous training increase quality control.
Blind Methods
To prevent bias, coders should remain unaware of specific study predictions or participant details (Burghardt et al., 2012). Separate data gathering versus coding teams helps maintain blinding.
Coders should be unaware of study details or participant identities that could bias coding (Burghardt et al., 2012).
Separate teams collecting data versus coding data can reduce bias.
In addition, scheduling procedures can prevent coders from rating data collected directly from participants with whom they have had personal contact. Maintaining coder independence and blinding enhances objectivity.

Bakeman, R., & Quera, V. (2017). Sequential analysis and observational methods for the behavioral sciences. Cambridge University Press.
Burghardt, G. M., Bartmess-LeVasseur, J. N., Browning, S. A., Morrison, K. E., Stec, C. L., Zachau, C. E., & Freeberg, T. M. (2012). Minimizing observer bias in behavioral studies: A review and recommendations. Ethology, 118 (6), 511-517.
Hill, C. E., & Lambert, M. J. (2004). Methodological issues in studying psychotherapy processes and outcomes. In M. J. Lambert (Ed.), Bergin and Garfield’s handbook of psychotherapy and behavior change (5th ed., pp. 84–135). Wiley.
Lindahl, K. M. (2001). Methodological issues in family observational research. In P. K. Kerig & K. M. Lindahl (Eds.), Family observational coding systems: Resources for systemic research (pp. 23–32). Lawrence Erlbaum Associates.
Mehl, M. R., Robbins, M. L., & Deters, F. G. (2012). Naturalistic observation of health-relevant social processes: The electronically activated recorder methodology in psychosomatics. Psychosomatic Medicine, 74 (4), 410–417.
Morris, A. S., Robinson, L. R., & Eisenberg, N. (2014). Applying a multimethod perspective to the study of developmental psychology. In H. T. Reis & C. M. Judd (Eds.), Handbook of research methods in social and personality psychology (2nd ed., pp. 103–123). Cambridge University Press.
Smith, J. A., Maxwell, S. D., & Johnson, G. (2014). The microstructure of everyday life: Analyzing the complex choreography of daily routines through the automatic capture and processing of wearable sensor data. In B. K. Wiederhold & G. Riva (Eds.), Annual Review of Cybertherapy and Telemedicine 2014: Positive Change with Technology (Vol. 199, pp. 62-64). IOS Press.
Traniello, J. F., & Bakker, T. C. (2015). The integrative study of behavioral interactions across the sciences. In T. K. Shackelford & R. D. Hansen (Eds.), The evolution of sexuality (pp. 119-147). Springer.
Wampler, K. S., & Harper, A. (2014). Observational methods in couple and family assessment. In H. T. Reis & C. M. Judd (Eds.), Handbook of research methods in social and personality psychology (2nd ed., pp. 490–502). Cambridge University Press.
Related Articles

Research Methodology
Phenomenology In Qualitative Research

Ethnography In Qualitative Research

Narrative Analysis In Qualitative Research

Thematic Analysis: A Step by Step Guide

Metasynthesis Of Qualitative Research

Grounded Theory In Qualitative Research: A Practical Guide
What Are Observational Studies?
Observational studies are research studies in which researchers collect information from participants or look at data that was already collected.
In observational studies, researchers follow groups of people over a period of time. Depending on the study, groups may include healthy people, people with cancer, or people who are at high risk for developing cancer, such as those with a family history.
How observational studies help cancer research
Observational studies can help researchers learn more about cancer and suggest paths for future research that may lead to insights such as:
- how specific cancers form, grow, and spread
- genes that cause cancer to develop at a high rate within certain groups
- exposures or behaviors that may increase the risk of cancer
- clues to help prevent cancer
- clues that lead to new treatments
- patterns and trends of new cancer cases
- the experiences of people who have had cancer in the past
Types of observational studies
There are different types of observational studies. Two examples include natural history and longitudinal studies.
Natural history studies look at certain conditions in people with cancer or people who are at a high risk of developing cancer. Researchers often collect information about a person’s and their family’s medical history, as well as blood, saliva, and tumor samples that may be studied to learn more about how cancer develops or how it responds to treatment.
Longitudinal studies gather data on people over time, often to see whether those with different exposures have different cancer outcomes. Examples include those with different kinds of diets, smoking history, or other traits.
What to expect

Find Observation Studies >
View a studies that are looking for people now.
What you do as part of an observational study depends on the study. In some studies, you may be asked to fill out surveys or questionnaires. Researchers may ask about your medical history and that of your family. They might ask you to provide tissue samples, such as blood, saliva, or—if you have cancer—your tumor. Some studies may require your medical records. For some studies you might be asked to come in for an in-person visit with the research team.
Depending on the study, you might provide samples and information just once, or many times over the course of the study.
Possible risks and benefits
There are few risks to taking part in an observational research study. One possible risk is the accidental release of information from your health records. To prevent this from happening, there are security measures in place to protect your privacy. A benefit of taking part in an observational study is knowing that you will help doctors learn more about cancer. These studies help create a foundation that can lead to further research that may help people with cancer in the future. Or they might help people in the future avoid cancer.
Your rights
Before you join a study, the research team will make sure you understand:
- why the study is being done
- what will happen during the study
- how it may affect your daily life
Once you understand the study and decide to take part, you will be asked to sign a consent form. But even after you sign the form, you can change your mind and leave the study at any time.
Costs and expenses
Most observational studies are free to those who take part. As you think about joining an observational study, be sure to ask the study team about costs.
- Skip to secondary menu
- Skip to main content
- Skip to primary sidebar
Statistics By Jim
Making statistics intuitive
Observational Study vs Experiment with Examples
By Jim Frost 1 Comment
Comparing Observational Studies vs Experiments
Observational studies and experiments are two standard research methods for understanding the world. Both research designs collect data and use statistical analysis to understand relationships between variables. Beyond that commonality, they are vastly different and have dissimilar sets of pros and cons.

Experiments are controlled investigations where researchers actively manipulate one or more variables to observe the effect on another variable, all within a carefully controlled environment. Researchers must be able to control the treatment condition each subject experiences. Experiments typically use randomization to equalize the experimental groups at the start of the study to control potential confounders.
In this post, we’ll compare an observational study vs experiment, highlighting their definitions, strengths, and when to use them effectively. I work through an example showing how a study can use either approach to answer the same research question.
Learn more about Experimental Design: Definition and Types and Confounding Variable Bias .
Strengths of Observational Studies
Real-World Insights : Observational studies reflect real-world scenarios, providing valuable insights into how things naturally occur. Well-designed observational studies have high external validity , specifically ecological validity .
Does Not Require Randomization : Observational studies shine when researchers can’t manipulate treatment conditions or ethical constraints prevent randomization. For example, studying the long-term effects of smoking requires an observational approach because we can’t ethically assign people to smoke or abstain from smoking.
Cost-Effective : Observational studies are generally less expensive and time-consuming than experiments.
Longitudinal Research : They are well-suited for long-term studies or those tracking trends over time.
Strengths of Experiments
Causality : Experiments are the gold standard for establishing causality. By controlling variables and randomly assigning treatment conditions to participants, researchers can confidently attribute changes to the manipulated factor . Well-designed experiments have high internal validity . Learn more about Correlation vs. Causation: Understanding the Differences .
Controlled Environment : Experiments offer a controlled environment, reducing the influence of confounding variables and enhancing the reliability of results.
Replicability : Well-designed experiments are often easier to replicate, increasing researchers’ ability to compare and confirm results.
Randomization : Random assignment in experiments minimizes bias, ensuring all groups are comparable. Learn more about Random Assignment in Experiments .
When to Choose Observational Studies vs Experiments
Observational studies vs experiments are two vital tools in the statistician ’s arsenal, each offering unique advantages.
Experiments excel in establishing causality, controlling variables, and minimizing the impact of confounders. However, they are more expensive and randomly assigning subjects to the treatment groups is impossible in some settings. Learn more about Randomized Controlled Trials .
Meanwhile, observational studies provide real-world insights, are less expensive, and do not require randomization but are more susceptible to the effects of confounders. Identifying causal relationships is problematic in these studies. Learn more about Observational Studies: Definition & Examples and Correlational Studies .
Observational studies can be prospective or retrospective studies . On the other hand, randomized experiments must be prospective studies .
The choice between an observational study vs experiment hinges on your research objectives, the context in which you’re working, available time and resources, and your ability to assign subjects to the experimental groups and control other variables.
If you’re looking for a middle ground choice between observational studies vs experiments, consider using a quasi-experimental design. These methods don’t require you to randomly assign participants to the experimental groups and still allow you to draw better causal conclusions about an intervention than an observational study. Learn more about Quasi-Experimental Design Overview & Examples .
Understanding their strengths and differences will help you make the right choice for your statistical endeavors.
Observational Study vs Experiment Example
Suppose you want to assess the health benefits of consuming a daily multivitamin. Let’s explore how an observational study vs experiment would evaluate this research question and their pros and cons.
An observational study will recruit subjects and have them record their vitamin consumption, various health outcomes, and, ideally, record confounding variables. The participants choose whether or not to take vitamins during the study based on their existing habits. Some medical measurements might occur in a lab setting, but researchers are not administering treatments (vitamins). Then, using statistical models, researchers can evaluate the relationship between vitamin consumption and health outcomes while controlling for potential confounders they measured.
An experiment will recruit subjects and then randomly assign them to the treatment group that takes daily vitamins or the control group taking a placebo . Randomization controls all confounders whether the researchers know of them or not. Finally, the researchers compare the treatment to the control group. Learn more about Control Groups in Experiments .
Most vitamin studies are observational because the randomization process would be challenging to implement, and it raises ethical concerns in this context. The random assignment process would override the participants’ preferences for taking vitamins by randomly forcing subjects to consume vitamins or placebos for decades . That’s how long it takes for the differences in health outcomes to manifest. Consequently, enforcing the rigid protocol for so long would be difficult and unethical.
For an observational study, a critical downside is that the pre-existing differences between those who do and do not take vitamins daily comprise a pretty long list of health-related habits and medical measures. Any of them can potentially explain the difference in outcomes instead of the vitamin consumption!
As you can see, using an observational study vs experiment involves many tradeoffs! Let’s close with a table that summarizes the differences.
Differences between an Observational Study and Experiment
| Causality | Hard to establish | Strongly supports causality |
| Control of Variables | Limited or no control | High control |
| Real-World Insights | Strong | Limited |
| Cost and Time Efficiency | Cost-effective and less time-consuming | Expensive and time-intensive |
| Confounding Variables | Highly susceptible | Low susceptibility |
| Randomization | Not used | Standard practice |
| Longitudinal Research | Well-suited | Possible but often challenging |
Share this:

Reader Interactions

October 22, 2023 at 11:17 pm
Well stated: ” Both research designs collect data and use statistical analysis to understand relationships between variables” I was not familiar with the terms research designs. 😀
PS, I am already receiving all your wonderful mailing. I binge-read them every few weeks. I am planning on getting your other two books when I can. Thanks, and Cheers!
Comments and Questions Cancel reply

- school Campus Bookshelves
- menu_book Bookshelves
- perm_media Learning Objects
- login Login
- how_to_reg Request Instructor Account
- hub Instructor Commons
Margin Size
- Download Page (PDF)
- Download Full Book (PDF)
- Periodic Table
- Physics Constants
- Scientific Calculator
- Reference & Cite
- Tools expand_more
- Readability
selected template will load here
This action is not available.
6.5: Observational Research
- Last updated
- Save as PDF
- Page ID 16122
\( \newcommand{\vecs}[1]{\overset { \scriptstyle \rightharpoonup} {\mathbf{#1}} } \)
\( \newcommand{\vecd}[1]{\overset{-\!-\!\rightharpoonup}{\vphantom{a}\smash {#1}}} \)
\( \newcommand{\id}{\mathrm{id}}\) \( \newcommand{\Span}{\mathrm{span}}\)
( \newcommand{\kernel}{\mathrm{null}\,}\) \( \newcommand{\range}{\mathrm{range}\,}\)
\( \newcommand{\RealPart}{\mathrm{Re}}\) \( \newcommand{\ImaginaryPart}{\mathrm{Im}}\)
\( \newcommand{\Argument}{\mathrm{Arg}}\) \( \newcommand{\norm}[1]{\| #1 \|}\)
\( \newcommand{\inner}[2]{\langle #1, #2 \rangle}\)
\( \newcommand{\Span}{\mathrm{span}}\)
\( \newcommand{\id}{\mathrm{id}}\)
\( \newcommand{\kernel}{\mathrm{null}\,}\)
\( \newcommand{\range}{\mathrm{range}\,}\)
\( \newcommand{\RealPart}{\mathrm{Re}}\)
\( \newcommand{\ImaginaryPart}{\mathrm{Im}}\)
\( \newcommand{\Argument}{\mathrm{Arg}}\)
\( \newcommand{\norm}[1]{\| #1 \|}\)
\( \newcommand{\Span}{\mathrm{span}}\) \( \newcommand{\AA}{\unicode[.8,0]{x212B}}\)
\( \newcommand{\vectorA}[1]{\vec{#1}} % arrow\)
\( \newcommand{\vectorAt}[1]{\vec{\text{#1}}} % arrow\)
\( \newcommand{\vectorB}[1]{\overset { \scriptstyle \rightharpoonup} {\mathbf{#1}} } \)
\( \newcommand{\vectorC}[1]{\textbf{#1}} \)
\( \newcommand{\vectorD}[1]{\overrightarrow{#1}} \)
\( \newcommand{\vectorDt}[1]{\overrightarrow{\text{#1}}} \)
\( \newcommand{\vectE}[1]{\overset{-\!-\!\rightharpoonup}{\vphantom{a}\smash{\mathbf {#1}}}} \)
Learning Objectives
- List the various types of observational research methods and distinguish between each
- Describe the strengths and weakness of each observational research method.
What Is Observational Research?
The term observational research is used to refer to several different types of non-experimental studies in which behavior is systematically observed and recorded. The goal of observational research is to describe a variable or set of variables. More generally, the goal is to obtain a snapshot of specific characteristics of an individual, group, or setting. As described previously, observational research is non-experimental because nothing is manipulated or controlled, and as such we cannot arrive at causal conclusions using this approach. The data that are collected in observational research studies are often qualitative in nature but they may also be quantitative or both (mixed-methods). There are several different types of observational research designs that will be described below.
Naturalistic Observation
Naturalistic observation is an observational method that involves observing people’s behavior in the environment in which it typically occurs. Thus naturalistic observation is a type of field research (as opposed to a type of laboratory research). Jane Goodall’s famous research on chimpanzees is a classic example of naturalistic observation. Dr. Goodall spent three decades observing chimpanzees in their natural environment in East Africa. She examined such things as chimpanzee’s social structure, mating patterns, gender roles, family structure, and care of offspring by observing them in the wild. However, naturalistic observation could more simply involve observing shoppers in a grocery store, children on a school playground, or psychiatric inpatients in their wards. Researchers engaged in naturalistic observation usually make their observations as unobtrusively as possible so that participants are not aware that they are being studied. Such an approach is called disguised naturalistic observation. Ethically, this method is considered to be acceptable if the participants remain anonymous and the behavior occurs in a public setting where people would not normally have an expectation of privacy. Grocery shoppers putting items into their shopping carts, for example, are engaged in public behavior that is easily observable by store employees and other shoppers. For this reason, most researchers would consider it ethically acceptable to observe them for a study. On the other hand, one of the arguments against the ethicality of the naturalistic observation of “bathroom behavior” discussed earlier in the book is that people have a reasonable expectation of privacy even in a public restroom and that this expectation was violated.
In cases where it is not ethical or practical to conduct disguised naturalistic observation, researchers can conduct undisguised naturalistic observation where the participants are made aware of the researcher presence and monitoring of their behavior. However, one concern with undisguised naturalistic observation is reactivity. Reactivity refers to when a measure changes participants’ behavior. In the case of undisguised naturalistic observation, the concern with reactivity is that when people know they are being observed and studied, they may act differently than they normally would. For instance, you may act much differently in a bar if you know that someone is observing you and recording your behaviors and this would invalidate the study. So disguised observation is less reactive and therefore can have higher validity because people are not aware that their behaviors are being observed and recorded. However, we now know that people often become used to being observed and with time they begin to behave naturally in the researcher’s presence. In other words, over time people habituate to being observed. Think about reality shows like Big Brother or Survivor where people are constantly being observed and recorded. While they may be on their best behavior at first, in a fairly short amount of time they are, flirting, having sex, wearing next to nothing, screaming at each other, and at times acting like complete fools in front of the entire nation.
Participant Observation
Another approach to data collection in observational research is participant observation. In participant observation , researchers become active participants in the group or situation they are studying. Participant observation is very similar to naturalistic observation in that it involves observing people’s behavior in the environment in which it typically occurs. As with naturalistic observation, the data that is collected can include interviews (usually unstructured), notes based on their observations and interactions, documents, photographs, and other artifacts. The only difference between naturalistic observation and participant observation is that researchers engaged in participant observation become active members of the group or situations they are studying. The basic rationale for participant observation is that there may be important information that is only accessible to, or can be interpreted only by, someone who is an active participant in the group or situation. Like naturalistic observation, participant observation can be either disguised or undisguised. In disguised participant observation, the researchers pretend to be members of the social group they are observing and conceal their true identity as researchers. In contrast with undisguised participant observation, the researchers become a part of the group they are studying and they disclose their true identity as researchers to the group under investigation. Once again there are important ethical issues to consider with disguised participant observation. First no informed consent can be obtained and second passive deception is being used. The researcher is passively deceiving the participants by intentionally withholding information about their motivations for being a part of the social group they are studying. But sometimes disguised participation is the only way to access a protective group (like a cult). Further, disguised participant observation is less prone to reactivity than undisguised participant observation.
Rosenhan’s study (1973) [1] of the experience of people in a psychiatric ward would be considered disguised participant observation because Rosenhan and his pseudopatients were admitted into psychiatric hospitals on the pretense of being patients so that they could observe the way that psychiatric patients are treated by staff. The staff and other patients were unaware of their true identities as researchers.
Another example of participant observation comes from a study by sociologist Amy Wilkins (published in Social Psychology Quarterly ) on a university-based religious organization that emphasized how happy its members were (Wilkins, 2008) [2] . Wilkins spent 12 months attending and participating in the group’s meetings and social events, and she interviewed several group members. In her study, Wilkins identified several ways in which the group “enforced” happiness—for example, by continually talking about happiness, discouraging the expression of negative emotions, and using happiness as a way to distinguish themselves from other groups.
One of the primary benefits of participant observation is that the researcher is in a much better position to understand the viewpoint and experiences of the people they are studying when they are apart of the social group. The primary limitation with this approach is that the mere presence of the observer could affect the behavior of the people being observed. While this is also a concern with naturalistic observation when researchers because active members of the social group they are studying, additional concerns arise that they may change the social dynamics and/or influence the behavior of the people they are studying. Similarly, if the researcher acts as a participant observer there can be concerns with biases resulting from developing relationships with the participants. Concretely, the researcher may become less objective resulting in more experimenter bias.
Structured Observation
Another observational method is structured observation. Here the investigator makes careful observations of one or more specific behaviors in a particular setting that is more structured than the settings used in naturalistic and participant observation. Often the setting in which the observations are made is not the natural setting, rather the researcher may observe people in the laboratory environment. Alternatively, the researcher may observe people in a natural setting (like a classroom setting) that they have structured some way, for instance by introducing some specific task participants are to engage in or by introducing a specific social situation or manipulation. Structured observation is very similar to naturalistic observation and participant observation in that in all cases researchers are observing naturally occurring behavior, however, the emphasis in structured observation is on gathering quantitative rather than qualitative data. Researchers using this approach are interested in a limited set of behaviors. This allows them to quantify the behaviors they are observing. In other words, structured observation is less global than naturalistic and participant observation because the researcher engaged in structured observations is interested in a small number of specific behaviors. Therefore, rather than recording everything that happens, the researcher only focuses on very specific behaviors of interest.
Structured observation is very similar to naturalistic observation and participant observation in that in all cases researchers are observing naturally occurring behavior, however, the emphasis in structured observation is on gathering quantitative rather than qualitative data. Researchers using this approach are interested in a limited set of behaviors. This allows them to quantify the behaviors they are observing. In other words, structured observation is less global than naturalistic and participant observation because the researcher engaged in structured observations is interested in a small number of specific behaviors. Therefore, rather than recording everything that happens, the researcher only focuses on very specific behaviors of interest.
Researchers Robert Levine and Ara Norenzayan used structured observation to study differences in the “pace of life” across countries (Levine & Norenzayan, 1999) [3] . One of their measures involved observing pedestrians in a large city to see how long it took them to walk 60 feet. They found that people in some countries walked reliably faster than people in other countries. For example, people in Canada and Sweden covered 60 feet in just under 13 seconds on average, while people in Brazil and Romania took close to 17 seconds. When structured observation takes place in the complex and even chaotic “real world,” the questions of when, where, and under what conditions the observations will be made, and who exactly will be observed are important to consider. Levine and Norenzayan described their sampling process as follows:
“Male and female walking speed over a distance of 60 feet was measured in at least two locations in main downtown areas in each city. Measurements were taken during main business hours on clear summer days. All locations were flat, unobstructed, had broad sidewalks, and were sufficiently uncrowded to allow pedestrians to move at potentially maximum speeds. To control for the effects of socializing, only pedestrians walking alone were used. Children, individuals with obvious physical handicaps, and window-shoppers were not timed. Thirty-five men and 35 women were timed in most cities.” (p. 186). Precise specification of the sampling process in this way makes data collection manageable for the observers, and it also provides some control over important extraneous variables. For example, by making their observations on clear summer days in all countries, Levine and Norenzayan controlled for effects of the weather on people’s walking speeds. In Levine and Norenzayan’s study, measurement was relatively straightforward. They simply measured out a 60-foot distance along a city sidewalk and then used a stopwatch to time participants as they walked over that distance.
As another example, researchers Robert Kraut and Robert Johnston wanted to study bowlers’ reactions to their shots, both when they were facing the pins and then when they turned toward their companions (Kraut & Johnston, 1979) [4] . But what “reactions” should they observe? Based on previous research and their own pilot testing, Kraut and Johnston created a list of reactions that included “closed smile,” “open smile,” “laugh,” “neutral face,” “look down,” “look away,” and “face cover” (covering one’s face with one’s hands). The observers committed this list to memory and then practiced by coding the reactions of bowlers who had been videotaped. During the actual study, the observers spoke into an audio recorder, describing the reactions they observed. Among the most interesting results of this study was that bowlers rarely smiled while they still faced the pins. They were much more likely to smile after they turned toward their companions, suggesting that smiling is not purely an expression of happiness but also a form of social communication.
When the observations require a judgment on the part of the observers—as in Kraut and Johnston’s study—this process is often described as coding . Coding generally requires clearly defining a set of target behaviors. The observers then categorize participants individually in terms of which behavior they have engaged in and the number of times they engaged in each behavior. The observers might even record the duration of each behavior. The target behaviors must be defined in such a way that different observers code them in the same way. This difficulty with coding is the issue of interrater reliability, as mentioned in Chapter 4. Researchers are expected to demonstrate the interrater reliability of their coding procedure by having multiple raters code the same behaviors independently and then showing that the different observers are in close agreement. Kraut and Johnston, for example, video recorded a subset of their participants’ reactions and had two observers independently code them. The two observers showed that they agreed on the reactions that were exhibited 97% of the time, indicating good interrater reliability.
One of the primary benefits of structured observation is that it is far more efficient than naturalistic and participant observation. Since the researchers are focused on specific behaviors this reduces time and expense. Also, often times the environment is structured to encourage the behaviors of interested which again means that researchers do not have to invest as much time in waiting for the behaviors of interest to naturally occur. Finally, researchers using this approach can clearly exert greater control over the environment. However, when researchers exert more control over the environment it may make the environment less natural which decreases external validity. It is less clear for instance whether structured observations made in a laboratory environment will generalize to a real world environment. Furthermore, since researchers engaged in structured observation are often not disguised there may be more concerns with reactivity.
Case Studies
A case study is an in-depth examination of an individual. Sometimes case studies are also completed on social units (e.g., a cult) and events (e.g., a natural disaster). Most commonly in psychology, however, case studies provide a detailed description and analysis of an individual. Often the individual has a rare or unusual condition or disorder or has damage to a specific region of the brain.
Like many observational research methods, case studies tend to be more qualitative in nature. Case study methods involve an in-depth, and often a longitudinal examination of an individual. Depending on the focus of the case study, individuals may or may not be observed in their natural setting. If the natural setting is not what is of interest, then the individual may be brought into a therapist’s office or a researcher’s lab for study. Also, the bulk of the case study report will focus on in-depth descriptions of the person rather than on statistical analyses. With that said some quantitative data may also be included in the write-up of a case study. For instance, an individuals’ depression score may be compared to normative scores or their score before and after treatment may be compared. As with other qualitative methods, a variety of different methods and tools can be used to collect information on the case. For instance, interviews, naturalistic observation, structured observation, psychological testing (e.g., IQ test), and/or physiological measurements (e.g., brain scans) may be used to collect information on the individual.
HM is one of the most notorious case studies in psychology. HM suffered from intractable and very severe epilepsy. A surgeon localized HM’s epilepsy to his medial temporal lobe and in 1953 he removed large sections of his hippocampus in an attempt to stop the seizures. The treatment was a success, in that it resolved his epilepsy and his IQ and personality were unaffected. However, the doctors soon realized that HM exhibited a strange form of amnesia, called anterograde amnesia. HM was able to carry out a conversation and he could remember short strings of letters, digits, and words. Basically, his short term memory was preserved. However, HM could not commit new events to memory. He lost the ability to transfer information from his short-term memory to his long term memory, something memory researchers call consolidation. So while he could carry on a conversation with someone, he would completely forget the conversation after it ended. This was an extremely important case study for memory researchers because it suggested that there’s a dissociation between short-term memory and long-term memory, it suggested that these were two different abilities sub-served by different areas of the brain. It also suggested that the temporal lobes are particularly important for consolidating new information (i.e., for transferring information from short-term memory to long-term memory).
The history of psychology is filled with influential cases studies, such as Sigmund Freud’s description of “Anna O.” (see below) and John Watson and Rosalie Rayner’s description of Little Albert (Watson & Rayner, 1920) [5] , who learned to fear a white rat—along with other furry objects—when the researchers made a loud noise while he was playing with the rat.
The Case of “Anna O.”
Sigmund Freud used the case of a young woman he called “Anna O.” to illustrate many principles of his theory of psychoanalysis (Freud, 1961) [6] . (Her real name was Bertha Pappenheim, and she was an early feminist who went on to make important contributions to the field of social work.) Anna had come to Freud’s colleague Josef Breuer around 1880 with a variety of odd physical and psychological symptoms. One of them was that for several weeks she was unable to drink any fluids. According to Freud,
She would take up the glass of water that she longed for, but as soon as it touched her lips she would push it away like someone suffering from hydrophobia.…She lived only on fruit, such as melons, etc., so as to lessen her tormenting thirst. (p. 9)
But according to Freud, a breakthrough came one day while Anna was under hypnosis.
[S]he grumbled about her English “lady-companion,” whom she did not care for, and went on to describe, with every sign of disgust, how she had once gone into this lady’s room and how her little dog—horrid creature!—had drunk out of a glass there. The patient had said nothing, as she had wanted to be polite. After giving further energetic expression to the anger she had held back, she asked for something to drink, drank a large quantity of water without any difficulty, and awoke from her hypnosis with the glass at her lips; and thereupon the disturbance vanished, never to return. (p.9)
Freud’s interpretation was that Anna had repressed the memory of this incident along with the emotion that it triggered and that this was what had caused her inability to drink. Furthermore, her recollection of the incident, along with her expression of the emotion she had repressed, caused the symptom to go away.
As an illustration of Freud’s theory, the case study of Anna O. is quite effective. As evidence for the theory, however, it is essentially worthless. The description provides no way of knowing whether Anna had really repressed the memory of the dog drinking from the glass, whether this repression had caused her inability to drink, or whether recalling this “trauma” relieved the symptom. It is also unclear from this case study how typical or atypical Anna’s experience was.

Case studies are useful because they provide a level of detailed analysis not found in many other research methods and greater insights may be gained from this more detailed analysis. As a result of the case study, the researcher may gain a sharpened understanding of what might become important to look at more extensively in future more controlled research. Case studies are also often the only way to study rare conditions because it may be impossible to find a large enough sample to individuals with the condition to use quantitative methods. Although at first glance a case study of a rare individual might seem to tell us little about ourselves, they often do provide insights into normal behavior. The case of HM provided important insights into the role of the hippocampus in memory consolidation. However, it is important to note that while case studies can provide insights into certain areas and variables to study, and can be useful in helping develop theories, they should never be used as evidence for theories. In other words, case studies can be used as inspiration to formulate theories and hypotheses, but those hypotheses and theories then need to be formally tested using more rigorous quantitative methods.
The reason case studies shouldn’t be used to provide support for theories is that they suffer from problems with internal and external validity. Case studies lack the proper controls that true experiments contain. As such they suffer from problems with internal validity, so they cannot be used to determine causation. For instance, during HM’s surgery, the surgeon may have accidentally lesioned another area of HM’s brain (indeed questioning into the possibility of a separate brain lesion began after HM’s death and dissection of his brain) and that lesion may have contributed to his inability to consolidate new information. The fact is, with case studies we cannot rule out these sorts of alternative explanations. So as with all observational methods case studies do not permit determination of causation. In addition, because case studies are often of a single individual, and typically a very abnormal individual, researchers cannot generalize their conclusions to other individuals. Recall that with most research designs there is a trade-off between internal and external validity, with case studies, however, there are problems with both internal validity and external validity. So there are limits both to the ability to determine causation and to generalize the results. A final limitation of case studies is that ample opportunity exists for the theoretical biases of the researcher to color or bias the case description. Indeed, there have been accusations that the woman who studied HM destroyed a lot of her data that were not published and she has been called into question for destroying contradictory data that didn’t support her theory about how memories are consolidated. There is a fascinating New York Times article that describes some of the controversies that ensued after HM’s death and analysis of his brain that can be found at: https://www.nytimes.com/2016/08/07/m...mber.html?_r=0
Archival Research
Another approach that is often considered observational research is the use of archival research which involves analyzing data that have already been collected for some other purpose. An example is a study by Brett Pelham and his colleagues on “implicit egotism”—the tendency for people to prefer people, places, and things that are similar to themselves (Pelham, Carvallo, & Jones, 2005) [7] . In one study, they examined Social Security records to show that women with the names Virginia, Georgia, Louise, and Florence were especially likely to have moved to the states of Virginia, Georgia, Louisiana, and Florida, respectively.
As with naturalistic observation, measurement can be more or less straightforward when working with archival data. For example, counting the number of people named Virginia who live in various states based on Social Security records is relatively straightforward. But consider a study by Christopher Peterson and his colleagues on the relationship between optimism and health using data that had been collected many years before for a study on adult development (Peterson, Seligman, & Vaillant, 1988) [8] . In the 1940s, healthy male college students had completed an open-ended questionnaire about difficult wartime experiences. In the late 1980s, Peterson and his colleagues reviewed the men’s questionnaire responses to obtain a measure of explanatory style—their habitual ways of explaining bad events that happen to them. More pessimistic people tend to blame themselves and expect long-term negative consequences that affect many aspects of their lives, while more optimistic people tend to blame outside forces and expect limited negative consequences. To obtain a measure of explanatory style for each participant, the researchers used a procedure in which all negative events mentioned in the questionnaire responses, and any causal explanations for them were identified and written on index cards. These were given to a separate group of raters who rated each explanation in terms of three separate dimensions of optimism-pessimism. These ratings were then averaged to produce an explanatory style score for each participant. The researchers then assessed the statistical relationship between the men’s explanatory style as undergraduate students and archival measures of their health at approximately 60 years of age. The primary result was that the more optimistic the men were as undergraduate students, the healthier they were as older men. Pearson’s r was +.25.
This method is an example of content analysis —a family of systematic approaches to measurement using complex archival data. Just as structured observation requires specifying the behaviors of interest and then noting them as they occur, content analysis requires specifying keywords, phrases, or ideas and then finding all occurrences of them in the data. These occurrences can then be counted, timed (e.g., the amount of time devoted to entertainment topics on the nightly news show), or analyzed in a variety of other ways.
Key Takeaways
- There are several different approaches to observational research including naturalistic observation, participant observation, structured observation, case studies, and archival research.
- Naturalistic observation is used to observe people in their natural setting, participant observation involves becoming an active member of the group being observed, structured observation involves coding a small number of behaviors in a quantitative manner, case studies are typically used to collect in-depth information on a single individual, and archival research involves analysing existing data.
- Describe one problem related to internal validity.
- Describe one problem related to external validity.
- Generate one hypothesis suggested by the case study that might be interesting to test in a systematic single-subject or group study.
- Rosenhan, D. L. (1973). On being sane in insane places. Science, 179 , 250–258.
- Wilkins, A. (2008). “Happier than Non-Christians”: Collective emotions and symbolic boundaries among evangelical Christians. Social Psychology Quarterly, 71 , 281–301.
- Levine, R. V., & Norenzayan, A. (1999). The pace of life in 31 countries. Journal of Cross-Cultural Psychology, 30 , 178–205.
- Kraut, R. E., & Johnston, R. E. (1979). Social and emotional messages of smiling: An ethological approach. Journal of Personality and Social Psychology, 37 , 1539–1553.
- Watson, J. B., & Rayner, R. (1920). Conditioned emotional reactions. Journal of Experimental Psychology, 3 , 1–14.
- Freud, S. (1961). Five lectures on psycho-analysis . New York, NY: Norton.
- Pelham, B. W., Carvallo, M., & Jones, J. T. (2005). Implicit egotism. Current Directions in Psychological Science, 14 , 106–110.
- Peterson, C., Seligman, M. E. P., & Vaillant, G. E. (1988). Pessimistic explanatory style is a risk factor for physical illness: A thirty-five year longitudinal study. Journal of Personality and Social Psychology, 55 , 23–27.

- Research Process
What is Observational Study Design and Types
- 4 minute read
- 122.5K views
Table of Contents
Most people think of a traditional experimental design when they consider research and published research papers. There is, however, a type of research that is more observational in nature, and it is appropriately referred to as “observational studies.”
There are many valuable reasons to utilize an observational study design. But, just as in research experimental design, different methods can be used when you’re considering this type of study. In this article, we’ll look at the advantages and disadvantages of an observational study design, as well as the 3 types of observational studies.
What is Observational Study Design?
An observational study is when researchers are looking at the effect of some type of intervention, risk, a diagnostic test or treatment, without trying to manipulate who is, or who isn’t, exposed to it.
This differs from an experimental study, where the scientists are manipulating who is exposed to the treatment, intervention, etc., by having a control group, or those who are not exposed, and an experimental group, or those who are exposed to the intervention, treatment, etc. In the best studies, the groups are randomized, or chosen by chance.
Any evidence derived from systematic reviews is considered the best in the hierarchy of evidence, which considers which studies are deemed the most reliable. Next would be any evidence that comes from randomized controlled trials. Cohort studies and case studies follow, in that order.
Cohort studies and case studies are considered observational in design, whereas the randomized controlled trial would be an experimental study.
Let’s take a closer look at the different types of observational study design.
The 3 types of Observational Studies
The different types of observational studies are used for different reasons. Selecting the best type for your research is critical to a successful outcome. One of the main reasons observational studies are used is when a randomized experiment would be considered unethical. For example, a life-saving medication used in a public health emergency. They are also used when looking at aetiology, or the cause of a condition or disease, as well as the treatment of rare conditions.
Case Control Observational Study
Researchers in case control studies identify individuals with an existing health issue or condition, or “cases,” along with a similar group without the condition, or “controls.” These two groups are then compared to identify predictors and outcomes. This type of study is helpful to generate a hypothesis that can then be researched.
Cohort Observational Study
This type of observational study is often used to help understand cause and effect. A cohort observational study looks at causes, incidence and prognosis, for example. A cohort is a group of people who are linked in a particular way, for example, a birth cohort would include people who were born within a specific period of time. Scientists might compare what happens to the members of the cohort who have been exposed to some variable to what occurs with members of the cohort who haven’t been exposed.
Cross Sectional Observational Study
Unlike a cohort observational study, a cross sectional observational study does not explore cause and effect, but instead looks at prevalence. Here you would look at data from a particular group at one very specific period of time. Researchers would simply observe and record information about something present in the population, without manipulating any variables or interventions. These types of studies are commonly used in psychology, education and social science.
Advantages and Disadvantages of Observational Study Design
Observational study designs have the distinct advantage of allowing researchers to explore answers to questions where a randomized controlled trial, or RCT, would be unethical. Additionally, if the study is focused on a rare condition, studying existing cases as compared to non-affected individuals might be the most effective way to identify possible causes of the condition. Likewise, if very little is known about a condition or circumstance, a cohort study would be a good study design choice.
A primary advantage to the observational study design is that they can generally be completed quickly and inexpensively. A RCT can take years before the data is compiled and available. RCTs are more complex and involved, requiring many more logistics and details to iron out, whereas an observational study can be more easily designed and completed.
The main disadvantage of observational study designs is that they’re more open to dispute than an RCT. Of particular concern would be confounding biases. This is when a cohort might share other characteristics that affect the outcome versus the outcome stated in the study. An example would be that people who practice good sleeping habits have less heart disease. But, maybe those who practice effective sleeping habits also, in general, eat better and exercise more.
Language Editing Plus Service
Need help with your research writing? With our Language Editing Plus service , we’ll help you improve the flow and writing of your paper, including UNLIMITED editing support. Use the simulator below to check the price for your manuscript, using the total number of words of the document.

Clinical Questions: PICO and PEO Research

Paper Retraction: Meaning and Main Reasons
You may also like.

Descriptive Research Design and Its Myriad Uses

Five Common Mistakes to Avoid When Writing a Biomedical Research Paper

Making Technical Writing in Environmental Engineering Accessible

To Err is Not Human: The Dangers of AI-assisted Academic Writing

When Data Speak, Listen: Importance of Data Collection and Analysis Methods

Choosing the Right Research Methodology: A Guide for Researchers

Why is data validation important in research?

Writing a good review article
Input your search keywords and press Enter.
Have a language expert improve your writing
Run a free plagiarism check in 10 minutes, generate accurate citations for free.
- Knowledge Base
Methodology
- What Is Qualitative Observation? | Definition & Examples
What Is Qualitative Observation? | Definition & Examples
Published on March 18, 2023 by Tegan George . Revised on June 22, 2023.
Qualitative observation is a research method where the characteristics or qualities of a phenomenon are described without using any quantitative measurements or data. Rather, the observation is based on the observer’s subjective interpretation of what they see, hear, smell, taste, or feel.
Qualitative observations can be done using various methods, including direct observation, interviews , focus groups , or case studies . They can provide rich and detailed information about the behavior, attitudes, perceptions, and experiences of individuals or groups.
Table of contents
When to use qualitative observation, examples of qualitative observation, types of qualitative observations, advantages and disadvantages of qualitative observations, other interesting articles, frequently asked questions.
Qualitative observation is a type of observational study , often used in conjunction with other types of research through triangulation . It is often used in fields like social sciences, education, healthcare, marketing, and design. This type of study is especially well suited for gaining rich and detailed insights into complex and/or subjective phenomena.
A qualitative observation could be a good fit for your research if:
- You are conducting exploratory research . If the goal of your research is to gain a better understanding of a phenomenon, object, or situation, qualitative observation is a good place to start.
- When your research topic is complex, subjective, or cannot be examined numerically. Qualitative observation is often able to capture the complexity and subjectivity of human behavior, particularly for topics like emotions, attitudes, perceptions, or cultural practices. These may not be quantifiable or measurable through other methods.
- You are relying on triangulation within your research approach. Qualitative observation is a solid addition to triangulation approaches, where multiple sources of data are used to validate and verify research findings.
Receive feedback on language, structure, and formatting
Professional editors proofread and edit your paper by focusing on:
- Academic style
- Vague sentences
- Style consistency
See an example

Qualitative observation is commonly used in marketing to study consumer behavior, preferences, and attitudes towards products or services.
During the focus group, you focus particularly on qualitative observations, taking note of the participants’ facial expressions, body language, word choice, and tone of voice.
Qualitative observation is often also used in design fields, to better understand user needs, preferences, and behaviors. This can aid in the development of products and services that better meet user needs.
You are particularly focused on any usability issues that could impact customer satisfaction. You run a series of testing sessions, focusing on reactions like facial expressions, body language, and verbal feedback.
There are several types of qualitative observation. Here are some of the most common types to help you choose the best one for your work.
| Type | Definition | Example |
|---|---|---|
| The researcher observes how the participants respond to their environment in “real-life” settings but does not influence their behavior in any way | Observing monkeys in a zoo enclosure | |
| Also occurs in “real-life” settings. Here, the researcher immerses themself in the participant group over a period of time | Spending a few months in a hospital with patients suffering from a particular illness | |
| Covert observation | Hinges on the fact that the participants do not know they are being observed | Observing interactions in public spaces, like bus rides or parks |
| Investigates a person or group of people over time, with the idea that close investigation can later be to other people or groups | Observing a child or group of children over the course of their time in elementary school |
Qualitative observations are a great choice of research method for some projects, but they definitely have their share of disadvantages to consider.
Advantages of qualitative observations
- Qualitative observations allow you to generate rich and nuanced qualitative data —aiding you in understanding a phenomenon or object and providing insights into the more complex and subjective aspects of human experience.
- Qualitative observation is a flexible research method that can be adjusted based on research goals and timeline. It also has the potential to be quite non-intrusive, allowing observation of participants in their natural settings without disrupting or influencing their behavior.
- Qualitative observation is often used in combination with other research methods, such as interviews or surveys , to provide a more complete picture of the phenomenon being studied. This triangulation can help improve the reliability and validity of the research findings.
Disadvantages of qualitative observations
- Like many observational studies, qualitative observations are at high risk for many research biases , particularly on the side of the researcher in the case of observer bias . These biases can also bleed over to the participant size, in the case of the Hawthorne effect or social desirability bias .
- Qualitative observations are typically based on a small sample size , which makes them very unlikely to be representative of the larger population. This greatly limits the generalizability of the findings if used as a standalone method, and the data collection process can be long and onerous.
- Like other human subject research, qualitative observation has its share of ethical considerations to keep in mind and protect, particularly informed consent, privacy, and confidentiality.
Here's why students love Scribbr's proofreading services
Discover proofreading & editing
If you want to know more about statistics , methodology , or research bias , make sure to check out some of our other articles with explanations and examples.
- Student’s t -distribution
- Normal distribution
- Null and Alternative Hypotheses
- Chi square tests
- Confidence interval
- Quartiles & Quantiles
- Cluster sampling
- Stratified sampling
- Data cleansing
- Reproducibility vs Replicability
- Peer review
- Prospective cohort study
Research bias
- Implicit bias
- Cognitive bias
- Placebo effect
- Hawthorne effect
- Hindsight bias
- Affect heuristic
- Social desirability bias
Data analysis in qualitative observation often involves searching for any recurring patterns, themes, and categories in your data. This process may involve coding the data, developing conceptual frameworks or models, and conducting thematic analysis . This can help you generate strong hypotheses or theories based on your data.
Quantitative research deals with numbers and statistics, while qualitative research deals with words and meanings.
Quantitative methods allow you to systematically measure variables and test hypotheses . Qualitative methods allow you to explore concepts and experiences in more detail.
An observational study is a great choice for you if your research question is based purely on observations. If there are ethical, logistical, or practical concerns that prevent you from conducting a traditional experiment , an observational study may be a good choice. In an observational study, there is no interference or manipulation of the research subjects, as well as no control or treatment groups .
Cite this Scribbr article
If you want to cite this source, you can copy and paste the citation or click the “Cite this Scribbr article” button to automatically add the citation to our free Citation Generator.
George, T. (2023, June 22). What Is Qualitative Observation? | Definition & Examples. Scribbr. Retrieved June 18, 2024, from https://www.scribbr.com/methodology/qualitative-observation/
Is this article helpful?

Tegan George
Other students also liked, what is participant observation | definition & examples, naturalistic observation | definition, guide & examples, what is a cohort study | definition & examples, what is your plagiarism score.
Observational vs. Experimental Study: A Comprehensive Guide
Explore the fundamental disparities between experimental and observational studies in this comprehensive guide by Santos Research Center, Corp. Uncover concepts such as control group, random sample, cohort studies, response variable, and explanatory variable that shape the foundation of these methodologies. Discover the significance of randomized controlled trials and case control studies, examining causal relationships and the role of dependent variables and independent variables in research designs.
This enlightening exploration also delves into the meticulous scientific study process, involving survey members, systematic reviews, and statistical analyses. Investigate the careful balance of control group and treatment group dynamics, highlighting how researchers meticulously assign variables and analyze statistical patterns to discern meaningful insights. From dissecting issues like lung cancer to understanding sleep patterns, this guide emphasizes the precision of controlled experiments and controlled trials, where variables are isolated and scrutinized, paving the way for a deeper comprehension of the world through empirical research.
Introduction to Observational and Experimental Studies
These two studies are the cornerstones of scientific inquiry, each offering a distinct approach to unraveling the mysteries of the natural world.
Observational studies allow us to observe, document, and gather data without direct intervention. They provide a means to explore real-world scenarios and trends, making them valuable when manipulating variables is not feasible or ethical. From surveys to meticulous observations, these studies shed light on existing conditions and relationships.
Experimental studies , in contrast, put researchers in the driver's seat. They involve the deliberate manipulation of variables to understand their impact on specific outcomes. By controlling the conditions, experimental studies establish causal relationships, answering questions of causality with precision. This approach is pivotal for hypothesis testing and informed decision-making.
At Santos Research Center, Corp., we recognize the importance of both observational and experimental studies. We employ these methodologies in our diverse research projects to ensure the highest quality of scientific investigation and to answer a wide range of research questions.
Observational Studies: A Closer Look
In our exploration of research methodologies, let's zoom in on observational research studies—an essential facet of scientific inquiry that we at Santos Research Center, Corp., expertly employ in our diverse research projects.
What is an Observational Study?
Observational research studies involve the passive observation of subjects without any intervention or manipulation by researchers. These studies are designed to scrutinize the relationships between variables and test subjects, uncover patterns, and draw conclusions grounded in real-world data.
Researchers refrain from interfering with the natural course of events in controlled experiment. Instead, they meticulously gather data by keenly observing and documenting information about the test subjects and their surroundings. This approach permits the examination of variables that cannot be ethically or feasibly manipulated, making it particularly valuable in certain research scenarios.
Types of Observational Studies
Now, let's delve into the various forms that observational studies can take, each with its distinct characteristics and applications.
Cohort Studies: A cohort study is a type of observational study that entails tracking one group of individuals over an extended period. Its primary goal is to identify potential causes or risk factors for specific outcomes or treatment group. Cohort studies provide valuable insights into the development of conditions or diseases and the factors that influence them.
Case-Control Studies: Case-control studies, on the other hand, involve the comparison of individuals with a particular condition or outcome to those without it (the control group). These studies aim to discern potential causal factors or associations that may have contributed to the development of the condition under investigation.
Cross-Sectional Studies: Cross-sectional studies take a snapshot of a diverse group of individuals at a single point in time. By collecting data from this snapshot, researchers gain insights into the prevalence of a specific condition or the relationships between variables at that precise moment. Cross-sectional studies are often used to assess the health status of the different groups within a population or explore the interplay between various factors.
Advantages and Limitations of Observational Studies
Observational studies, as we've explored, are a vital pillar of scientific research, offering unique insights into real-world phenomena. In this section, we will dissect the advantages and limitations that characterize these studies, shedding light on the intricacies that researchers grapple with when employing this methodology.
Advantages: One of the paramount advantages of observational studies lies in their utilization of real-world data. Unlike controlled experiments that operate in artificial settings, observational studies embrace the complexities of the natural world. This approach enables researchers to capture genuine behaviors, patterns, and occurrences as they unfold. As a result, the data collected reflects the intricacies of real-life scenarios, making it highly relevant and applicable to diverse settings and populations.
Moreover, in a randomized controlled trial, researchers looked to randomly assign participants to a group. Observational studies excel in their capacity to examine long-term trends. By observing one group of subjects over extended periods, research scientists gain the ability to track developments, trends, and shifts in behavior or outcomes. This longitudinal perspective is invaluable when studying phenomena that evolve gradually, such as chronic diseases, societal changes, or environmental shifts. It allows for the detection of subtle nuances that may be missed in shorter-term investigations.
Limitations: However, like any research methodology, observational studies are not without their limitations. One significant challenge of statistical study lies in the potential for biases. Since researchers do not intervene in the subjects' experiences, various biases can creep into the data collection process. These biases may arise from participant self-reporting, observer bias, or selection bias in random sample, among others. Careful design and rigorous data analysis are crucial for mitigating these biases.
Another limitation is the presence of confounding variables. In observational studies, it can be challenging to isolate the effect of a specific variable from the myriad of other factors at play. These confounding variables can obscure the true relationship between the variables of interest, making it difficult to establish causation definitively. Research scientists must employ statistical techniques to control for or adjust these confounding variables.
Additionally, observational studies face constraints in their ability to establish causation. While they can identify associations and correlations between variables, they cannot prove causality or causal relationship. Establishing causation typically requires controlled experiments where researchers can manipulate independent variables systematically. In observational studies, researchers can only infer potential causation based on the observed associations.
Experimental Studies: Delving Deeper
In the intricate landscape of scientific research, we now turn our gaze toward experimental studies—a dynamic and powerful method that Santos Research Center, Corp. skillfully employs in our pursuit of knowledge.
What is an Experimental Study?
While some studies observe and gather data passively, experimental studies take a more proactive approach. Here, researchers actively introduce an intervention or treatment to an experiment group study its effects on one or more variables. This methodology empowers researchers to manipulate independent variables deliberately and examine their direct impact on dependent variables.
Experimental research are distinguished by their exceptional ability to establish cause-and-effect relationships. This invaluable characteristic allows researchers to unlock the mysteries of how one variable influences another, offering profound insights into the scientific questions at hand. Within the controlled environment of an experimental study, researchers can systematically test hypotheses, shedding light on complex phenomena.
Key Features of Experimental Studies
Central to statistical analysis, the rigor and reliability of experimental studies are several key features that ensure the validity of their findings.
Randomized Controlled Trials: Randomization is a critical element in experimental studies, as it ensures that subjects are assigned to groups in a random assignment. This randomly assigned allocation minimizes the risk of unintentional biases and confounding variables, strengthening the credibility of the study's outcomes.
Control Groups: Control groups play a pivotal role in experimental studies by serving as a baseline for comparison. They enable researchers to assess the true impact of the intervention being studied. By comparing the outcomes of the intervention group to those of survey members of the control group, researchers can discern whether the intervention caused the observed changes.
Blinding: Both single-blind and double-blind techniques are employed in experimental studies to prevent biases from influencing the study or controlled trial's outcomes. Single-blind studies keep either the subjects or the researchers unaware of certain aspects of the study, while double-blind studies extend this blindness to both parties, enhancing the objectivity of the study.
These key features work in concert to uphold the integrity and trustworthiness of the results generated through experimental studies.
Advantages and Limitations of Experimental Studies
As with any research methodology, this one comes with its unique set of advantages and limitations.
Advantages: These studies offer the distinct advantage of establishing causal relationships between two or more variables together. The controlled environment allows researchers to exert authority over variables, ensuring that changes in the dependent variable can be attributed to the independent variable. This meticulous control results in high-quality, reliable data that can significantly contribute to scientific knowledge.
Limitations: However, experimental ones are not without their challenges. They may raise ethical concerns, particularly when the interventions involve potential risks to subjects. Additionally, their controlled nature can limit their real-world applicability, as the conditions in experiments may not accurately mirror those in the natural world. Moreover, executing an experimental study in randomized controlled, often demands substantial resources, with other variables including time, funding, and personnel.
Observational vs Experimental: A Side-by-Side Comparison
Having previously examined observational and experimental studies individually, we now embark on a side-by-side comparison to illuminate the key distinctions and commonalities between these foundational research approaches.
Key Differences and Notable Similarities
Methodologies
- Observational Studies : Characterized by passive observation, where researchers collect data without direct intervention, allowing the natural course of events to unfold.
- Experimental Studies : Involve active intervention, where researchers deliberately manipulate variables to discern their impact on specific outcomes, ensuring control over the experimental conditions.
- Observational Studies : Designed to identify patterns, correlations, and associations within existing data, shedding light on relationships within real-world settings.
- Experimental Studies : Geared toward establishing causality by determining the cause-and-effect relationships between variables, often in controlled laboratory environments.
- Observational Studies : Yield real-world data, reflecting the complexities and nuances of natural phenomena.
- Experimental Studies : Generate controlled data, allowing for precise analysis and the establishment of clear causal connections.
Observational studies excel at exploring associations and uncovering patterns within the intricacies of real-world settings, while experimental studies shine as the gold standard for discerning cause-and-effect relationships through meticulous control and manipulation in controlled environments. Understanding these differences and similarities empowers researchers to choose the most appropriate method for their specific research objectives.
When to Use Which: Practical Applications
The decision to employ either observational or experimental studies hinges on the research objectives at hand and the available resources. Observational studies prove invaluable when variable manipulation is impractical or ethically challenging, making them ideal for delving into long-term trends and uncovering intricate associations between certain variables (response variable or explanatory variable). On the other hand, experimental studies emerge as indispensable tools when the aim is to definitively establish causation and methodically control variables.
At Santos Research Center, Corp., our approach to both scientific study and methodology is characterized by meticulous consideration of the specific research goals. We recognize that the quality of outcomes hinges on selecting the most appropriate method of research study. Our unwavering commitment to employing both observational and experimental research studies further underscores our dedication to advancing scientific knowledge across diverse domains.
Conclusion: The Synergy of Experimental and Observational Studies in Research
In conclusion, both observational and experimental studies are integral to scientific research, offering complementary approaches with unique strengths and limitations. At Santos Research Center, Corp., we leverage these methodologies to contribute meaningfully to the scientific community.
Explore our projects and initiatives at Santos Research Center, Corp. by visiting our website or contacting us at (813) 249-9100, where our unwavering commitment to rigorous research practices and advancing scientific knowledge awaits.
Recent Posts
Learn everything about Respiratory Syncytial Virus (RSV), from symptoms and diagnosis to treatment and prevention. Stay informed and protect your health with...
Discover key insights on Alzheimer's disease, including symptoms, stages, and care tips. Learn how to manage the condition and find out how you can...
Discover expert insights on migraines, from symptoms and causes to management strategies, and learn about our specialized support at Santos Research Center.
Explore our in-depth guide on UTIs, covering everything from symptoms and causes to effective treatments, and learn how to manage and prevent urinary tract infections.
Your definitive guide to COVID symptoms. Dive deep into the signs of COVID-19, understand the new variants, and get answers to your most pressing questions.
Unravel the differences between observational and experimental studies. Dive into the intricacies of each method and discover their unique applications in research.
Discover the different types of clinical trials and their significance in advancing medical science. Dive deep into the world of clinical research with Santos Research Center.
Santos Research Center, Corp. is a research facility conducting paid clinical trials, in partnership with major pharmaceutical companies & CROs. We work with patients from across the Tampa Bay area.
Contact Details
Navigation menu.
23 Qualitative Observation Examples

Chris Drew (PhD)
Dr. Chris Drew is the founder of the Helpful Professor. He holds a PhD in education and has published over 20 articles in scholarly journals. He is the former editor of the Journal of Learning Development in Higher Education. [Image Descriptor: Photo of Chris]
Learn about our Editorial Process

Qualitative observation is a method of collecting data that involves describing the attributes and properties of a phenomenon or subject through the senses, rather than using numerical measurements.
This type of observation is most beneficial for studies designed to provide in-depth, detailed, nuanced, and contextualized case studies. The qualitative data generated can help to explain complex concepts.
However, unlike quantitative observation (such as measuring lengths, instances, and intervals), this data cannot be generalized beyond the scope of the research project itself, limiting its applicability to a wide variety of situations.
Qualitative Observation Examples
1. participant observation.
Participant observation is a type of qualitative observation where the researcher not only observes the researched group or individuals, but also actively engages in the activities of the group or individuals [ 1 ] .
This immersion in the activity and culture of the group allows for a deeper understanding, usually over a longer period. It allows the researcher to fully participate in the day-to-day lives and rituals of the participants.
The goal is to gain deeper insights into their social and cultural practices, which can then be explained through thick description.
Participant Observation Example : An anthropologist might live within a remote tribe for a period to understand their lifestyle, beliefs, and customs. They would participate in daily activities, mimic behaviors, and even learn the local language to gather empirical and comprehensive data.
2. Non-Participant Observation
In non-participant observation, the researcher observes the participants without getting involved in their actions or activities [ 2 ] . In other words, they remain “invisible” to the research subjects, who are unaware of being observed.
This reduces potential observer-effects, such as participants modifying their behavior because they know they are being watched. However, it also places some distance between the observer and the observed, which may limit the depth of understanding.
Example: A researcher studying interactions in a workplace might install surveillance cameras and watch the footage to observe how employees interact when they think they are not being observed. By not involving themselves directly, they aim to capture the most accurate and natural interactions.
3. Naturalistic Observation
Naturalistic observation is a method where the researcher observes behavior in a natural setting, without manipulating or controlling the situation [ 3 ] .
It allows the researcher to study things in their natural environment, providing a real-world context. This observational method provides the opportunity to collect data that is not artificial or manipulated while providing deep insights into a phenomenon.
Naturalistic Observation Example : A psychologist studying children’s play behavior might observe a group of children in a playground during their recess. By leaving the children in their natural and uncontrolled play environment, the psychologist can see the real-life application of the children’s social skills, the play schemes they adopt, and how they use their imagination and negotiation skills.
4. Focus Groups
Focus groups involve a group of individuals who participate in a guided discussion about a particular topic. The researchers take notes and discern themes based on these focus group discussions [ 4 , 5 ] .
The group setting encourages participants to share diverse perspectives, generating rich, detailed data. However, the dynamic can be influenced by more dominant individuals, potentially biasing the group’s collective voice.
Focus Group Example : A market researcher seeking feedback on a new product might conduct a focus group with potential consumers. In the discussion, they would ask about the product’s appeal, perceived usefulness, and areas for improvement, gaining insights into consumer preferences and acceptance.
5. Thick Description
Thick description an approach to qualitative observation used specifically in ethnographic research . It involves taking detailed accounts of people’s behavior in their social and cultural context.
This concept was created by Clifford Geertz [ 6 ] , an anthropologist seeking a better method for the analysis of natural phenomena.
Thick descriptions not only detail the behavior but also its context, as well as the intentions and emotions of the actors. Though rich in detail, interpretation of thick description depends on the cultural competence and analytical skills of the researcher.
Thick Description Example : An anthropologist studying an indigenous tribe might use thick description to provide in-depth accounts of their rituals. They would describe not only the actions of the rituals but also the emotions experienced, the social and cultural context, the symbolism involved, the participants’ understanding and interpretation of the ritual, essentially providing a nuanced, multilayered understanding of the tribe’s practices.
6. Structured Observation
Structured observation is a systematic method in observational research where the researcher explicitly decides where, when, and how the observation will take place.
The researcher typically uses previously defined criteria and may have a specific list of behaviors to look for [ 7 , 8 ] . It often involves the use of standardized scales or coding systems to categorize observed behaviors, and it aims at statistical reliability.
Example: A behavioral psychologist studying aggressive behaviors in children after playing violent video games might conduct structured observations by having the children play the games in a set environment (controlled setting, same gaming platform, same game) and then observing for specific aggressive behaviors (like hitting, shouting, throwing objects) based on a previously prepared checklist.
7. Unstructured Observation
Unstructured observation, unlike structured observation, does not involve pre-determined criteria or an exact plan for the observation.
Instead, the observer merely watches the participants in a situation and records whatever they think is relevant or significant [ 8 ] . This approach allows for the discovery of unexpected phenomena but can be more time consuming and may elicit subjective interpretations.
Example: A sociologist studying homeless people’s daily routines might follow several homeless individuals around throughout their day without a specific plan or list of behaviors to observe. They take note of any behavior they believe is significant to understanding the lifestyle and hardships of a homeless individual.
8. Direct Observation
Direct observation involves a researcher being physically present to observe and record behavior as it occurs. The researcher may or may not be visible to the participants [ 9 ] .
Direct observation allows the researcher to collect firsthand data and reduces the chances of missing any relevant information. However, it can also introduce bias as the researcher’s interpretation and presence can affect the situation.
Example: An educator studying classroom dynamics might sit at the back of the classroom to directly observe student behavior, interactions, and engagement. They could observe how different teaching styles affect student attentiveness, participation, and overall classroom behavior.
9. Indirect Observation
Indirect observation is the collection of data through some means other than direct observation; the researcher does not have to be present at the site of observation [ 9 ] .
The researcher can use techniques such as video recordings, photographs, or existing records. This approach lessens potential bias from the researcher’s presence but might miss contexts or non-verbal cues.
Example: A city planner studying traffic patterns might use footage from surveillance cameras placed at various intersections around the city, rather than observing every intersection in person. This method allows them to analyze traffic flow, most frequent peak hours, and violations at different times and days.
10. Continuous Monitoring
Continuous monitoring involves observing a subject or a phenomenon over an uninterrupted period, recording all actions and events as they occur [ 10 ] .
This type of observation provides comprehensive data about a subject’s behavior across different times and situations. However, it can be time-consuming and requires extensive resources.
Example: A wildlife biologist studying the behavior of a certain animal species might set up a live camera feed on the animals’ habitat to continuously monitor their activities. They would track their feeding habits, social behaviors, mating rituals, sleep patterns, etc., to gain a holistic understanding of the species’ lifestyle.
See Also: Types of Qualitative Research
11. Interval Recording
Interval recording is a method where the observation period is divided into smaller intervals, and the researcher records whether or not a specific behavior occurs within each interval [ 10 ] .
This method provides a snapshot of behavior during certain times and is not as time-consuming as continuous monitoring. Still, it might miss occurrences that happen between intervals.
Example: A clinical psychologist studying an individual with Tourette Syndrome might record every 15 seconds whether or not a tic occurs. They might do this over a series of therapy sessions to understand the frequency of the tics and the effect of the therapy.
12. Time Sampling
Time sampling is an observational method where the researcher records behaviors at pre-determined intervals of time, regardless of the event type [ 10 ] .
The researcher chooses specific time periods and determines whether or not the behavior of interest is happening during those times. Time sampling can simplify long observations and reduce the workload, but it might miss events that happen outside the selected time periods.
Example: An educator studying student engagement during a lecture might conduct a time sampling by noting what the students are doing (listening attentively, talking to fellow students, using their phones) at 10-minute intervals throughout the lecture.
13. Narrative Observation
Narrative observation involves recording detailed, descriptive notes about what is being observed. It attempts to capture the full context and detail of events, rather than just specific behaviors [ 9 ] .
This method is unstructured and allows for capturing unforeseen information, as it doesn’t focus only on specific behaviors or events. However, it can also be time-consuming and data may be difficult to analyze systematically.
Example: A social worker trying to understand the dynamics of a dysfunctional family might record detailed narrative observations of family interactions. This could involve noting down not just what is said and done, but also the context, the tones of voice, facial expressions, and any other significant details such as time and physical setting.
14. Anecdotal Records
Anecdotal records provides a detailed description of a significant behavior or event that the observer finds interesting or important [ 10 ] .
The observer might not necessarily be looking for this specific behavior or event in advance, but upon noticing it, they write it down in as much detail as possible, hence creating an “anecdote” about it. This form of observation captures information that might not have been sought, but could be very significant.
Anecdote Example : A teacher noticing a child displaying advanced reading skills might write an anecdotal record about it, describing how the child was reading, which book they chose, and ways they interacted with the material. These records can then be used to tailor the child’s education plan to their advanced skill level.
15. Checklist Observation
A checklist observation is a form of structured observation where the observer has a specific list of behaviors, characteristics, or events that they are looking to observe [ 11 ] .
It allows for systematic collection of data and can provide a quick and efficient way to record and compare information across multiple observations or participants. However, it might miss other relevant information that is not on the checklist.
Example: A human resource manager observing employee performance might have a checklist that includes factors like punctuality, completion of tasks, cooperation with team members, and ability to meet deadlines. The manager would use this to evaluate the employees and identify areas for improvement.
16. Rubrics
Rubrics are a type of observation tool that provides a detailed performance scoring guide. They include criteria that are specific, observable, and measurable [ 12 ] .
Each criterion is evaluated against a performance scale, allowing for consistency among different observers. While rubrics establish clear expectations and standards, developing effective rubrics can be time-consuming.
Example: A physical education teacher evaluating a student’s performance in gymnastics might use a rubric. Criteria might include the technique of different moves, the level of difficulty, the gracefulness and fluidity of performance, and the creativity of the routine.
17. Video Observation
Video observation refers to using video recording as a tool for data collection in observational research. It involves recording the behaviors or events of interest so they can be analyzed at a later time [ 12 ] .
It allows for capturing details that the observer might miss during real-time observation and for re-visiting the observation for further analysis. However, it may also hinder the naturalness of behaviors due to camera awareness.
Example: A sociolinguist studying nonverbal communication might use video observation capturing conversations between participants. Recording would allow the researcher to review and analyze subtle body language, facial expressions, or pauses that might have been missed during live observation.
18. Audio Observation
Audio observation is a method that uses audio recordings to capture information during a research study. Behaviors or interactions are recorded for subsequent analysis [ 12 ] .
This method assists in preserving the verbal aspects of an event but lacks visual data. It is often used in group discussions, interviews, or conversation analysis where auditory information is primary.
Example: A linguist studying dialect variations in a certain region might conduct audio observations by recording conversations between natives of that region. They could then analyze variations in pronunciation, vocabulary, and syntax.
19. Focused Observation
Focused observation is a method where observers focus on specific behaviors, interactions, or events rather than trying to capture everything that occurs [ 13 ] .
These observations often address specific research questions, allowing for a deeper understanding of the focused elements. However, other contextually significant behaviors or interactions might be overlooked.
Example: A researcher studying gender dynamics in office settings might conduct a focused observation on how men and women participate in team meetings—who initiates discussions more frequently, who gets interrupted more, who takes on leadership roles.
20. Longitudinal Observation
Longitudinal observation spans over a long period, allowing researchers to study changes and developments [ 14 ] .
This method is valuable for exploring long-term effects or trends, but it requires a significant commitment of time and resources. Additionally, maintaining the same observation conditions might be challenging over time.
Example: A developmental psychologist studying the effect of parental involvement on school performance might conduct longitudinal observation by regularly observing a group of students from kindergarten through high school, correlating their academic progression with different degrees of parental involvement.
See Also: Longitudinal Research Guide
21. Field Observation
Field observation , often used in ethnographic research, involves observing subjects in their natural environment, or “in the field” [ 1 ] .
Real world settings offer a wealth of contextual richness, allowing researchers to study individuals or groups in a more natural, less controlled manner, often resulting in more honest behaviors. However, uncontrolled environments can introduce uncontrolled variables, offering potential challenges to data interpretation.
Example: An anthropologist studying the subculture of graffiti artists might conduct field observations by spending time at locations where these artists typically work, observing their process, community interactions, and reactions of the general public.
22. Controlled Observation
Controlled observation takes place in a setting where variables can be manipulated or controlled by the observer [ 15 ] .
Often conducted in a lab setting, it allows the observer to establish cause-and-effect relationships by manipulating independent variables and observing their effect on dependent variables.
While this method can provide strong evidence, it may lack ecological validity, as outcomes observed in a controlled setting may not necessarily translate to real-world situations.
Example: A psychologist studying the effects of anxiety on test performance might conduct a controlled observation by administering a test to two groups: one group under normal conditions, and the other under conditions designed to induce anxiety, then observing for any differences in performance.
23. Case Study Observation
Case study observation involves an in-depth examination of a specific individual, group, or event in real-life context [ 16 ] .
It provides a holistic view of the subject and allows for understanding of complex issues. However, findings might not be generalizable due to specificity.
Example: A social scientist interested in understanding the impact of poverty on education might conduct case study observations on children from low-income families. They might observe the child at home, at school, or in other social settings over a period of time to ascertain how their socio-economic status affects their educational opportunities and performance.
See Also: Advantages and Disadvantages of Case Studies
Qualitative vs Quantitative Observation
Qualitative observation delves into understanding underlying meanings and human behavior through non-numerical data collection, while quantitative observation seeks to uncover patterns and establish facts through numerical data collection and analysis.
Qualitative observation is focused on understanding underlying meanings and concepts that govern behavior or situations. It seeks to explore the depth, richness, and complexity inherent in phenomena. On the other hand, quantitative observation aims at drawing conclusions based on numerical data. It relies on measurable data to formulate facts and uncover patterns in research.
The research methodologies employed in qualitative and quantitative observations significantly differ:
- Qualitative methods are often more flexible, allowing for a broader understanding of issues at hand, and are particularly useful in exploring new or complex issues. They provide a narrative or descriptive outcome, which can be instrumental in understanding the context of a particular situation.
- Quantitative methods are rigid but provide a clear-cut answer to a research question. They yield numerical data that can be analyzed using statistical methods to validate or refute hypotheses. The outcome of quantitative research often comes in the form of graphs, charts, or tables showcasing the relationships between different variables.
| Aspect | Qualitative Observation | Quantitative Observation |
|---|---|---|
| Understanding underlying meanings, emotions, and processes | Establishing facts, uncovering patterns, and testing hypotheses | |
| Non-numerical (textual, visual, or auditory data) | Numerical (statistical or measurable data) | |
| Flexible, adaptable to changes | Structured, standardized and rigid | |
| Interviews, focus groups, observations, content analysis | Surveys, experiments, questionnaires, numerical measurements | |
| Thematic analysis, narrative analysis, | Statistical analysis, numerical comparisons, and graphical representation | |
| Descriptive or narrative | Numerical, often represented through graphs, charts, or tables | |
| Provides deep insights into specific cases or phenomena | Provides a broad understanding across a large sample size | |
| Generally used for hypothesis generation | Used for hypothesis testing | |
| Limited generalizability due to often smaller sample sizes | High generalizability due to larger sample sizes and standardized methods | |
| Interpretative, understanding the context is crucial | Objective, often requiring less interpretation | |
| Can be time-consuming and resource-intensive due to the depth of exploration | Often quicker and less resource-intensive due to structured methods |
The choice between qualitative and quantitative observation often hinges on the nature of the research question and the stage of research.
Qualitative observation is generally more suited for exploratory or foundational research where not much is known about the problem. It helps in hypothesis generation by providing insights into the problem.
Quantitative observation, on the other hand, is ideal for confirmatory or validation studies where hypotheses are tested under controlled conditions. It helps in hypothesis testing and contributes to the establishment of facts or the discovery of general laws.
Both types of observation are crucial for a comprehensive understanding of research problems, and a mixed-methods approach, which combines both qualitative and quantitative methods, is often deemed most effective in tackling complex research questions.
Pros and Cons of Qualitative Observation
Qualitative observation is pivotal in understanding complex phenomena by delving into the intricacies of human behavior, social interactions, and cultural norms [ 9 , 11 ] .
Through qualitative observation, researchers can capture the natural setting and the context in which individuals operate, which often leads to more authentic and nuanced findings.
However, it has its limitations.
The very features that make qualitative observation powerful can also be seen as its shortcomings.
The findings from qualitative observation are not generalizable due to the small sample sizes typically employed [ 11 ] .
Additionally, this form of observation is also highly dependent on the skills and biases of the researcher, which can influence the data collection and interpretation process [ 7 ] .
See the table below for a summary of the key pros and cons:
| Pros of Qualitative Observation | Cons of Qualitative Observation |
|---|---|
| Provides deep insights into specific cases or phenomena ] | May not provide a comprehensive understanding across a large spectrum ] |
| Adaptable to changes and unexpected findings | Lack of standardization can lead to inconsistencies |
| Captures natural settings and contextual nuances , ] | Time-consuming and resource-intensive data collection and analysis , ] |
| Rich, detailed data ] | Potential for researcher bias in data collection and interpretation ] |
| More holistic and nuanced findings | Lack of replicability and comparability across different studies |
| Useful for hypothesis generation , ] | May be influenced by researcher’s subjective interpretation ] |
| Limited generalizability due to smaller sample sizes ] | |
| Difficult to establish validity and reliability due to subjective interpretation |
Up Next: An Introduction to Qualitative Research
[1] Seim, J. (2021). Participant observation, observant participation, and hybrid ethnography. Sociological Methods & Research , 0049124120986209. ( Source )
[2] Handley, M., Bunn, F., Lynch, J., & Goodman, C. (2020). Using non-participant observation to uncover mechanisms: Insights from a realist evaluation. Evaluation , 26 (3), 380-393. ( Source )
[3] Carey, A. L., Rentscher, K. E., & Mehl, M. R. (2020). Naturalistic observation of social interactions. The Wiley encyclopedia of health psychology , 373-383. ( Source )
[4] Cyr, J. (2019). Focus Groups for the Social Science Researcher . Cambridge University Press.
[5] Mishra, L. (2016). Focus group discussion in qualitative research. TechnoLearn: An International Journal of Educational Technology , 6 (1), 1-5. ( Source )
[6] Geertz, C. (1973). Thick Description: Towards an Interprative theory of culture. The Interpretation of Cultures , 3-31.
[7] Damaskinidis, G. (2017). Qualitative research and subjective impressions in educational contexts. American Journal of Educational Research , 5 (12), 1228-1233.
[8] Farid, S. (2022). Observation. In Principles of Social Research Methodology (pp. 365-375). Singapore: Springer Nature Singapore.
[9] Daniel, B. K., & Harland, T. (2017). Higher Education Research Methodology: A Step-by-Step Guide to the Research Process . Taylor & Francis.
[10] Kirner, K., & Mills, J. (2019). Introduction to Ethnographic Research: A Guide for Anthropology. SAGE Publications.
[11] Bryman, A. (2012). Social Research Methods . OUP Oxford.
[12] Kelly, G. J., & Green, J. L. (Eds.). (2018). Theory and Methods for Sociocultural Research in Science and Engineering Education . Taylor & Francis.
[13] Schneider, N. C., Coates, W. C., & Yarris, L. M. (2017). Taking your qualitative research to the next level: a guide for the medical educator. AEM education and training , 1 (4), 368-378. ( Source )
[14] Thomson, R., & McLeod, J. (2015). New frontiers in qualitative longitudinal research: An agenda for research. International Journal of Social Research Methodology , 18 (3), 243-250. ( Source )
[15] Islam, M. R., Khan, N. A., & Baikady, R. (Eds.). (2022). Principles of Social Research Methodology . Springer Nature Singapore.
[16] Njie, B., & Asimiran, S. (2014). Case study as a choice in qualitative methodology. Journal of research & method in Education , 4 (3), 35-40.

- Chris Drew (PhD) https://helpfulprofessor.com/author/chris-drew-phd/ 119 Bloom’s Taxonomy Examples
- Chris Drew (PhD) https://helpfulprofessor.com/author/chris-drew-phd/ All 6 Levels of Understanding (on Bloom’s Taxonomy)
- Chris Drew (PhD) https://helpfulprofessor.com/author/chris-drew-phd/ 15 Self-Actualization Examples (Maslow's Hierarchy)
- Chris Drew (PhD) https://helpfulprofessor.com/author/chris-drew-phd/ Forest Schools Philosophy & Curriculum, Explained!
Leave a Comment Cancel Reply
Your email address will not be published. Required fields are marked *

An official website of the United States government
The .gov means it’s official. Federal government websites often end in .gov or .mil. Before sharing sensitive information, make sure you’re on a federal government site.
The site is secure. The https:// ensures that you are connecting to the official website and that any information you provide is encrypted and transmitted securely.
- Publications
- Account settings
Preview improvements coming to the PMC website in October 2024. Learn More or Try it out now .
- Advanced Search
- Journal List
- HHS Author Manuscripts
Observational Research Opportunities and Limitations
Edward j. boyko.
Epidemiologic Research and Information Center, VA Puget Sound Health Care System, Seattle, WA USA. University of Washington School of Medicine, Seattle, WA
Medical research continues to progress in its ability to identify treatments and characteristics associated with benefits and adverse outcomes. The principle engine for the evaluation of treatment efficacy is the randomized controlled trial (RCT). Due to the cost and other considerations, RCTs cannot address all clinically important decisions. Observational research often is used to address issues not addressed or not addressable by RCTs. This article provides an overview of the benefits and limitations of observational research to serve as a guide to the interpretation of this category of research designs in diabetes investigations. The potential for bias is higher in observational research but there are design and analysis features that can address these concerns although not completely eliminate them. Pharmacoepidemiologic research may provide important information regarding relative safety and effectiveness of diabetes pharmaceuticals. Such research must effectively address the important issue of confounding by indication in order to produce clinically meaningful results. Other methods such as instrumental variable analysis are being employed to enable stronger causal inference but these methods also require fulfillment of several key assumptions that may or may not be realistic. Nearly all clinical decisions involve probabilistic reasoning and confronting uncertainly, so a realistic goal for observational research may not be the high standard set by RCTs but instead the level of certainty needed to influence a diagnostic or treatment decision.
A major focus of medical research is the identification of causes of health outcomes, good and bad. The current gold standard method to accomplish this aim is the randomized controlled trial (RCT) ( Meldrum, 2000 ). The performance of a RCT requires strict specification of study conditions related to all aspects of its conduct, such as participant selection, treatment and control assignment arms, inclusion/exclusion criteria, randomization method, outcome measurement, and many other considerations. Such trials are difficult to mount due to the expense in terms of both time and money, and often lead to results that may be difficult to apply to a real-world setting due to either the rigor or complexity of the intervention or the selection process for participants that yields a population dissimilar from that seen in general clinical practice. A randomized controlled trial focuses on an assessment of the validity of its results at the expense of generalizability. For example, the Diabetes Prevention Program screened 158,177 subjects to yield 3,819 subjects who were eventually randomized to one of the four original arms ( Rubin et al., 2002 ). Other limitations of RCTs include a focus on treatment effects and not the ability to detect rarer adverse reactions; restrictions on diabetes duration at the time of trial entry, thereby yielding results that may not apply to persons with a different diabetes duration at the initiation of treatment; and high costs that limits the number of therapeutic comparisons. Regarding this last point, assessment of a new treatment for hyperglycemia requires comparison to existing accepted treatments, but the control population usually is restricted to fewer treatments than in current use, thereby limiting the ability to compare the new treatment to all existing treatments.
Given these considerations, observational research is often used to address important clinical questions in the absence of randomized clinical trial data, but may also make important potential contributions even when RCTs have been conducted. Examples include monitoring for long-term adverse events that did not appear during the time interval over which the RCT was conducted, or to assess whether the trial findings apply to a different population excluded from the trial due to younger or older age, gender, presence of comorbid conditions, or other factors. Observational research often also addresses other questions not suitable for randomized clinical trials, such as an exposure known to be harmful or in other ways unacceptable to participants or whose administration is inconsistent with ethical principles. Also, observational research can address other exposures that are not potentially under the control of the investigator, such as, for example, eye color, blood type, presence of a specific genetic marker, or elevations of blood pressure or plasma glucose concentration. Observational research may also provide preliminary data to justify the performance of a clinical trial, which might not have received sufficient funding support without the existence of such results.
This paper will review observational research methods applied to addressing questions of causation in diabetes research, with a particular focus on pharmacoepidemiology as an area of research where many important questions may be addressed regarding the relative merits of multiple pharmaceuticals for a given condition. There have been an increasing number of observational studies of the association between diabetes treatments and hard outcomes, such as death or CVD events. The increase in such studies likely has been facilitated by the availability of big data in general and specifically large pharmaceutical databases created by national health plans, large health care systems, or mail-order pharmacy providers ( Sobek et al., 2011 ). In addition, the ongoing development of diabetes pharmacotherapies approved based on ability to achieve an improvement in glycemic control but without data on hard outcomes may also provide the impetus to use such large databases for research on comparative safety and efficacy.
Observational Research Study Designs
Cohort and case-control studies.
The two most popular designs for investigating causal hypotheses are the cohort and case-control studies. Features are shown in Table 1 . The major difference between the two is that the cohort study begins with identification of the exposure status, whereas the case-control study begins with the identification of the outcome. A cohort study can be prospective, where exposed and non-exposed subjects are followed for the development of the outcome, or retrospective, where collected data can be used to identify both the exposure status at some past time point and the subsequent development of the outcome. A case-control study, on the other hand, can only look back in time for occurrence of the exposure. There are of course exceptions to these general statements. It is possible in some case-control studies to measure the exposure after the outcome in time if the exposure is invariant and if it is not related to a greater loss to follow-up among persons with the outcome due to mortality or other reasons. Examples of such exposures include genetic markers or an unchanging characteristic of adults such as femur length, eye color, or red blood cell type. Variations in these study designs include the case-cohort and case-only studies, which are described in detail elsewhere, and which a description of which will not be provided here ( DiPietro, 2010 ). Also, the relative merits of these study designs will not be discussed here but are covered in standard epidemiology texts.
Observational Study Designs for Assessment of Causal Relationships
| Subjects Selection Based on | Temporal Sequence | Strengths | Weaknesses | Best Application | |
|---|---|---|---|---|---|
| Cohort | Exposure status | Disease assessed following exposure | Generally less measurement error; provides estimate of incidence; can examine multiple outcomes | May require larger samples sizes and long follow-up | Exposure is rare; multiple outcomes of interest; common outcome(s) |
| Case-control | Disease status | Exposure assessed prior to disease | Multiple exposures can be examined; smaller sample size needed | Can only examine a single disease of interest; greater potential for bias in measuring exposure | Disease is rare; single disease of interest; common exposure |
| Cross-sectional | Neither exposure nor disease | Both exposure and disease assessed at the same time point | Straightforward subject selection | Lack of information on exposure timing and disease onset | Quick execution |
Weaker Observational Research Designs
Other research designs are often used in studies reported in the medical literature. These include cross-sectional, case-series, and case-reports. The cross-sectional study has limited value in assessing a potential causal relationship since it may not be possible to determine whether the potential exposure preceded the outcome, except when the exposure does not vary over one’s life history, such as in the case of a genotype, ABO blood group, or eye color. Case-series and case reports are even more limited since it is not possible to assess if the outcome occurred more frequently among the persons included compared to a control population. Case reports do though have potential value in pharmaceutical safety research by generating potential signals that signify unexpected adverse events. Such monitoring is employed in the Food and Drug Administration’s Adverse Event Reporting System, and has led to changes in product labeling as well as restriction or outright removal of pharmaceuticals from the market due to safety concerns ( Wysowski & Swartz, 2005 ). Over 2 million case reports of adverse reactions were submitted between 1969–2002, resulting in only about 1% of marketed drugs being withdrawn or restricted. Therefore the noise-to-signal ratio for this method of surveillance is exceedingly high and presents an opportunity for other observational methods to better address this issue.
Observation Research for Causal Inference
Causal associations will always involve correlation, but the presence of a correlation does not imply causation. The challenge of observational research is to assess whether a correlation is present and then determine whether it may be due to a causal association. A list of criteria was developed by Dr. Austin Bradford Hill decades ago that is still referred to frequently today ( Hill, 1965 ), although reexamination of these criteria more recently has led to the conclusion that only one of the nine original features is really necessary for a causal relationship in a observational study ( Phillips & Goodman, 2004 ; Rothman & Greenland, 2005 ). The magnitude of the observed association, another Hill criterion, often figures into determinations about the presence of bias, with those of greater magnitude considered less likely to be due to bias and more likely due to a causal process ( Grimes & Schulz, 2002 ).
Examination of the features of an RCT provide some insight into the limitations of observational research in assessing causal associations. The randomization process provides the opportunity for equal distribution of risk factors for the outcome among persons assigned to the treatment and control. Thus any difference in the outcome between these two groups will not likely be due to unequal distribution of risk factors by treatment assignment. The use of randomization provides a way to approach the problem of not having complete knowledge about predictors of all clinically important outcomes. If we did have such knowledge then groups with exactly equal risks of the outcome could be assembled by the investigator. As we do not have such knowledge, the process of randomization utilizes chance to distribute both known and more importantly unknown risk factors for the outcome, and is most likely to achieve this aim with larger sample size ( Efird, 2011 ). Randomization, though, does not guarantee that the treatment and control group will have the same risk of the outcome. Accidents of randomization have occurred for known risk factors for outcomes as in the UGDP, where older subjects with a higher prevalence of cardiovascular disease risk factors were disproportionately assigned to the tolbutamide treatment arm ( Leibel, 1971 ). Such accidents also must occur for the unknown risk factors, although these would not be apparent to the investigator.
Bias in Observational Research
Confounding bias.
Observational research does not have the benefit of randomization to allocate by chance risk factors for an outcome of interest. Exposures to risk factors occur due to self-selection, medical provider prescription, in association with occupation, and for other reasons. When an exposure of interest is strongly associated with another exposure that is also related to the outcome, confounding bias is present, but methods exist to obtain an unbiased estimated of the exposure-disease association as long as the confounding factor is identified and measured accurately.
A cross-sectional study of a genetic marker (Gm haplotype Gm 3;5,13,14 ) and diabetes prevalence provides an example of confounding bias. Subjects included members of the Pima and Papago tribes of the Gila River Indian Community in Southern Arizona who underwent a medical history and examination every two years including assessment of diabetes status through oral glucose tolerance testing ( Knowler, Williams, Pettitt & Steinberg, 1988 ). Subjects were further characterized by degree of Indian heritage measured in eighths and referred to as “quantum.” A total of 4,640 subjects of either 0/8, 4/8, and 8/8 quantum were included in this analysis. There were 1,336 persons with and 3,304 persons without diabetes available for analysis, yielding a crude (unadjusted) overall odds ratio of 0.24 for the association between haplotype Gm 3;5,13,14 and diabetes prevalence ( Figure 1 , Panel A). This result supports a lower prevalence of diabetes in association with haplotype Gm 3;5,13,14 , but the unadjusted result represents a substantial overestimate due to confounding by Quantum. In Figure 1 panel B, subjects were divided by the three Quantum categories found in the sample, and within each of these the odds ratio is closer to 1.0 and therefore of smaller magnitude than the crude result. Note that collapsing the three tables in Panel B by summing the cells yields the single overall table shown in Panel A. Adjustment for these Quantum categories yields an odds ratio of 0.59, which is of smaller magnitude than the result seen in the unadjusted analysis ( Figure 1 , Panel B). Although the odds ratios vary across Quantum categories, a test for heterogeneity across these strata was non-significant (p=0.295). Therefore the null hypothesis that the odds ratios differed across Quantum strata could not be rejected.

Cross-sectional study of Native Americans of the Pima and Papago Indian tribes in Southern Arizona on the associations between the GM haplotype Gm 3;5,13,14 , native quantum, and diabetes mellitus prevalence. Panel A displays all participants combined with Native quantum of either 0/8, 4/8 or 8/8 by presence of diabetes mellitus in relation to Gm 3;5,13,14 presence or absence. The overall (crude) odds ratio for the association is shown. Panel B displays all participants from Panel A stratified by Native quantum, demonstrating confounding by Native quantum as judged by the discordance between the crude and stratified or Quantum-adjusted results. Panel C demonstrates that Quantum meets the criterion as a confounding variable due to its negative association with Gm 3;5,13,14 and positive association with diabetes prevalence.
Examination of the frequency of haplotype Gm 3;5,13,14 and diabetes prevalence across Indian heritage Quantum reveals the reason for the overestimation of the association in the unadjusted analysis. Diabetes occurred more frequently while the haplotype Gm 3;5,13,14 occurred less frequently among subjects with greater Indian heritage ( Figure 1 , Panel C). Adjustment for the imbalance in Quantum by haplotype Gm 3;5,13,14 in this specific example and in general any accurately measured confounding factor yields a less biased odds ratio that is closer to the true magnitude of the association between this haplotype and diabetes prevalence.
Another more recent example of confounding can be seen in a case-cohort European study of the association between artificially sweetened soft drinks and the risk of developing type 2 diabetes ( 2013 ). The unadjusted hazard ratio for the daily consumption of ≥ 250 g of this beverage type was 1.84 (95% CI 1.52 to 2.23) representing a statistically significant elevation in risk. After adjustment for daily energy intake and BMI, the hazard ratio diminished to 1.13 (95% CI 0.85 to 1.52) and was no longer statistically significant (p=0.24). The investigators concluded that consumption of artificially sweetened soft drinks was not associated with type 2 diabetes risk in their population.
Multiple methods exist to remove the bias from recognized, accurately measured confounding factors, but unfortunately there is no widely accepted option for handling unmeasured confounding factors and adjusting for this bias. In this regard observational research is unable to match the ability of a RCT to account for this potential bias. Methods have been developed to better assess whether associations represent causal pathways that will be described later in this paper.
Information Bias
Observational research can be susceptible to other types of bias. Information bias refers to inaccurate assessment of the outcome, the exposure, or potential confounding variables. An example includes measurement of nutritional intake, which is often assessed by research subjects completing a food frequency survey or 24-hour dietary recall. Even if subjects report these intakes correctly, the likelihood is low that this will reflect long-term dietary intake exactly. Attempts have been made to reduce the error of these measurements through biomarker calibration that in one study was based on a urinary nitrogen protocol to estimate daily protein consumption over a 24-hour period ( Tinker et al., 2011 ). This analysis revealed a slight increase in risk of incident diabetes in association with a 20% higher protein intake in grams (Hazard Ratio 1.05, 95% CI 1.03–1.07). Recalibrated results based on the results of the urinary nitrogen protocol yielded a substantially higher diabetes hazard ratio of 1.82 (95% CI 1.56–2.12) that after adjustment for BMI was reduced to 1.16 (95% CI 1.05–2.28). In this example, reduction of measurement error yielded a difference of greater magnitude than see in the analysis based on dietary self-reports only without objective validation, although theoretically more accurate measurements may yield smaller differences, depending on the type and magnitude of measurement error.
Selection Bias
Selection bias may produce factitious exposure-disease associations if the study population fails to mirror the target population of interest. For example, selection of control subjects from among hospitalized patients as might be the case in a study based on administrative data may not accurately depict smoking prevalence among controls, given that smoking is related to multiple diseases that would increase the risk for hospitalization. Effective observational research must recognize the potential for bias and attempt to minimize it both in the design and analysis, as well as accurately describing limitations of these data and the implications for study validity in reports of results.
Agreement and Discrepancies between Observational and Clinical Trial Research
One way to assess whether the potential biases of observational studies result in failure to detect true associations is by comparison of observational versus RCT results on the same questions. Since observational studies of treatments often precede definitive clinical trials, several authors have assessed agreement between similar hypotheses tested using the gold standard compared to observational designs, concluding that agreement between the two is high. A comparison of 136 reports published between 1985 to 1998 on 19 different treatments found excellent agreement, with the combined magnitude of the effect in observational studies lying within the 95% confidence intervals of the combined magnitude of the effect in RCTs for 17 of the 19 hypotheses tested ( Benson & Hartz, 2000 ). Another comparison focused on comparing the results of meta-analyses of observation and clinical trial research on five clinical questions that were identified through a search of five major medical journals from 1991 to 1995 ( Concato, Shah & Horwitz, 2000 ). These investigators concluded that average results of these studies were “remarkably similar.”
In contrast, other research has demonstrated discrepancies between RCT and observational designs. The Women’s Health Initiative (WHI) was a RCT of dietary and menopausal hormone interventions to assess these effects on mortality, cardiovascular disease, and cancer risk ( Prentice et al., 2005 ). Perhaps unique to this study was the establishment of a concurrent observational study accompanying the randomized clinical trial, thereby permitting direct comparison of reported associations by type of research design within the same study framework. In the trial/observational study of estrogen plus progestin for menopausal hormone replacement, marked differences were seen between the treatment and control groups by participation in the RCT or observational study ( Table 2 ). In the RCT, no important differences were seen by treatment assignment for race, educational level, BMI, or current smoking status. This was not true by estrogen-progestin exposure in the observational study, where exposed women were more likely to be White, having completed a college degree or higher, and less likely to be current smokers or obese. Outcomes occurred more frequently in the estrogen-progestin arm of the RCT, but less frequently in the corresponding arm of the observational study, except for venous thromboembolism ( Table 2 ). Hazard ratios for these comparisons adjusted for imbalances in baseline potential confounding factors show a harmful effect of estrogen-progestin use that is statistically significantly elevated in 2 of 3 outcomes and a discordance with the observational results due to null, somewhat protective hazard ratios or in the case of venous thromboembolism, an elevated hazard ratio of considerably smaller magnitude than in the clinical trial. Although good agreement between clinical trials and observational research occurs often, the example of the WHI prevents having complete confidence in the results of observational studies.
Comparison of baseline characteristics and outcomes in the randomized controlled trial and observational study of estrogen-progestin treatment in the Women’s Health Initiative (1994–2002).
| Clinical Trial | Observational Study | |||
|---|---|---|---|---|
| Placebo Control | Estrogen-Progestin | Control | Estrogen-Progestin | |
| Baseline Characteristics | ||||
| White Race | 83.9% | 84.0% | 82.3% | 89.2% |
| Obese | 34.0% | 34.2% | 27.3% | 15.7% |
| College Degree or Higher | 35.3% | 34.5% | 42.9% | 53.4% |
| Current Smoker | 10.5% | 10.4% | 7.0% | 4.7% |
| Outcomes | ||||
| Coronary Heart Disease | 0.33 | 0.40 | 0.28 | 0.20 |
| Stroke | 0.24 | 0.32 | 0.22 | 0.17 |
| Venous Thromboembolism | 0.17 | 0.35 | 0.16 | 0.17 |
| Outcomes | Adjusted HR , 95% CI | Adjusted HR, 95% CI | ||
| Coronary Heart Disease | 1.27 (1.00–1.61) | 0.87 (0.72–1.05) | ||
| Stroke | 1.21 (0.93–1.59) | 0.86 (0.70–1.07) | ||
| Venous Thromboembolism | 2.13 (1.59–2.85) | 1.31 (1.07–1.61) | ||
Achievements of Observational Research
Despite the limitations of observational research design, many well-accepted causal associations in medicine are supported entirely or in part due to this type of investigation. Several examples include the association between hyperglycemia and diabetes complications including retinopathy, nephropathy, peripheral neuropathy, and ischemic heart disease ( 2013 ). Other well known examples include hypertension and stroke, smoking and lung cancer, asbestosis and mesothelioma, and LDL and HDL cholesterol concentrations and risk of ischemic heart disease ( Churg, 1988 ; Gordon, Kannel, Castelli & Dawber, 1981 ; Kannel, Wolf, Verter & McNamara, 1970 ; Pirie, Peto, Reeves, Green & Beral, 2013 ). In the case of complications due to hyperglycemia, high LDL-cholesterol concentration, and hypertension, clinical trials to reduce these levels have resulted in reductions in the rate of these outcomes, further supporting a causal association ( 1991 ; 1994 ; 1998 ; 1998 ). For many associations that involve an exposure that cannot be controlled by the investigator or should not be modified for ethical reasons, observational research may be the only avenue for direct testing of these associations in humans.
Causal Inference from Observational Research
The results of an observational research study are never interpreted in an information vacuum. Given the potential for bias with this study design, a number of other factors should be considered when weighing the strength of this evidence. First and foremost would be the replication of the finding in other observational research studies. Additional evidence to bolster the potential causal association would be support from the biological understanding of underlying mechanisms, animal experiments confirming that the exposure results in a similar outcome, and trend data in disease incidence following changes in exposure prevalence. For example, in the UK Million Women Study where median age was reported at 55 years, women who quit smoking completely at ages 25–34 or 35–44 years had only 3% and 10% of the excess mortality, respectively, seen among women who were continuing smokers ( Pirie, Peto, Reeves, Green & Beral, 2013 ). Coronary heart disease deaths in the U.S. declined by approximately 50% between 1980 to 2000. One analysis that addressed the reasons for this decline concluded that change in risk factors (reductions in total cholesterol concentration, systolic blood pressure, smoking, and physical inactivity) accounted for approximately 47% of this decrease ( Ford et al., 2007 ). These trends provide support for a causal association between smoking and lung cancer, and multiple cardiovascular disease risk factors and coronary death risk.
Pharmacoepidemiology
Many questions regarding the use of pharmaceuticals may never be answered through use of RCTs, thereby creating a need to address knowledge gaps using observational research. The specialized field of pharmacoepidemiology directly addresses these needs. The earliest appearance of the term “pharmacoepidemiology” on PubMed.com is in an article written in 1984 ( Lawson, 1984 ). The field of pharmacoepidemiology encompasses the use of observational research to assess pharmaceutical safety and effectiveness. For example, diabetes pharmaceuticals have received FDA approval based on efficacy at lowering glucose and safety, without the need to prove efficacy at preventing long-term complications. The sulfonylurea hypoglycemic agents glyburide and glipizide are in widespread use to manage the hyperglycemia of diabetes, but it is not clear whether one is associated with a greater reduction in hard outcomes such as mortality or diabetes complications, as this has not been tested in a clinical trial. Use of such surrogate endpoints as opposed to the hard outcomes one wishes to prevent has been criticized as an ineffective and potentially harmful approach to medication approval ( Fleming & DeMets, 1996 ; Psaty et al., 1999 ). Design of clinical trials to address hard as opposed to surrogate endpoints typically requires larger sample size, longer follow-up, and greater costs.
Observational research may also identify adverse effects associated with the use of pharmaceuticals that were not anticipated based on research conducted in support of the drug approval process. The withdrawal of the thiazolidinedione agent troglitazone from the U.S. market in 2000 followed reports on cases of severe liver toxicity during post-marketing surveillance. Similar data on a high number of reported cases of severe myopathies in cerivastatin users led to its withdrawal from the worldwide market in 2001 ( Furberg & Pitt, 2001 ). An observational study using administrative claims databases to assess the relative safety of lipid lowering medications in the U.S. between 2000–2004 reported a much higher risk for hospitalization for treatment of myopathy among cerivastatin users compared to users of other statin and non-stain lipid lowering agents ( Cziraky et al., 2006 ).
Confounding by Indication
As with other observational research designs, there are limitations to pharmacoepidemiology due to biases previous described, but in addition to these is the vexing phenomenon of confounding by indication, also referred to as channeling bias ( McMahon & MacDonald, 2000 ; Petri & Urquhart, 1991 ). This refers to an observed benefit (or harm) associated with a pharmaceutical due to the indications for treatment with it and not a medication effect. A hypothetical example of how confounding by indication results in outcome differences not due to medication effect is shown in Figure 2 , which provides an example of how the choice of a diabetes pharmaceutical may depend on the existence of a condition (higher serum creatinine reflecting lower GFR) associated with higher mortality risk ( Fox et al., 2012 ).

A hypothetical population of 2000 identical persons with type 2 diabetes differing only by renal function as measured by serum creatinine and assigned to either metformin or glipizide based on the serum creatinine level. The active treatment, though, is never dispensed, and instead substituted with a identical placebo. An expected difference in mortality is seen between the two groups given the association between poorer renal function and mortality in the glipizide group. This difference cannot be explained by the effect of the active pharmaceutical (since there was none) and therefore represents an example of confounding by indication.
Several approaches exist to the problem of confounding by indication. If there is no association between the indication for the pharmaceutical and the outcome of interest, then no bias will occur, since an association must also be present between both the indication and the outcome to yield a biased result. This same principle applies to all confounding factors ( van Stralen, Dekker, Zoccali & Jager, 2010 ). If the conditions for confounding are fulfilled, then statistical adjustment techniques are available to produce unbiased estimates of effect. Commonly used methods in biomedical research include linear regression analysis for continuous outcomes, logistic regression for categorical outcomes, and the Cox proportional hazards model for time-to-event outcomes. In addition, propensity scores have risen in popularity over the past decade. An “all fields” search of Pubmed conducted January 15, 2012 using the search term “propensity score” yielded 2,895 hits for the immediate past 5 years, and only 715 hits for the previous 5 years. The propensity score method models the probability of exposure in relation to predictor variables, and therefore estimates the likelihood, in the case of a pharmacoepidemiology study, of a subject receiving a particular pharmaceutical based on his or her characteristics ( Rubin, 2010 ). An additional step is required which uses standard previously mentioned adjustment methods to remove the bias associated with varying likelihood of receiving the pharmaceutical. Despite the rising popularity of this method, it has been demonstrated to be merely equivalent and sometimes inferior to standard multivariate adjustment methods ( Shah, Laupacis, Hux & Austin, 2005 ; Sturmer et al., 2006 ). Furthermore, propensity scores cannot address the issue of unmeasured confounding ( Cummings, 2008 ). So if the indications for the pharmaceutical cannot be determined from the other measured factors, neither multivariate adjustment or propensity scores will allow for adjustment and removal of bias.
Several design features of observational studies may increase the likelihood of confounding by indication but if recognized may be amenable to correction in the design or analysis phases of a study. Assessing outcomes for pharmaceuticals prescribed for different indications or by a comparison of populations who differ with regard to the presence of medication contraindications may introduce bias into comparisons. An assessment of the mortality risk associated with beta-blocker use compared to other antihypertensive medications should exclude participants in whom beta blockers but not other antihypertensive medications are prescribed for other indications, such as migraine headache or stage fright prophylaxis, as these conditions may be associated with better outcomes and lead to over-optimistic survival benefit. Also, failure to consider medication contraindications may lead to risk of the outcome differing by medication used, as seen in the example in Figure 2 which would lead to a higher frequency of subjects with renal insufficiency in the glipizide treatment group for hyperglycemia. To account for this potential bias, subjects with contraindications for use of any of the pharmaceuticals of interest in the comparison should be eliminated from the study. For example, recent studies of mortality and cardiovascular events among users of sulfonylurea or metformin monotherapy for treatment of diabetes in the Veterans Health Administration system excluded patients with serious medical conditions at baseline that might influence the prescription of diabetes medication ( Roumie et al., 2012 ; Wheeler et al., 2013 ). For example, some items on the list of exclusions were congestive heart failure, serum creatinine concentration of 1.5 mg/dl or greater, HIV, and other conditions described in this publication. Despite these design features and adjustment methods to correct for factors associated with a particular prescription that may also be associated with a different outcome risk, there will always be some uncertainty about the presence of bias due to residual confounding by indication.
Methods to Improve Causal Inference from Observational Research
Instrumental variables analysis has been promoted as a method to overcome the inability to exclude undetected confounding in observational research. This method involves identification of a factor that strongly predicts treatment (or exposure in an epidemiologic study not involving a pharmaceutical). This factor is referred to as an “instrument,” and it is used in a manner analogous to the intention to treat analysis employed in RCTs ( Thomas & Conti, 2004 ). A Mendelian Randomization study is a type of instrumental variable analysis that uses a genetic marker as the instrument ( Thomas & Conti, 2004 ). Although intriguing in concept, the difficulty is in the application, as this relies on finding an “instrument” that is (1) causally related to treatment but not unobserved risk factors for the outcome, and (2) influences the outcome only through its effect on treatment ( Hernan & Robins, 2006 ). This method is being explored in pharmacoepidemiologic investigations, with one example being use of physician prescribing preference for types of NSAIDS in the evaluation of the gastrointestinal toxicity of COX-2 inhibitors versus non-COX-2 inhibitor NSAIDS ( Brookhart, Wang, Solomon & Schneeweiss, 2006 ). This analysis reported a protective association with COX-2 inhibitors only in the instrumental variable analysis, leading the authors to conclude that this analysis resulted in a reduction in unmeasured confounding. Examples can also be found in the diabetes epidemiology literature, such as the lack of association between serum uric acid level and type 2 diabetes risk ( Pfister et al., 2011 ), and higher risk associated with lower sex hormone-binding globulin concentration ( Ding et al., 2009 ).
Conclusions
As it will not be possible to assess efficacy of all possible treatment comparisons in all possible groups of interest, or identify adverse (or unexpected beneficial) outcomes requiring longer follow-up or greater sample size using RCTs, observational research stands prepared to step forward to address these knowledge gaps. Much medical knowledge and practice currently rests on a foundation of observational research. Perhaps this is not noticed due to the gloss and novelty of recently completed RCTs. Little research has been conducted comparing results from observational and clinical trial designs, but that which has been completed finds generally good agreement in these findings. With any observational research finding, though, comes less certainly due to the inability to completely exclude the possibility of residual confounding, or in the case of a pharmaceutical, confounding by indication. However, the expectation of absolute certainty is unrealistic and inconsistent with the current practice of medicine, where decisions are made probabilistically, with the threshold for actions such as further testing or treatment varying widely depending on the comparative costs and benefits of true and false positive and negative decisions ( Boland & Lehmann, 2010 ; Pauker & Kassirer, 1980 ; Plasencia, Alderman, Baron, Rolfs & Boyko, 1992 ). Observational research definitely has had and will continue to have an important role in providing the information needed to improve medical decision-making. There is always room for improvement and the hope that the future will bring better methods to further reduce the uncertainty surrounding the validity of its results.
Acknowledgments
Grant Support: VA Epidemiologic Research and Information Center; the Diabetes Research Center at the University of Washington (DK-017047)
Thanks for James S. Floyd MD for his careful review of this manuscript. The work was supported by the VA Epidemiologic Research and Information Center; the Diabetes Research Center at the University of Washington (DK-017047); and VA Puget Sound Health Care System.
Publisher's Disclaimer: This is a PDF file of an unedited manuscript that has been accepted for publication. As a service to our customers we are providing this early version of the manuscript. The manuscript will undergo copyediting, typesetting, and review of the resulting proof before it is published in its final citable form. Please note that during the production process errors may be discovered which could affect the content, and all legal disclaimers that apply to the journal pertain.
- Prevention of stroke by antihypertensive drug treatment in older persons with isolated systolic hypertension. Final results of the Systolic Hypertension in the Elderly Program (SHEP). SHEP Cooperative Research Group. JAMA. 1991; 265 :3255–3264. [ PubMed ] [ Google Scholar ]
- 1994 Randomised trial of cholesterol lowering in 4444 patients with coronary heart disease: the Scandinavian Simvastatin Survival Study (4S) Lancet. 344 :1383–1389. [ PubMed ] [ Google Scholar ]
- Effect of intensive blood-glucose control with metformin on complications in overweight patients with type 2 diabetes (UKPDS 34). UK Prospective Diabetes Study (UKPDS) Group. Lancet. 1998; 352 :854–865. [ PubMed ] [ Google Scholar ]
- Intensive blood-glucose control with sulphonylureas or insulin compared with conventional treatment and risk of complications in patients with type 2 diabetes (UKPDS 33). UK Prospective Diabetes Study (UKPDS) Group. Lancet. 1998; 352 :837–853. [ PubMed ] [ Google Scholar ]
- Consumption of sweet beverages and type 2 diabetes incidence in European adults: results from EPIC-InterAct. Diabetologia. 2013; 56 :1520–1530. [ PubMed ] [ Google Scholar ]
- Diagnosis and classification of diabetes mellitus. Diabetes Care. 2013; 36 (Suppl 1):S67–74. [ PMC free article ] [ PubMed ] [ Google Scholar ]
- Benson K, Hartz AJ. A comparison of observational studies and randomized, controlled trials. N Engl J Med. 2000; 342 :1878–1886. [ PubMed ] [ Google Scholar ]
- Boland MV, Lehmann HP. A new method for determining physician decision thresholds using empiric, uncertain recommendations. BMC Med Inform Decis Mak. 2010; 10 :20. [ PMC free article ] [ PubMed ] [ Google Scholar ]
- Brookhart MA, Wang PS, Solomon DH, Schneeweiss S. Evaluating short-term drug effects using a physician-specific prescribing preference as an instrumental variable. Epidemiology. 2006; 17 :268–275. [ PMC free article ] [ PubMed ] [ Google Scholar ]
- Churg A. Chrysotile, tremolite, and malignant mesothelioma in man. Chest. 1988; 93 :621–628. [ PubMed ] [ Google Scholar ]
- Concato J, Shah N, Horwitz RI. Randomized, controlled trials, observational studies, and the hierarchy of research designs. N Engl J Med. 2000; 342 :1887–1892. [ PMC free article ] [ PubMed ] [ Google Scholar ]
- Cummings P. Propensity scores. Arch Pediatr Adolesc Med. 2008; 162 :734–737. [ PubMed ] [ Google Scholar ]
- Cziraky MJ, Willey VJ, McKenney JM, Kamat SA, Fisher MD, Guyton JR, et al. Statin safety: an assessment using an administrative claims database. Am J Cardiol. 2006; 97 :61C–68C. [ PubMed ] [ Google Scholar ]
- Ding EL, Song Y, Manson JE, Hunter DJ, Lee CC, Rifai N, et al. Sex hormone-binding globulin and risk of type 2 diabetes in women and men. N Engl J Med. 2009; 361 :1152–1163. [ PMC free article ] [ PubMed ] [ Google Scholar ]
- DiPietro NA. Methods in epidemiology: observational study designs. Pharmacotherapy. 2010; 30 :973–984. [ PubMed ] [ Google Scholar ]
- Efird J. Blocked randomization with randomly selected block sizes. Int J Environ Res Public Health. 2011; 8 :15–20. [ PMC free article ] [ PubMed ] [ Google Scholar ]
- Fleming TR, DeMets DL. Surrogate end points in clinical trials: are we being misled? Ann Intern Med. 1996; 125 :605–613. [ PubMed ] [ Google Scholar ]
- Ford ES, Ajani UA, Croft JB, Critchley JA, Labarthe DR, Kottke TE, et al. Explaining the decrease in U.S. deaths from coronary disease, 1980–2000. N Engl J Med. 2007; 356 :2388–2398. [ PubMed ] [ Google Scholar ]
- Fox CS, Matsushita K, Woodward M, Bilo HJ, Chalmers J, Heerspink HJ, et al. Associations of kidney disease measures with mortality and end-stage renal disease in individuals with and without diabetes: a meta-analysis. Lancet. 2012; 380 :1662–1673. [ PMC free article ] [ PubMed ] [ Google Scholar ]
- Furberg CD, Pitt B. Withdrawal of cerivastatin from the world market. Curr Control Trials Cardiovasc Med. 2001; 2 :205–207. [ PMC free article ] [ PubMed ] [ Google Scholar ]
- Gordon T, Kannel WB, Castelli WP, Dawber TR. Lipoproteins, cardiovascular disease, and death. The Framingham study. Arch Intern Med. 1981; 141 :1128–1131. [ PubMed ] [ Google Scholar ]
- Grimes DA, Schulz KF. Bias and causal associations in observational research. Lancet. 2002; 359 :248–252. [ PubMed ] [ Google Scholar ]
- Hernan MA, Robins JM. Instruments for causal inference: an epidemiologist’s dream? Epidemiology. 2006; 17 :360–372. [ PubMed ] [ Google Scholar ]
- Hill AB. The Environment and Disease: Association or Causation? Proceedings of the Royal Society of Medicine. 1965; 58 :295–300. [ PMC free article ] [ PubMed ] [ Google Scholar ]
- Kannel WB, Wolf PA, Verter J, McNamara PM. Epidemiologic assessment of the role of blood pressure in stroke. The Framingham study. JAMA. 1970; 214 :301–310. [ PubMed ] [ Google Scholar ]
- Knowler WC, Williams RC, Pettitt DJ, Steinberg AG. Gm3;5,13,14 and type 2 diabetes mellitus: an association in American Indians with genetic admixture. American journal of human genetics. 1988; 43 :520–526. [ PMC free article ] [ PubMed ] [ Google Scholar ]
- Lawson DH. Pharmacoepidemiology: a new discipline. Br Med J (Clin Res Ed) 1984; 289 :940–941. [ PMC free article ] [ PubMed ] [ Google Scholar ]
- Leibel B. An analysis of the University Group Diabetes Study Program: data results and conslusions. Can Med Assoc J. 1971; 105 :292–294. [ PMC free article ] [ PubMed ] [ Google Scholar ]
- McMahon AD, MacDonald TM. Design issues for drug epidemiology. Br J Clin Pharmacol. 2000; 50 :419–425. [ PMC free article ] [ PubMed ] [ Google Scholar ]
- Meldrum ML. A brief history of the randomized controlled trial. From oranges and lemons to the gold standard. Hematol Oncol Clin North Am. 2000; 14 :745–760. vii. [ PubMed ] [ Google Scholar ]
- Pauker SG, Kassirer JP. The threshold approach to clinical decision making. N Engl J Med. 1980; 302 :1109–1117. [ PubMed ] [ Google Scholar ]
- Petri H, Urquhart J. Channeling bias in the interpretation of drug effects. Stat Med. 1991; 10 :577–581. [ PubMed ] [ Google Scholar ]
- Pfister R, Barnes D, Luben R, Forouhi NG, Bochud M, Khaw KT, et al. No evidence for a causal link between uric acid and type 2 diabetes: a Mendelian randomisation approach. Diabetologia. 2011; 54 :2561–2569. [ PubMed ] [ Google Scholar ]
- Phillips CV, Goodman KJ. The missed lessons of Sir Austin Bradford Hill. Epidemiol Perspect Innov. 2004; 1 :3. [ PMC free article ] [ PubMed ] [ Google Scholar ]
- Pirie K, Peto R, Reeves GK, Green J, Beral V. The 21st century hazards of smoking and benefits of stopping: a prospective study of one million women in the UK. Lancet. 2013; 381 :133–141. [ PMC free article ] [ PubMed ] [ Google Scholar ]
- Plasencia CM, Alderman BW, Baron AE, Rolfs RT, Boyko EJ. A method to describe physician decision thresholds and its application in examining the diagnosis of coronary artery disease based on exercise treadmill testing. Med Decis Making. 1992; 12 :204–212. [ PubMed ] [ Google Scholar ]
- Prentice RL, Langer R, Stefanick ML, Howard BV, Pettinger M, Anderson G, et al. Combined postmenopausal hormone therapy and cardiovascular disease: toward resolving the discrepancy between observational studies and the Women’s Health Initiative clinical trial. Am J Epidemiol. 2005; 162 :404–414. [ PubMed ] [ Google Scholar ]
- Psaty BM, Weiss NS, Furberg CD, Koepsell TD, Siscovick DS, Rosendaal FR, et al. Surrogate end points, health outcomes, and the drug-approval process for the treatment of risk factors for cardiovascular disease. JAMA. 1999; 282 :786–790. [ PubMed ] [ Google Scholar ]
- Rothman KJ, Greenland S. Causation and causal inference in epidemiology. Am J Public Health. 2005; 95 (Suppl 1):S144–150. [ PubMed ] [ Google Scholar ]
- Roumie CL, Hung AM, Greevy RA, Grijalva CG, Liu X, Murff HJ, et al. Comparative effectiveness of sulfonylurea and metformin monotherapy on cardiovascular events in type 2 diabetes mellitus: a cohort study. Ann Intern Med. 2012; 157 :601–610. [ PMC free article ] [ PubMed ] [ Google Scholar ]
- Rubin DB. Propensity score methods. Am J Ophthalmol. 2010; 149 :7–9. [ PubMed ] [ Google Scholar ]
- Rubin RR, Fujimoto WY, Marrero DG, Brenneman T, Charleston JB, Edelstein SL, et al. The Diabetes Prevention Program: recruitment methods and results. Control Clin Trials. 2002; 23 :157–171. [ PubMed ] [ Google Scholar ]
- Shah BR, Laupacis A, Hux JE, Austin PC. Propensity score methods gave similar results to traditional regression modeling in observational studies: a systematic review. J Clin Epidemiol. 2005; 58 :550–559. [ PubMed ] [ Google Scholar ]
- Sobek M, Cleveland L, Flood S, Hall PK, King ML, Ruggles S, et al. Big Data: Large-Scale Historical Infrastructure from the Minnesota Population Center. Hist Methods. 2011; 44 :61–68. [ PMC free article ] [ PubMed ] [ Google Scholar ]
- Sturmer T, Joshi M, Glynn RJ, Avorn J, Rothman KJ, Schneeweiss S. A review of the application of propensity score methods yielded increasing use, advantages in specific settings, but not substantially different estimates compared with conventional multivariable methods. J Clin Epidemiol. 2006; 59 :437–447. [ PMC free article ] [ PubMed ] [ Google Scholar ]
- Thomas DC, Conti DV. Commentary: the concept of ‘Mendelian Randomization’ Int J Epidemiol. 2004; 33 :21–25. [ PubMed ] [ Google Scholar ]
- Tinker LF, Sarto GE, Howard BV, Huang Y, Neuhouser ML, Mossavar-Rahmani Y, et al. Biomarker-calibrated dietary energy and protein intake associations with diabetes risk among postmenopausal women from the Women’s Health Initiative. Am J Clin Nutr. 2011; 94 :1600–1606. [ PMC free article ] [ PubMed ] [ Google Scholar ]
- van Stralen KJ, Dekker FW, Zoccali C, Jager KJ. Confounding. Nephron Clin Pract. 2010; 116 :c143–147. [ PubMed ] [ Google Scholar ]
- Wheeler S, Moore K, Forsberg CW, Riley K, Floyd JS, Smith NL, et al. Mortality among veterans with type 2 diabetes initiating metformin, sulfonylurea or rosiglitazone monotherapy. Diabetologia 2013 [ PubMed ] [ Google Scholar ]
- Wysowski DK, Swartz L. Adverse drug event surveillance and drug withdrawals in the United States, 1969–2002: the importance of reporting suspected reactions. Arch Intern Med. 2005; 165 :1363–1369. [ PubMed ] [ Google Scholar ]
Behavioral Research Blog
By noldus information technology, search the blog, subscribe to the blog - get updated monthly.

Two examples of on-site observational studies with older persons
In some cases, it is necessary to bring your research to your participants. For example, you might want to observe people in a natural setting: at home , in a shop, in the classroom, or in the office.
Another case where on-site research would be beneficial is when your participants are experiencing health issues, preventing them from travelling to your lab. Conducting your research on location enables you to study people that are otherwise difficult to reach.
These factors should be taken into consideration when choosing the location for your research, especially when conducting studies with older age groups.
Practical aspects of on-site observational studies
If you want to conduct your study in another location, there are some practical aspects to think about. For example, you have to set the right lighting conditions and camera position. You also have to make sure that you capture voices and other sounds accurately.

Do you want to learn more how to set up an AV lab? Read on for the perfect tips & tricks!
- Which requirements do you need?
- What equipment is needed?
- Download this free 'how to' guide!
Observational research examples
The first study we describe in this blog post explores how familiarity influences the use of electronic devices in different age groups. In the second study, researchers compared different methods of observing pain expressions in dementia patients.
Example 1: Familiarity and intuitive use
Improving products for older age groups.
It is generally assumed that older adults have difficulty using modern electronic devices, such as mobile telephones or computers. Because this age group is growing in most countries, changing products and processes to adapt to their needs is increasingly more important.
Improving technological experiences in older age groups supports their social inclusion, productivity, and their independence. To gain more insight in the learning processes involved in using electronic devices, Lawry and his colleagues compared levels of familiarity between age groups.
Comparing familiarity between older and younger adults
Familiarity describes the way an action is recognized or understood, based on prior experience and knowledge. It develops from a general level of knowledge, to knowledge that is based on experience, and finally to effortless and unconscious action.
The researchers identified several behaviors that suggest familiarity with an action. These include anticipation and planning, relative speed, verbalization, and task attention. They recorded these behaviors during a verbal report of how participants thought they would perform a task, as well as during the performance of the task itself.
Specifically, participants were asked to use a product they were familiar with and a product that was new to them. The study included 32 participants with different educational backgrounds, who were divided into different age groups (18-44, 45-59, 60-74, and 75+).
Observing familiarity at home
What better place to study familiarity than in the familiar place of home? By conducting part of their research in the participants’ homes, researcher Lawry and his team created a more realistic learning environment, had easy access to familiar products, and were able to recruit older participants more easily.
They coded verbal and visual data from both studies using The Observer XT , and used this software to calculate inter-rater reliability as well. Results showed significant differences in familiarity between age groups, concerning both known and new products.

Request a free trial and see for yourself how easy behavioral research can be!
- Work faster
- Reduce costs
- Get better data
Differences between younger and older adults
When using their own products, the youngest adult group showed more familiar behaviors than the two oldest groups. These younger participants also showed more familiarity when using a new product, compared to all other age groups.
Importantly, these results indicate that intuitive use of new products declines as early as during middle age. Therefore, the researchers advise product designers to incorporate more features that are based on prior knowledge of both middle-aged and older adults.
Example 2: Pain expressions in dementia
Observing pain expressions.
In dementia, severe cognitive impairment can lead to an inability to communicate verbally. When these patients can’t tell their caregivers about the pain they feel, an accurate assessment of pain expressions becomes essential.
Browne and her colleagues examined how the angle of observation influences this assessment, both in trained and untrained observers. It is widely assumed that a front view provides the most information on pain. However, caregivers also often observe patients from the side.
Not only can this information be used to improve human observations, but it can also support the development of computer vision systems, further improving care for people with dementia.
On-site observational study
The researchers included 102 adults over the age of 65 in their study, with and without dementia.
Video recordings were made from both the front and profile of their faces, during a physiotherapy examination and a baseline period. Observers used this video data to assess pain expressions with two different coding systems.
They made their observations in long-term care facilities and an outpatient physiotherapy clinic. This approach provided opportunities to observe participants in their beds, as well as during their treatments.
When analyzing their data, Browne and her colleagues used The Observer XT to code the video data and calculate reliability between raters.
Benefits of a profile view
Both trained and untrained observers were able to discriminate between pain and pain-free situations. When comparing assessments between these observers, results showed that undergraduate students relied less on specific pain cues when making their observations.
During physiotherapy, the students also rated pain intensity higher and more accurately when viewing patients’ profiles. This suggests that the assessments of less experienced observers could improve when including a profile view.
Observer accuracy may also benefit from the use of computerized systems, particularly when viewing patients from the front.

Download the free FaceReader methodology note to learn more about facial expression analysis theory.
- How FaceReader works
- More about the calibration
- Insight in quality of analysis & output
Interested in human behavior research? Read more on 'How to study human behavior' !
- Lawry, S.; Popovic, V.; Blackler, A.; Thompson, H. (2019). Age, familiarity, and intuitive use: an empirical investigation. Applied Ergonomics , 74 , 74-84.
- Browne, E.; Hadjistavropoulos, T.; Prkachin, K.; Ashraf, A.; Taati, B. (2019). Pain expressions in dementia: validity of observers’ pain judgments as a function of angle of observation. Journal of Nonverbal Behavior , https://doi.org/10.1007/s10919-019-00303-4.
Get the latest blog posts delivered to your inbox - every 15 th of the month
Want to learn more? Download the free white paper on FaceReader Methodology!

White paper download "FaceReader Methodology"

Positive Behavior Support: Good behavior can be learned

Autism research - mothers of high-risk children use more gestures

Examining parent-adolescent interactions during a career discussion
Contact information, global headquarters, north american headquarters, asian headquarters, main applications, human behavior research, animal behavior research, main products.
Copyright © 2024 Noldus Information Technology BV. All rights reserved.

An official website of the United States government
Here’s how you know
Official websites use .gov A .gov website belongs to an official government organization in the United States.
Secure .gov websites use HTTPS A lock ( Lock A locked padlock ) or https:// means you’ve safely connected to the .gov website. Share sensitive information only on official, secure websites.
- Human Subjects Research
Types of Human Subjects Research
On this page, analysis of existing data or specimens, observational studies, interventional studies.
If you're using private information, data, or specimens, your research may be exempt from the Code of Federal Regulations 45 Part 46. You may refer to the NIH Office of Extramural Research (OER) decision tool or consult with your institutional review board (IRB) or independent ethics committee (IEC). The NIDCR evaluates each project independently to determine oversight needs and whether the NIDCR Clinical Terms of Award (CToA) applies.
Toolkit for Analysis of Existing Data
In an observational study, the investigator simply records observations and analyzes data, without assigning participants to a specific intervention or treatment. These studies may focus on observation of risk factors, natural history, variations in disease progression or disease treatment without delivering or assigning an intervention. They often assess specific health characteristics of the enrolled human subjects by collecting medical/dental history, exposure, or clinical data; obtaining biospecimens (e.g., for biomarker or genomic analyses); or obtaining photographic, radiographic or other images from research subjects.
Toolkit for Observational Studies
The NIH defines an intervention as a manipulation of the subject or the subject's environment for the purpose of modifying one or more health-related biomedical or behavioral processes and/or endpoints. The NIH further defines a clinical trial as a research study in which one or more human subjects are prospectively assigned to one or more interventions (which may include placebo or other control) to evaluate the effects of those interventions on health-related biomedical or behavioral outcomes.
Toolkit for Interventional Studies
Science and the scientific method: Definitions and examples
Here's a look at the foundation of doing science — the scientific method.

The scientific method
Hypothesis, theory and law, a brief history of science, additional resources, bibliography.
Science is a systematic and logical approach to discovering how things in the universe work. It is also the body of knowledge accumulated through the discoveries about all the things in the universe.
The word "science" is derived from the Latin word "scientia," which means knowledge based on demonstrable and reproducible data, according to the Merriam-Webster dictionary . True to this definition, science aims for measurable results through testing and analysis, a process known as the scientific method. Science is based on fact, not opinion or preferences. The process of science is designed to challenge ideas through research. One important aspect of the scientific process is that it focuses only on the natural world, according to the University of California, Berkeley . Anything that is considered supernatural, or beyond physical reality, does not fit into the definition of science.
When conducting research, scientists use the scientific method to collect measurable, empirical evidence in an experiment related to a hypothesis (often in the form of an if/then statement) that is designed to support or contradict a scientific theory .
"As a field biologist, my favorite part of the scientific method is being in the field collecting the data," Jaime Tanner, a professor of biology at Marlboro College, told Live Science. "But what really makes that fun is knowing that you are trying to answer an interesting question. So the first step in identifying questions and generating possible answers (hypotheses) is also very important and is a creative process. Then once you collect the data you analyze it to see if your hypothesis is supported or not."

The steps of the scientific method go something like this, according to Highline College :
- Make an observation or observations.
- Form a hypothesis — a tentative description of what's been observed, and make predictions based on that hypothesis.
- Test the hypothesis and predictions in an experiment that can be reproduced.
- Analyze the data and draw conclusions; accept or reject the hypothesis or modify the hypothesis if necessary.
- Reproduce the experiment until there are no discrepancies between observations and theory. "Replication of methods and results is my favorite step in the scientific method," Moshe Pritsker, a former post-doctoral researcher at Harvard Medical School and CEO of JoVE, told Live Science. "The reproducibility of published experiments is the foundation of science. No reproducibility — no science."
Some key underpinnings to the scientific method:
- The hypothesis must be testable and falsifiable, according to North Carolina State University . Falsifiable means that there must be a possible negative answer to the hypothesis.
- Research must involve deductive reasoning and inductive reasoning . Deductive reasoning is the process of using true premises to reach a logical true conclusion while inductive reasoning uses observations to infer an explanation for those observations.
- An experiment should include a dependent variable (which does not change) and an independent variable (which does change), according to the University of California, Santa Barbara .
- An experiment should include an experimental group and a control group. The control group is what the experimental group is compared against, according to Britannica .
The process of generating and testing a hypothesis forms the backbone of the scientific method. When an idea has been confirmed over many experiments, it can be called a scientific theory. While a theory provides an explanation for a phenomenon, a scientific law provides a description of a phenomenon, according to The University of Waikato . One example would be the law of conservation of energy, which is the first law of thermodynamics that says that energy can neither be created nor destroyed.
A law describes an observed phenomenon, but it doesn't explain why the phenomenon exists or what causes it. "In science, laws are a starting place," said Peter Coppinger, an associate professor of biology and biomedical engineering at the Rose-Hulman Institute of Technology. "From there, scientists can then ask the questions, 'Why and how?'"
Laws are generally considered to be without exception, though some laws have been modified over time after further testing found discrepancies. For instance, Newton's laws of motion describe everything we've observed in the macroscopic world, but they break down at the subatomic level.
This does not mean theories are not meaningful. For a hypothesis to become a theory, scientists must conduct rigorous testing, typically across multiple disciplines by separate groups of scientists. Saying something is "just a theory" confuses the scientific definition of "theory" with the layperson's definition. To most people a theory is a hunch. In science, a theory is the framework for observations and facts, Tanner told Live Science.

The earliest evidence of science can be found as far back as records exist. Early tablets contain numerals and information about the solar system , which were derived by using careful observation, prediction and testing of those predictions. Science became decidedly more "scientific" over time, however.
1200s: Robert Grosseteste developed the framework for the proper methods of modern scientific experimentation, according to the Stanford Encyclopedia of Philosophy. His works included the principle that an inquiry must be based on measurable evidence that is confirmed through testing.
1400s: Leonardo da Vinci began his notebooks in pursuit of evidence that the human body is microcosmic. The artist, scientist and mathematician also gathered information about optics and hydrodynamics.
1500s: Nicolaus Copernicus advanced the understanding of the solar system with his discovery of heliocentrism. This is a model in which Earth and the other planets revolve around the sun, which is the center of the solar system.
1600s: Johannes Kepler built upon those observations with his laws of planetary motion. Galileo Galilei improved on a new invention, the telescope, and used it to study the sun and planets. The 1600s also saw advancements in the study of physics as Isaac Newton developed his laws of motion.
1700s: Benjamin Franklin discovered that lightning is electrical. He also contributed to the study of oceanography and meteorology. The understanding of chemistry also evolved during this century as Antoine Lavoisier, dubbed the father of modern chemistry , developed the law of conservation of mass.
1800s: Milestones included Alessandro Volta's discoveries regarding electrochemical series, which led to the invention of the battery. John Dalton also introduced atomic theory, which stated that all matter is composed of atoms that combine to form molecules. The basis of modern study of genetics advanced as Gregor Mendel unveiled his laws of inheritance. Later in the century, Wilhelm Conrad Röntgen discovered X-rays , while George Ohm's law provided the basis for understanding how to harness electrical charges.
1900s: The discoveries of Albert Einstein , who is best known for his theory of relativity, dominated the beginning of the 20th century. Einstein's theory of relativity is actually two separate theories. His special theory of relativity, which he outlined in a 1905 paper, " The Electrodynamics of Moving Bodies ," concluded that time must change according to the speed of a moving object relative to the frame of reference of an observer. His second theory of general relativity, which he published as " The Foundation of the General Theory of Relativity ," advanced the idea that matter causes space to curve.
In 1952, Jonas Salk developed the polio vaccine , which reduced the incidence of polio in the United States by nearly 90%, according to Britannica . The following year, James D. Watson and Francis Crick discovered the structure of DNA , which is a double helix formed by base pairs attached to a sugar-phosphate backbone, according to the National Human Genome Research Institute .
2000s: The 21st century saw the first draft of the human genome completed, leading to a greater understanding of DNA. This advanced the study of genetics, its role in human biology and its use as a predictor of diseases and other disorders, according to the National Human Genome Research Institute .
- This video from City University of New York delves into the basics of what defines science.
- Learn about what makes science science in this book excerpt from Washington State University .
- This resource from the University of Michigan — Flint explains how to design your own scientific study.
Merriam-Webster Dictionary, Scientia. 2022. https://www.merriam-webster.com/dictionary/scientia
University of California, Berkeley, "Understanding Science: An Overview." 2022. https://undsci.berkeley.edu/article/0_0_0/intro_01
Highline College, "Scientific method." July 12, 2015. https://people.highline.edu/iglozman/classes/astronotes/scimeth.htm
North Carolina State University, "Science Scripts." https://projects.ncsu.edu/project/bio183de/Black/science/science_scripts.html
University of California, Santa Barbara. "What is an Independent variable?" October 31,2017. http://scienceline.ucsb.edu/getkey.php?key=6045
Encyclopedia Britannica, "Control group." May 14, 2020. https://www.britannica.com/science/control-group
The University of Waikato, "Scientific Hypothesis, Theories and Laws." https://sci.waikato.ac.nz/evolution/Theories.shtml
Stanford Encyclopedia of Philosophy, Robert Grosseteste. May 3, 2019. https://plato.stanford.edu/entries/grosseteste/
Encyclopedia Britannica, "Jonas Salk." October 21, 2021. https://www.britannica.com/ biography /Jonas-Salk
National Human Genome Research Institute, "Phosphate Backbone." https://www.genome.gov/genetics-glossary/Phosphate-Backbone
National Human Genome Research Institute, "What is the Human Genome Project?" https://www.genome.gov/human-genome-project/What
Live Science contributor Ashley Hamer updated this article on Jan. 16, 2022.
Sign up for the Live Science daily newsletter now
Get the world’s most fascinating discoveries delivered straight to your inbox.
Y chromosome is evolving faster than the X, primate study reveals
Earth from space: Trio of ringed ice caps look otherworldly on Russian Arctic islands
Strawberry Moon 2024: See summer's first full moon rise a day after solstice
Most Popular
- 2 How long would it take to reach Planet 9, if we ever find it?
- 3 NASA will put a 'new star' in the sky by the end of the decade in 1st-of-its-kind mission
- 4 Florida shark attacks caused by heat, not scary orcas, experts say
- 5 NASA engineers finally fix Voyager 1 spacecraft — from 15 billion miles away
- 2 Scientists inserted a window in a man's skull to read his brain with ultrasound
- 3 Gilgamesh flood tablet: A 2,600-year-old text that's eerily similar to the story of Noah's Ark
- 4 Y chromosome is evolving faster than the X, primate study reveals
- 5 The sun's magnetic field is about to flip. Here's what to expect.
A step-by-step guide to causal study design using real-world data
- Open access
- Published: 19 June 2024
Cite this article
You have full access to this open access article

- Sarah Ruth Hoffman 1 ,
- Nilesh Gangan 1 ,
- Xiaoxue Chen 2 ,
- Joseph L. Smith 1 ,
- Arlene Tave 1 ,
- Yiling Yang 1 ,
- Christopher L. Crowe 1 ,
- Susan dosReis 3 &
- Michael Grabner 1
Due to the need for generalizable and rapidly delivered evidence to inform healthcare decision-making, real-world data have grown increasingly important to answer causal questions. However, causal inference using observational data poses numerous challenges, and relevant methodological literature is vast. We endeavored to identify underlying unifying themes of causal inference using real-world healthcare data and connect them into a single schema to aid in observational study design, and to demonstrate this schema using a previously published research example. A multidisciplinary team (epidemiology, biostatistics, health economics) reviewed the literature related to causal inference and observational data to identify key concepts. A visual guide to causal study design was developed to concisely and clearly illustrate how the concepts are conceptually related to one another. A case study was selected to demonstrate an application of the guide. An eight-step guide to causal study design was created, integrating essential concepts from the literature, anchored into conceptual groupings according to natural steps in the study design process. The steps include defining the causal research question and the estimand; creating a directed acyclic graph; identifying biases and design and analytic techniques to mitigate their effect, and techniques to examine the robustness of findings. The cardiovascular case study demonstrates the applicability of the steps to developing a research plan. This paper used an existing study to demonstrate the relevance of the guide. We encourage researchers to incorporate this guide at the study design stage in order to elevate the quality of future real-world evidence.
Avoid common mistakes on your manuscript.
1 Introduction
Approximately 50 new drugs are approved each year in the United States (Mullard 2022 ). For all new drugs, randomized controlled trials (RCTs) are the gold-standard by which potential effectiveness (“efficacy”) and safety are established. However, RCTs cannot guarantee how a drug will perform in a less controlled context. For this reason, regulators frequently require observational, post-approval studies using “real-world” data, sometimes even as a condition of drug approval. The “real-world” data requested by regulators is often derived from insurance claims databases and/or healthcare records. Importantly, these data are recorded during routine clinical care without concern for potential use in research. Yet, in recent years, there has been increasing use of such data for causal inference and regulatory decision making, presenting a variety of methodologic challenges for researchers and stakeholders to consider (Arlett et al. 2022 ; Berger et al. 2017 ; Concato and ElZarrad 2022 ; Cox et al. 2009 ; European Medicines Agency 2023 ; Franklin and Schneeweiss 2017 ; Girman et al. 2014 ; Hernán and Robins 2016 ; International Society for Pharmacoeconomics and Outcomes Research (ISPOR) 2022 ; International Society for Pharmacoepidemiology (ISPE) 2020 ; Stuart et al. 2013 ; U.S. Food and Drug Administration 2018 ; Velentgas et al. 2013 ).
Current guidance for causal inference using observational healthcare data articulates the need for careful study design (Berger et al. 2017 ; Cox et al. 2009 ; European Medicines Agency 2023 ; Girman et al. 2014 ; Hernán and Robins 2016 ; Stuart et al. 2013 ; Velentgas et al. 2013 ). In 2009, Cox et al. described common sources of bias in observational data and recommended specific strategies to mitigate these biases (Cox et al. 2009 ). In 2013, Stuart et al. emphasized counterfactual theory and trial emulation, offered several approaches to address unmeasured confounding, and provided guidance on the use of propensity scores to balance confounding covariates (Stuart et al. 2013 ). In 2013, the Agency for Healthcare Research and Quality (AHRQ) released an extensive, 200-page guide to developing a protocol for comparative effectiveness research using observational data (Velentgas et al. 2013 ). The guide emphasized development of the research question, with additional chapters on study design, comparator selection, sensitivity analyses, and directed acyclic graphs (Velentgas et al. 2013 ). In 2014, Girman et al. provided a clear set of steps for assessing study feasibility including examination of the appropriateness of the data for the research question (i.e., ‘fit-for-purpose’), empirical equipoise, and interpretability, stating that comparative effectiveness research using observational data “should be designed with the goal of drawing a causal inference” (Girman et al. 2014 ). In 2017 , Berger et al. described aspects of “study hygiene,” focusing on procedural practices to enhance confidence in, and credibility of, real-world data studies (Berger et al. 2017 ). Currently, the European Network of Centres for Pharmacoepidemiology and Pharmacovigilance (ENCePP) maintains a guide on methodological standards in pharmacoepidemiology which discusses causal inference using observational data and includes an overview of study designs, a chapter on methods to address bias and confounding, and guidance on writing statistical analysis plans (European Medicines Agency 2023 ). In addition to these resources, the “target trial framework” provides a structured approach to planning studies for causal inferences from observational databases (Hernán and Robins 2016 ; Wang et al. 2023b ). This framework, published in 2016, encourages researchers to first imagine a clinical trial for the study question of interest and then to subsequently design the observational study to reflect the hypothetical trial (Hernán and Robins 2016 ).
While the literature addresses critical issues collectively, there remains a need for a framework that puts key components, including the target trial approach, into a simple, overarching schema (Loveless 2022 ) so they can be more easily remembered, and communicated to all stakeholders including (new) researchers, peer-reviewers, and other users of the research findings (e.g., practicing providers, professional clinical societies, regulators). For this reason, we created a step-by-step guide for causal inference using administrative health data, which aims to integrate these various best practices at a high level and complements existing, more specific guidance, including those from the International Society for Pharmacoeconomics and Outcomes Research (ISPOR) and the International Society for Pharmacoepidemiology (ISPE) (Berger et al. 2017 ; Cox et al. 2009 ; Girman et al. 2014 ). We demonstrate the application of this schema using a previously published paper in cardiovascular research.
This work involved a formative phase and an implementation phase to evaluate the utility of the causal guide. In the formative phase, a multidisciplinary team with research expertise in epidemiology, biostatistics, and health economics reviewed selected literature (peer-reviewed publications, including those mentioned in the introduction, as well as graduate-level textbooks) related to causal inference and observational healthcare data from the pharmacoepidemiologic and pharmacoeconomic perspectives. The potential outcomes framework served as the foundation for our conception of causal inference (Rubin 2005 ). Information was grouped into the following four concepts: (1) Defining the Research Question; (2) Defining the Estimand; (3) Identifying and Mitigating Biases; (4) Sensitivity Analysis. A step-by-step guide to causal study design was developed to distill the essential elements of each concept, organizing them into a single schema so that the concepts are clearly related to one another. References for each step of the schema are included in the Supplemental Table.
In the implementation phase we tested the application of the causal guide to previously published work (Dondo et al. 2017 ). The previously published work utilized data from the Myocardial Ischaemia National Audit Project (MINAP), the United Kingdom’s national heart attack register. The goal of the study was to assess the effect of β-blockers on all-cause mortality among patients hospitalized for acute myocardial infarction without heart failure or left ventricular systolic dysfunction. We selected this paper for the case study because of its clear descriptions of the research goal and methods, and the explicit and methodical consideration of potential biases and use of sensitivity analyses to examine the robustness of the main findings.
3.1 Overview of the eight steps
The step-by-step guide to causal inference comprises eight distinct steps (Fig. 1 ) across the four concepts. As scientific inquiry and study design are iterative processes, the various steps may be completed in a different order than shown, and steps may be revisited.

A step-by-step guide for causal study design
Abbreviations: GEE: generalized estimating equations; IPC/TW: inverse probability of censoring/treatment weighting; ITR: individual treatment response; MSM: marginal structural model; TE: treatment effect
Please refer to the Supplemental Table for references providing more in-depth information.
1 Ensure that the exposure and outcome are well-defined based on literature and expert opinion.
2 More specifically, measures of association are not affected by issues such as confounding and selection bias because they do not intend to isolate and quantify a single causal pathway. However, information bias (e.g., variable misclassification) can negatively affect association estimates, and association estimates remain subject to random variability (and are hence reported with confidence intervals).
3 This list is not exhaustive; it focuses on frequently encountered biases.
4 To assess bias in a nonrandomized study following the target trial framework, use of the ROBINS-I tool is recommended ( https://www.bmj.com/content/355/bmj.i4919 ).
5 Only a selection of the most popular approaches is presented here. Other methods exist; e.g., g-computation and g-estimation for both time-invariant and time-varying analysis; instrumental variables; and doubly-robust estimation methods. There are also program evaluation methods (e.g., difference-in-differences, regression discontinuities) that can be applied to pharmacoepidemiologic questions. Conventional outcome regression analysis is not recommended for causal estimation due to issues determining covariate balance, correct model specification, and interpretability of effect estimates.
6 Online tools include, among others, an E-value calculator for unmeasured confounding ( https://www.evalue-calculator.com /) and the P95 outcome misclassification estimator ( http://apps.p-95.com/ISPE /).
3.2 Defining the Research question (step 1)
The process of designing a study begins with defining the research question. Research questions typically center on whether a causal relationship exists between an exposure and an outcome. This contrasts with associative questions, which, by their nature, do not require causal study design elements because they do not attempt to isolate a causal pathway from a single exposure to an outcome under study. It is important to note that the phrasing of the question itself should clarify whether an association or a causal relationship is of interest. The study question “Does statin use reduce the risk of future cardiovascular events?” is explicitly causal and requires that the study design addresses biases such as confounding. In contrast, the study question “Is statin use associated with a reduced risk of future cardiovascular events?” can be answered without control of confounding since the word “association” implies correlation. Too often, however, researchers use the word “association” to describe their findings when their methods were created to address explicitly causal questions (Hernán 2018 ). For example, a study that uses propensity score-based methods to balance risk factors between treatment groups is explicitly attempting to isolate a causal pathway by removing confounding factors. This is different from a study that intends only to measure an association. In fact, some journals may require that the word “association” be used when causal language would be more appropriate; however, this is beginning to change (Flanagin et al. 2024 ).
3.3 Defining the estimand (steps 2, 3, 4)
The estimand is the causal effect of research interest and is described in terms of required design elements: the target population for the counterfactual contrast, the kind of effect, and the effect/outcome measure.
In Step 2, the study team determines the target population of interest, which depends on the research question of interest. For example, we may want to estimate the effect of the treatment in the entire study population, i.e., the hypothetical contrast between all study patients taking the drug of interest versus all study patients taking the comparator (the average treatment effect; ATE). Other effects can be examined, including the average treatment effect in the treated or untreated (ATT or ATU).When covariate distributions are the same across the treated and untreated populations and there is no effect modification by covariates, these effects are generally the same (Wang et al. 2017 ). In RCTs, this occurs naturally due to randomization, but in non-randomized data, careful study design and statistical methods must be used to mitigate confounding bias.
In Step 3, the study team decides whether to measure the intention-to-treat (ITT), per-protocol, or as-treated effect. The ITT approach is also known as “first-treatment-carried-forward” in the observational literature (Lund et al. 2015 ). In trials, the ITT measures the effect of treatment assignment rather than the treatment itself, and in observational data the ITT can be conceptualized as measuring the effect of treatment as started . To compute the ITT effect from observational data, patients are placed into the exposure group corresponding to the treatment that they initiate, and treatment switching or discontinuation are purposely ignored in the analysis. Alternatively, a per-protocol effect can be measured from observational data by classifying patients according to the treatment that they initiated but censoring them when they stop, switch, or otherwise change treatment (Danaei et al. 2013 ; Yang et al. 2014 ). Finally, “as-treated” effects are estimated from observational data by classifying patients according to their actual treatment exposure during follow-up, for example by using multiple time windows to measure exposure changes (Danaei et al. 2013 ; Yang et al. 2014 ).
Step 4 is the final step in specifying the estimand in which the research team determines the effect measure of interest. Answering this question has two parts. First, the team must consider how the outcome of interest will be measured. Risks, rates, hazards, odds, and costs are common ways of measuring outcomes, but each measure may be best suited to a particular scenario. For example, risks assume patients across comparison groups have equal follow-up time, while rates allow for variable follow-up time (Rothman et al. 2008 ). Costs may be of interest in studies focused on economic outcomes, including as inputs to cost-effectiveness analyses. After deciding how the outcome will be measured, it is necessary to consider whether the resulting quantity will be compared across groups using a ratio or a difference. Ratios convey the effect of exposure in a way that is easy to understand, but they do not provide an estimate of how many patients will be affected. On the other hand, differences provide a clearer estimate of the potential public health impact of exposure; for example, by allowing the calculation of the number of patients that must be treated to cause or prevent one instance of the outcome of interest (Tripepi et al. 2007 ).
3.4 Identifying and mitigating biases (steps 5, 6, 7)
Observational, real-world studies can be subject to multiple potential sources of bias, which can be grouped into confounding, selection, measurement, and time-related biases (Prada-Ramallal et al. 2019 ).
In Step 5, as a practical first approach in developing strategies to address threats to causal inference, researchers should create a visual mapping of factors that may be related to the exposure, outcome, or both (also called a directed acyclic graph or DAG) (Pearl 1995 ). While creating a high-quality DAG can be challenging, guidance is increasingly available to facilitate the process (Ferguson et al. 2020 ; Gatto et al. 2022 ; Hernán and Robins 2020 ; Rodrigues et al. 2022 ; Sauer 2013 ). The types of inter-variable relationships depicted by DAGs include confounders, colliders, and mediators. Confounders are variables that affect both exposure and outcome, and it is necessary to control for them in order to isolate the causal pathway of interest. Colliders represent variables affected by two other variables, such as exposure and outcome (Griffith et al. 2020 ). Colliders should not be conditioned on since by doing so, the association between exposure and outcome will become distorted. Mediators are variables that are affected by the exposure and go on to affect the outcome. As such, mediators are on the causal pathway between exposure and outcome and should also not be conditioned on, otherwise a path between exposure and outcome will be closed and the total effect of the exposure on the outcome cannot be estimated. Mediation analysis is a separate type of analysis aiming to distinguish between direct and indirect (mediated) effects between exposure and outcome and may be applied in certain cases (Richiardi et al. 2013 ). Overall, the process of creating a DAG can create valuable insights about the nature of the hypothesized underlying data generating process and the biases that are likely to be encountered (Digitale et al. 2022 ). Finally, an extension to DAGs which incorporates counterfactual theory is available in the form of Single World Intervention Graphs (SWIGs) as described in a 2013 primer (Richardson and Robins 2013 ).
In Step 6, researchers comprehensively assess the possibility of different types of bias in their study, above and beyond what the creation of the DAG reveals. Many potential biases have been identified and summarized in the literature (Berger et al. 2017 ; Cox et al. 2009 ; European Medicines Agency 2023 ; Girman et al. 2014 ; Stuart et al. 2013 ; Velentgas et al. 2013 ). Every study can be subject to one or more biases, each of which can be addressed using one or more methods. The study team should thoroughly and explicitly identify all possible biases with consideration for the specifics of the available data and the nuances of the population and health care system(s) from which the data arise. Once the potential biases are identified and listed, the team can consider potential solutions using a variety of study design and analytic techniques.
In Step 7, the study team considers solutions to the biases identified in Step 6. “Target trial” thinking serves as the basis for many of these solutions by requiring researchers to consider how observational studies can be designed to ensure comparison groups are similar and produce valid inferences by emulating RCTs (Labrecque and Swanson 2017 ; Wang et al. 2023b ). Designing studies to include only new users of a drug and an active comparator group is one way of increasing the similarity of patients across both groups, particularly in terms of treatment history. Careful consideration must be paid to the specification of the time periods and their relationship to inclusion/exclusion criteria (Suissa and Dell’Aniello 2020 ). For instance, if a drug is used intermittently, a longer wash-out period is needed to ensure adequate capture of prior use in order to avoid bias (Riis et al. 2015 ). The study team should consider how to approach confounding adjustment, and whether both time-invariant and time-varying confounding may be present. Many potential biases exist, and many methods have been developed to address them in order to improve causal estimation from observational data. Many of these methods, such as propensity score estimation, can be enhanced by machine learning (Athey and Imbens 2019 ; Belthangady et al. 2021 ; Mai et al. 2022 ; Onasanya et al. 2024 ; Schuler and Rose 2017 ; Westreich et al. 2010 ). Machine learning has many potential applications in the causal inference discipline, and like other tools, must be used with careful planning and intentionality. To aid in the assessment of potential biases, especially time-related ones, and the development of a plan to address them, the study design should be visualized (Gatto et al. 2022 ; Schneeweiss et al. 2019 ). Additionally, we note the opportunity for collaboration across research disciplines (e.g., the application of difference-in-difference methods (Zhou et al. 2016 ) to the estimation of comparative drug effectiveness and safety).
3.5 Quality Control & sensitivity analyses (step 8)
Causal study design concludes with Step 8, which includes planning quality control and sensitivity analyses to improve the internal validity of the study. Quality control begins with reviewing study output for prima facie validity. Patient characteristics (e.g., distributions of age, sex, region) should align with expected values from the researchers’ intuition and the literature, and researchers should assess reasons for any discrepancies. Sensitivity analyses should be conducted to determine the robustness of study findings. Researchers can test the stability of study estimates using a different estimand or type of model than was used in the primary analysis. Sensitivity analysis estimates that are similar to those of the primary analysis might confirm that the primary analysis estimates are appropriate. The research team may be interested in how changes to study inclusion/exclusion criteria may affect study findings or wish to address uncertainties related to measuring the exposure or outcome in the administrative data by modifying the algorithms used to identify exposure or outcome (e.g., requiring hospitalization with a diagnosis code in a principal position rather than counting any claim with the diagnosis code in any position). As feasible, existing validation studies for the exposure and outcome should be referenced, or new validation efforts undertaken. The results of such validation studies can inform study estimates via quantitative bias analyses (Lanes and Beachler 2023 ). The study team may also consider biases arising from unmeasured confounding and plan quantitative bias analyses to explore how unmeasured confounding may impact estimates. Quantitative bias analysis can assess the directionality, magnitude, and uncertainty of errors arising from a variety of limitations (Brenner and Gefeller 1993 ; Lash et al. 2009 , 2014 ; Leahy et al. 2022 ).
3.6 Illustration using a previously published research study
In order to demonstrate how the guide can be used to plan a research study utilizing causal methods, we turn to a previously published study (Dondo et al. 2017 ) that assessed the causal relationship between the use of 𝛽-blockers and mortality after acute myocardial infarction in patients without heart failure or left ventricular systolic dysfunction. The investigators sought to answer a causal research question (Step 1), and so we proceed to Step 2. Use (or no use) of 𝛽-blockers was determined after discharge without taking into consideration discontinuation or future treatment changes (i.e., intention-to-treat). Considering treatment for whom (Step 3), both ATE and ATT were evaluated. Since survival was the primary outcome, an absolute difference in survival time was chosen as the effect measure (Step 4). While there was no explicit directed acyclic graph provided, the investigators specified a list of confounders.
Robust methodologies were established by consideration of possible sources of biases and addressing them using viable solutions (Steps 6 and 7). Table 1 offers a list of the identified potential biases and their corresponding solutions as implemented. For example, to minimize potential biases including prevalent-user bias and selection bias, the sample was restricted to patients with no previous use of 𝛽-blockers, no contraindication for 𝛽-blockers, and no prescription of loop diuretics. To improve balance across the comparator groups in terms of baseline confounders, i.e., those that could influence both exposure (𝛽-blocker use) and outcome (mortality), propensity score-based inverse probability of treatment weighting (IPTW) was employed. However, we noted that the baseline look-back period to assess measured covariates was not explicitly listed in the paper.
Quality control and sensitivity analysis (Step 8) is described extensively. The overlap of propensity score distributions between comparator groups was tested and confounder balance was assessed. Since observations in the tail-end of the propensity score distribution may violate the positivity assumption (Crump et al. 2009 ), a sensitivity analysis was conducted including only cases within 0.1 to 0.9 of the propensity score distribution. While not mentioned by the authors, the PS tails can be influenced by unmeasured confounders (Sturmer et al. 2021 ), and the findings were robust with and without trimming. An assessment of extreme IPTW weights, while not included, would further help increase confidence in the robustness of the analysis. An instrumental variable approach was employed to assess potential selection bias due to unmeasured confounding, using hospital rates of guideline-indicated prescribing as the instrument. Additionally, potential bias caused by missing data was attenuated through the use of multiple imputation, and separate models were built for complete cases only and imputed/complete cases.
4 Discussion
We have described a conceptual schema for designing observational real-world studies to estimate causal effects. The application of this schema to a previously published study illuminates the methodologic structure of the study, revealing how each structural element is related to a potential bias which it is meant to address. Real-world evidence is increasingly accepted by healthcare stakeholders, including the FDA (Concato and Corrigan-Curay 2022 ; Concato and ElZarrad 2022 ), and its use for comparative effectiveness and safety assessments requires appropriate causal study design; our guide is meant to facilitate this design process and complement existing, more specific, guidance.
Existing guidance for causal inference using observational data includes components that can be clearly mapped onto the schema that we have developed. For example, in 2009 Cox et al. described common sources of bias in observational data and recommended specific strategies to mitigate these biases, corresponding to steps 6–8 of our step-by-step guide (Cox et al. 2009 ). In 2013, the AHRQ emphasized development of the research question, corresponding to steps 1–4 of our guide, with additional chapters on study design, comparator selection, sensitivity analyses, and directed acyclic graphs which correspond to steps 7 and 5, respectively (Velentgas et al. 2013 ). Much of Girman et al.’s manuscript (Girman et al. 2014 ) corresponds with steps 1–4 of our guide, and the matter of equipoise and interpretability specifically correspond to steps 3 and 7–8. The current ENCePP guide on methodological standards in pharmacoepidemiology contains a section on formulating a meaningful research question, corresponding to step 1, and describes strategies to mitigate specific sources of bias, corresponding to steps 6–8 (European Medicines Agency 2023 ). Recent works by the FDA Sentinel Innovation Center (Desai et al. 2024 ) and the Joint Initiative for Causal Inference (Dang et al. 2023 ) provide more advanced exposition of many of the steps in our guide. The target trial framework contains guidance on developing seven components of the study protocol, including eligibility criteria, treatment strategies, assignment procedures, follow-up period, outcome, causal contrast of interest, and analysis plan (Hernán and Robins 2016 ). Our work places the target trial framework into a larger context illustrating its relationship with other important study planning considerations, including the creation of a directed acyclic graph and incorporation of prespecified sensitivity and quantitative bias analyses.
Ultimately, the feasibility of estimating causal effects relies on the capabilities of the available data. Real-world data sources are complex, and the investigator must carefully consider whether the data on hand are sufficient to answer the research question. For example, a study that relies solely on claims data for outcome ascertainment may suffer from outcome misclassification bias (Lanes and Beachler 2023 ). This bias can be addressed through medical record validation for a random subset of patients, followed by quantitative bias analysis (Lanes and Beachler 2023 ). If instead, the investigator wishes to apply a previously published, claims-based algorithm validated in a different database, they must carefully consider the transportability of that algorithm to their own study population. In this way, causal inference from real-world data requires the ability to think creatively and resourcefully about how various data sources and elements can be leveraged, with consideration for the strengths and limitations of each source. The heart of causal inference is in the pairing of humility and creativity: the humility to acknowledge what the data cannot do, and the creativity to address those limitations as best as one can at the time.
4.1 Limitations
As with any attempt to synthesize a broad array of information into a single, simplified schema, there are several limitations to our work. Space and useability constraints necessitated simplification of the complex source material and selections among many available methodologies, and information about the relative importance of each step is not currently included. Additionally, it is important to consider the context of our work. This step-by-step guide emphasizes analytic techniques (e.g., propensity scores) that are used most frequently within our own research environment and may not include less familiar study designs and analytic techniques. However, one strength of the guide is that additional designs and techniques or concepts can easily be incorporated into the existing schema. The benefit of a schema is that new information can be added and is more readily accessed due to its association with previously sorted information (Loveless 2022 ). It is also important to note that causal inference was approached as a broad overarching concept defined by the totality of the research, from start to finish, rather than focusing on a particular analytic technique, however we view this as a strength rather than a limitation.
Finally, the focus of this guide was on the methodologic aspects of study planning. As a result, we did not include steps for drafting or registering the study protocol in a public database or for communicating results. We strongly encourage researchers to register their study protocols and communicate their findings with transparency. A protocol template endorsed by ISPOR and ISPE for studies using real-world data to evaluate treatment effects is available (Wang et al. 2023a ). Additionally, the steps described above are intended to illustrate an order of thinking in the study planning process, and these steps are often iterative. The guide is not intended to reflect the order of study execution; specifically, quality control procedures and sensitivity analyses should also be formulated up-front at the protocol stage.
5 Conclusion
We outlined steps and described key conceptual issues of importance in designing real-world studies to answer causal questions, and created a visually appealing, user-friendly resource to help researchers clearly define and navigate these issues. We hope this guide serves to enhance the quality, and thus the impact, of real-world evidence.
Data availability
No datasets were generated or analysed during the current study.
Arlett, P., Kjaer, J., Broich, K., Cooke, E.: Real-world evidence in EU Medicines Regulation: Enabling Use and establishing value. Clin. Pharmacol. Ther. 111 (1), 21–23 (2022)
Article PubMed Google Scholar
Athey, S., Imbens, G.W.: Machine Learning Methods That Economists Should Know About. Annual Review of Economics 11(Volume 11, 2019): 685–725. (2019)
Belthangady, C., Stedden, W., Norgeot, B.: Minimizing bias in massive multi-arm observational studies with BCAUS: Balancing covariates automatically using supervision. BMC Med. Res. Methodol. 21 (1), 190 (2021)
Article PubMed PubMed Central Google Scholar
Berger, M.L., Sox, H., Willke, R.J., Brixner, D.L., Eichler, H.G., Goettsch, W., Madigan, D., Makady, A., Schneeweiss, S., Tarricone, R., Wang, S.V., Watkins, J.: and C. Daniel Mullins. 2017. Good practices for real-world data studies of treatment and/or comparative effectiveness: Recommendations from the joint ISPOR-ISPE Special Task Force on real-world evidence in health care decision making. Pharmacoepidemiol Drug Saf. 26 (9): 1033–1039
Brenner, H., Gefeller, O.: Use of the positive predictive value to correct for disease misclassification in epidemiologic studies. Am. J. Epidemiol. 138 (11), 1007–1015 (1993)
Article CAS PubMed Google Scholar
Concato, J., Corrigan-Curay, J.: Real-world evidence - where are we now? N Engl. J. Med. 386 (18), 1680–1682 (2022)
Concato, J., ElZarrad, M.: FDA Issues Draft Guidances on Real-World Evidence, Prepares to Publish More in Future [accessed on 2022]. (2022). https://www.fda.gov/drugs/news-events-human-drugs/fda-issues-draft-guidances-real-world-evidence-prepares-publish-more-future
Cox, E., Martin, B.C., Van Staa, T., Garbe, E., Siebert, U., Johnson, M.L.: Good research practices for comparative effectiveness research: Approaches to mitigate bias and confounding in the design of nonrandomized studies of treatment effects using secondary data sources: The International Society for Pharmacoeconomics and Outcomes Research Good Research Practices for Retrospective Database Analysis Task Force Report–Part II. Value Health. 12 (8), 1053–1061 (2009)
Crump, R.K., Hotz, V.J., Imbens, G.W., Mitnik, O.A.: Dealing with limited overlap in estimation of average treatment effects. Biometrika. 96 (1), 187–199 (2009)
Article Google Scholar
Danaei, G., Rodriguez, L.A., Cantero, O.F., Logan, R., Hernan, M.A.: Observational data for comparative effectiveness research: An emulation of randomised trials of statins and primary prevention of coronary heart disease. Stat. Methods Med. Res. 22 (1), 70–96 (2013)
Dang, L.E., Gruber, S., Lee, H., Dahabreh, I.J., Stuart, E.A., Williamson, B.D., Wyss, R., Diaz, I., Ghosh, D., Kiciman, E., Alemayehu, D., Hoffman, K.L., Vossen, C.Y., Huml, R.A., Ravn, H., Kvist, K., Pratley, R., Shih, M.C., Pennello, G., Martin, D., Waddy, S.P., Barr, C.E., Akacha, M., Buse, J.B., van der Laan, M., Petersen, M.: A causal roadmap for generating high-quality real-world evidence. J. Clin. Transl Sci. 7 (1), e212 (2023)
Desai, R.J., Wang, S.V., Sreedhara, S.K., Zabotka, L., Khosrow-Khavar, F., Nelson, J.C., Shi, X., Toh, S., Wyss, R., Patorno, E., Dutcher, S., Li, J., Lee, H., Ball, R., Dal Pan, G., Segal, J.B., Suissa, S., Rothman, K.J., Greenland, S., Hernan, M.A., Heagerty, P.J., Schneeweiss, S.: Process guide for inferential studies using healthcare data from routine clinical practice to evaluate causal effects of drugs (PRINCIPLED): Considerations from the FDA Sentinel Innovation Center. BMJ. 384 , e076460 (2024)
Digitale, J.C., Martin, J.N., Glymour, M.M.: Tutorial on directed acyclic graphs. J. Clin. Epidemiol. 142 , 264–267 (2022)
Dondo, T.B., Hall, M., West, R.M., Jernberg, T., Lindahl, B., Bueno, H., Danchin, N., Deanfield, J.E., Hemingway, H., Fox, K.A.A., Timmis, A.D., Gale, C.P.: beta-blockers and Mortality after Acute myocardial infarction in patients without heart failure or ventricular dysfunction. J. Am. Coll. Cardiol. 69 (22), 2710–2720 (2017)
Article CAS PubMed PubMed Central Google Scholar
European Medicines Agency: ENCePP Guide on Methodological Standards in Pharmacoepidemiology [accessed on 2023]. (2023). https://www.encepp.eu/standards_and_guidances/methodologicalGuide.shtml
Ferguson, K.D., McCann, M., Katikireddi, S.V., Thomson, H., Green, M.J., Smith, D.J., Lewsey, J.D.: Evidence synthesis for constructing directed acyclic graphs (ESC-DAGs): A novel and systematic method for building directed acyclic graphs. Int. J. Epidemiol. 49 (1), 322–329 (2020)
Flanagin, A., Lewis, R.J., Muth, C.C., Curfman, G.: What does the proposed causal inference Framework for Observational studies Mean for JAMA and the JAMA Network Journals? JAMA (2024)
U.S. Food and Drug Administration: Framework for FDA’s Real-World Evidence Program [accessed on 2018]. (2018). https://www.fda.gov/media/120060/download
Franklin, J.M., Schneeweiss, S.: When and how can Real World Data analyses substitute for randomized controlled trials? Clin. Pharmacol. Ther. 102 (6), 924–933 (2017)
Gatto, N.M., Wang, S.V., Murk, W., Mattox, P., Brookhart, M.A., Bate, A., Schneeweiss, S., Rassen, J.A.: Visualizations throughout pharmacoepidemiology study planning, implementation, and reporting. Pharmacoepidemiol Drug Saf. 31 (11), 1140–1152 (2022)
Girman, C.J., Faries, D., Ryan, P., Rotelli, M., Belger, M., Binkowitz, B., O’Neill, R.: and C. E. R. S. W. G. Drug Information Association. 2014. Pre-study feasibility and identifying sensitivity analyses for protocol pre-specification in comparative effectiveness research. J. Comp. Eff. Res. 3 (3): 259–270
Griffith, G.J., Morris, T.T., Tudball, M.J., Herbert, A., Mancano, G., Pike, L., Sharp, G.C., Sterne, J., Palmer, T.M., Davey Smith, G., Tilling, K., Zuccolo, L., Davies, N.M., Hemani, G.: Collider bias undermines our understanding of COVID-19 disease risk and severity. Nat. Commun. 11 (1), 5749 (2020)
Hernán, M.A.: The C-Word: Scientific euphemisms do not improve causal inference from Observational Data. Am. J. Public Health. 108 (5), 616–619 (2018)
Hernán, M.A., Robins, J.M.: Using Big Data to emulate a target Trial when a Randomized Trial is not available. Am. J. Epidemiol. 183 (8), 758–764 (2016)
Hernán, M., Robins, J.: Causal Inference: What if. Chapman & Hall/CRC, Boca Raton (2020)
Google Scholar
International Society for Pharmacoeconomics and Outcomes Research (ISPOR): Strategic Initiatives: Real-World Evidence [accessed on 2022]. (2022). https://www.ispor.org/strategic-initiatives/real-world-evidence
International Society for Pharmacoepidemiology (ISPE): Position on Real-World Evidence [accessed on 2020]. (2020). https://pharmacoepi.org/pub/?id=136DECF1-C559-BA4F-92C4-CF6E3ED16BB6
Labrecque, J.A., Swanson, S.A.: Target trial emulation: Teaching epidemiology and beyond. Eur. J. Epidemiol. 32 (6), 473–475 (2017)
Lanes, S., Beachler, D.C.: Validation to correct for outcome misclassification bias. Pharmacoepidemiol Drug Saf. (2023)
Lash, T.L., Fox, M.P., Fink, A.K.: Applying Quantitative bias Analysis to Epidemiologic data. Springer (2009)
Lash, T.L., Fox, M.P., MacLehose, R.F., Maldonado, G., McCandless, L.C., Greenland, S.: Good practices for quantitative bias analysis. Int. J. Epidemiol. 43 (6), 1969–1985 (2014)
Leahy, T.P., Kent, S., Sammon, C., Groenwold, R.H., Grieve, R., Ramagopalan, S., Gomes, M.: Unmeasured confounding in nonrandomized studies: Quantitative bias analysis in health technology assessment. J. Comp. Eff. Res. 11 (12), 851–859 (2022)
Loveless, B.: A Complete Guide to Schema Theory and its Role in Education [accessed on 2022]. (2022). https://www.educationcorner.com/schema-theory/
Lund, J.L., Richardson, D.B., Sturmer, T.: The active comparator, new user study design in pharmacoepidemiology: Historical foundations and contemporary application. Curr. Epidemiol. Rep. 2 (4), 221–228 (2015)
Mai, X., Teng, C., Gao, Y., Governor, S., He, X., Kalloo, G., Hoffman, S., Mbiydzenyuy, D., Beachler, D.: A pragmatic comparison of logistic regression versus machine learning methods for propensity score estimation. Supplement: Abstracts of the 38th International Conference on Pharmacoepidemiology: Advancing Pharmacoepidemiology and Real-World Evidence for the Global Community, August 26–28, 2022, Copenhagen, Denmark. Pharmacoepidemiology and Drug Safety 31(S2). (2022)
Mullard, A.: 2021 FDA approvals. Nat. Rev. Drug Discov. 21 (2), 83–88 (2022)
Onasanya, O., Hoffman, S., Harris, K., Dixon, R., Grabner, M.: Current applications of machine learning for causal inference in healthcare research using observational data. International Society for Pharmacoeconomics and Outcomes Research (ISPOR) Atlanta, GA. (2024)
Pearl, J.: Causal diagrams for empirical research. Biometrika. 82 (4), 669–688 (1995)
Prada-Ramallal, G., Takkouche, B., Figueiras, A.: Bias in pharmacoepidemiologic studies using secondary health care databases: A scoping review. BMC Med. Res. Methodol. 19 (1), 53 (2019)
Richardson, T.S., Robins, J.M.: Single World Intervention Graphs: A Primer [accessed on 2013]. (2013). https://www.stats.ox.ac.uk/~evans/uai13/Richardson.pdf
Richiardi, L., Bellocco, R., Zugna, D.: Mediation analysis in epidemiology: Methods, interpretation and bias. Int. J. Epidemiol. 42 (5), 1511–1519 (2013)
Riis, A.H., Johansen, M.B., Jacobsen, J.B., Brookhart, M.A., Sturmer, T., Stovring, H.: Short look-back periods in pharmacoepidemiologic studies of new users of antibiotics and asthma medications introduce severe misclassification. Pharmacoepidemiol Drug Saf. 24 (5), 478–485 (2015)
Rodrigues, D., Kreif, N., Lawrence-Jones, A., Barahona, M., Mayer, E.: Reflection on modern methods: Constructing directed acyclic graphs (DAGs) with domain experts for health services research. Int. J. Epidemiol. 51 (4), 1339–1348 (2022)
Rothman, K.J., Greenland, S., Lash, T.L.: Modern Epidemiology. Wolters Kluwer Health/Lippincott Williams & Wilkins, Philadelphia (2008)
Rubin, D.B.: Causal inference using potential outcomes. J. Am. Stat. Assoc. 100 (469), 322–331 (2005)
Article CAS Google Scholar
Sauer, B.V.: TJ. Use of Directed Acyclic Graphs. In Developing a Protocol for Observational Comparative Effectiveness Research: A User’s Guide , edited by P. Velentgas, N. Dreyer, and P. Nourjah: Agency for Healthcare Research and Quality (US) (2013)
Schneeweiss, S., Rassen, J.A., Brown, J.S., Rothman, K.J., Happe, L., Arlett, P., Dal Pan, G., Goettsch, W., Murk, W., Wang, S.V.: Graphical depiction of longitudinal study designs in Health Care databases. Ann. Intern. Med. 170 (6), 398–406 (2019)
Schuler, M.S., Rose, S.: Targeted maximum likelihood estimation for causal inference in Observational studies. Am. J. Epidemiol. 185 (1), 65–73 (2017)
Stuart, E.A., DuGoff, E., Abrams, M., Salkever, D., Steinwachs, D.: Estimating causal effects in observational studies using Electronic Health data: Challenges and (some) solutions. EGEMS (Wash DC) 1 (3). (2013)
Sturmer, T., Webster-Clark, M., Lund, J.L., Wyss, R., Ellis, A.R., Lunt, M., Rothman, K.J., Glynn, R.J.: Propensity score weighting and trimming strategies for reducing Variance and Bias of Treatment Effect estimates: A Simulation Study. Am. J. Epidemiol. 190 (8), 1659–1670 (2021)
Suissa, S., Dell’Aniello, S.: Time-related biases in pharmacoepidemiology. Pharmacoepidemiol Drug Saf. 29 (9), 1101–1110 (2020)
Tripepi, G., Jager, K.J., Dekker, F.W., Wanner, C., Zoccali, C.: Measures of effect: Relative risks, odds ratios, risk difference, and ‘number needed to treat’. Kidney Int. 72 (7), 789–791 (2007)
Velentgas, P., Dreyer, N., Nourjah, P., Smith, S., Torchia, M.: Developing a Protocol for Observational Comparative Effectiveness Research: A User’s Guide. Agency for Healthcare Research and Quality (AHRQ) Publication 12(13). (2013)
Wang, A., Nianogo, R.A., Arah, O.A.: G-computation of average treatment effects on the treated and the untreated. BMC Med. Res. Methodol. 17 (1), 3 (2017)
Wang, S.V., Pottegard, A., Crown, W., Arlett, P., Ashcroft, D.M., Benchimol, E.I., Berger, M.L., Crane, G., Goettsch, W., Hua, W., Kabadi, S., Kern, D.M., Kurz, X., Langan, S., Nonaka, T., Orsini, L., Perez-Gutthann, S., Pinheiro, S., Pratt, N., Schneeweiss, S., Toussi, M., Williams, R.J.: HARmonized Protocol Template to enhance reproducibility of hypothesis evaluating real-world evidence studies on treatment effects: A good practices report of a joint ISPE/ISPOR task force. Pharmacoepidemiol Drug Saf. 32 (1), 44–55 (2023a)
Wang, S.V., Schneeweiss, S., Initiative, R.-D., Franklin, J.M., Desai, R.J., Feldman, W., Garry, E.M., Glynn, R.J., Lin, K.J., Paik, J., Patorno, E., Suissa, S., D’Andrea, E., Jawaid, D., Lee, H., Pawar, A., Sreedhara, S.K., Tesfaye, H., Bessette, L.G., Zabotka, L., Lee, S.B., Gautam, N., York, C., Zakoul, H., Concato, J., Martin, D., Paraoan, D.: and K. Quinto. Emulation of Randomized Clinical Trials With Nonrandomized Database Analyses: Results of 32 Clinical Trials. JAMA 329(16): 1376-85. (2023b)
Westreich, D., Lessler, J., Funk, M.J.: Propensity score estimation: Neural networks, support vector machines, decision trees (CART), and meta-classifiers as alternatives to logistic regression. J. Clin. Epidemiol. 63 (8), 826–833 (2010)
Yang, S., Eaton, C.B., Lu, J., Lapane, K.L.: Application of marginal structural models in pharmacoepidemiologic studies: A systematic review. Pharmacoepidemiol Drug Saf. 23 (6), 560–571 (2014)
Zhou, H., Taber, C., Arcona, S., Li, Y.: Difference-in-differences method in comparative Effectiveness Research: Utility with unbalanced groups. Appl. Health Econ. Health Policy. 14 (4), 419–429 (2016)
Download references
The authors received no financial support for this research.
Author information
Authors and affiliations.
Carelon Research, Wilmington, DE, USA
Sarah Ruth Hoffman, Nilesh Gangan, Joseph L. Smith, Arlene Tave, Yiling Yang, Christopher L. Crowe & Michael Grabner
Elevance Health, Indianapolis, IN, USA
Xiaoxue Chen
University of Maryland School of Pharmacy, Baltimore, MD, USA
Susan dosReis
You can also search for this author in PubMed Google Scholar
Contributions
SH, NG, JS, AT, CC, MG are employees of Carelon Research, a wholly owned subsidiary of Elevance Health, which conducts health outcomes research with both internal and external funding, including a variety of private and public entities. XC was an employee of Elevance Health at the time of study conduct. YY was an employee of Carelon Research at the time of study conduct. SH, MG, and JLS are shareholders of Elevance Health. SdR receives funding from GlaxoSmithKline for a project unrelated to the content of this manuscript and conducts research that is funded by state and federal agencies.
Corresponding author
Correspondence to Sarah Ruth Hoffman .
Ethics declarations
Competing interests.
The authors declare no competing interests.
Additional information
Publisher’s note.
Springer Nature remains neutral with regard to jurisdictional claims in published maps and institutional affiliations.
Electronic supplementary material
Below is the link to the electronic supplementary material.
Supplementary Material 1
Supplementary material 2, rights and permissions.
Open Access This article is licensed under a Creative Commons Attribution 4.0 International License, which permits use, sharing, adaptation, distribution and reproduction in any medium or format, as long as you give appropriate credit to the original author(s) and the source, provide a link to the Creative Commons licence, and indicate if changes were made. The images or other third party material in this article are included in the article’s Creative Commons licence, unless indicated otherwise in a credit line to the material. If material is not included in the article’s Creative Commons licence and your intended use is not permitted by statutory regulation or exceeds the permitted use, you will need to obtain permission directly from the copyright holder. To view a copy of this licence, visit http://creativecommons.org/licenses/by/4.0/ .
Reprints and permissions
About this article
Hoffman, S.R., Gangan, N., Chen, X. et al. A step-by-step guide to causal study design using real-world data. Health Serv Outcomes Res Method (2024). https://doi.org/10.1007/s10742-024-00333-6
Download citation
Received : 07 December 2023
Revised : 31 May 2024
Accepted : 10 June 2024
Published : 19 June 2024
DOI : https://doi.org/10.1007/s10742-024-00333-6
Share this article
Anyone you share the following link with will be able to read this content:
Sorry, a shareable link is not currently available for this article.
Provided by the Springer Nature SharedIt content-sharing initiative
- Causal inference
- Real-world data
- Confounding
- Non-randomized data
- Bias in pharmacoepidemiology
- Find a journal
- Publish with us
- Track your research
Thank you for visiting nature.com. You are using a browser version with limited support for CSS. To obtain the best experience, we recommend you use a more up to date browser (or turn off compatibility mode in Internet Explorer). In the meantime, to ensure continued support, we are displaying the site without styles and JavaScript.
- View all journals
- Explore content
- About the journal
- Publish with us
- Sign up for alerts
- Open access
- Published: 03 June 2024
Assessing rates and predictors of cannabis-associated psychotic symptoms across observational, experimental and medical research
- Tabea Schoeler ORCID: orcid.org/0000-0003-4846-2741 1 , 2 ,
- Jessie R. Baldwin 2 , 3 ,
- Ellen Martin 2 ,
- Wikus Barkhuizen 2 &
- Jean-Baptiste Pingault ORCID: orcid.org/0000-0003-2557-4716 2 , 3
Nature Mental Health ( 2024 ) Cite this article
2472 Accesses
84 Altmetric
Metrics details
- Outcomes research
- Risk factors
Cannabis, one of the most widely used psychoactive substances worldwide, can give rise to acute cannabis-associated psychotic symptoms (CAPS). While distinct study designs have been used to examine CAPS, an overarching synthesis of the existing findings has not yet been carried forward. To that end, we quantitatively pooled the evidence on rates and predictors of CAPS ( k = 162 studies, n = 210,283 cannabis-exposed individuals) as studied in (1) observational research, (2) experimental tetrahydrocannabinol (THC) studies, and (3) medicinal cannabis research. We found that rates of CAPS varied substantially across the study designs, given the high rates reported by observational and experimental research (19% and 21%, respectively) but not medicinal cannabis studies (2%). CAPS was predicted by THC administration (for example, single dose, Cohen’s d = 0.7), mental health liabilities (for example, bipolar disorder, d = 0.8), dopamine activity ( d = 0.4), younger age ( d = −0.2), and female gender ( d = −0.09). Neither candidate genes (for example, COMT , AKT1 ) nor other demographic variables (for example, education) predicted CAPS in meta-analytical models. The results reinforce the need to more closely monitor adverse cannabis-related outcomes in vulnerable individuals as these individuals may benefit most from harm-reduction efforts.
Do AKT1, COMT and FAAH influence reports of acute cannabis intoxication experiences in patients with first episode psychosis, controls and young adult cannabis users?

Rates and correlates of cannabis-associated psychotic symptoms in over 230,000 people who use cannabis

Measuring the diversity gap of cannabis clinical trial participants compared to people who report using cannabis
Cannabis, one of the most widely used psychoactive substances in the world, 1 is commonly used as a recreational substance and is increasingly taken for medicinal purposes. 2 , 3 As a recreational substance, cannabis use is particularly prevalent among young people 1 who seek its rewarding acute effects such as relaxation, euphoria, or sociability. 4 When used as a medicinal product, cannabis is typically prescribed to alleviate clinical symptoms in individuals with pre-existing health conditions (for example, epilepsy, multiple sclerosis, chronic pain, nausea. 5 )
Given the widespread use of cannabis, alongside the shifts toward legalization of cannabis for medicinal and recreational purposes, momentum is growing to scrutinize both the potential therapeutic and adverse effects of cannabis on health. From a public health perspective, of particular concern are the increasing rates of cannabis-associated emergency department presentations, 6 the rising levels of THC (tetrahydrocannabinol, the main psychoactive ingredient in cannabis) in street cannabis, 7 the adverse events associated with medicinal cannabis use, 8 and the long-term health hazards associated with cannabis use. 9 In this context, risk of psychosis as a major adverse health outcome related to cannabis use has been studied extensively, suggesting that early-onset and heavy cannabis use constitutes a contributory cause of psychosis. 10 , 11 , 12
More recent research has started to examine the more acute cannabis-associated psychotic symptoms (CAPS) to understand better how individual vulnerabilities and the pharmacological properties of cannabis elicit adverse reactions in individuals exposed to cannabis. Indeed, transient psychosis-like symptoms, including hallucinations or paranoia during cannabis intoxication, are well documented. 5 , 13 , 14 In more rare cases, recreational cannabis users experience severe forms of CAPS, 15 requiring emergency medical treatment as a result of acute CAPS. 16 In addition, acute psychosis following THC administration has been documented in medicinal cannabis trials and experimental studies, 17 , 18 , 19 suggesting that CAPS can also occur in more-controlled environments.
While numerous studies have provided evidence on CAPS in humans, no research has yet synthesized and compared the findings obtained from different study designs and populations. More specifically, three distinct study types have focused on CAPS: (1) observational studies assessing the subjective experiences of cannabis intoxication in recreational cannabis users, (2) experimental challenge studies administering THC in healthy volunteers, and (3) medicinal cannabis studies documenting adverse events when testing medicinal cannabis products in individuals with pre-existing health conditions. As such, the availability of these three distinct lines of evidence provides a unique research opportunity as their findings can be synthesized, be inspected for convergence, and ultimately, contribute to more evidence-based harm-reduction initiatives.
In this work, we therefore aim to perform a quantitative synthesis of all existing evidence examining CAPS to advance our understanding concerning the rates and predictors of CAPS: First, it is currently unknown how common CAPS are among individuals exposed to cannabis. While rates of CAPS are reported by numerous studies, estimates vary substantially (for example, from <1% (ref. 20 ) to 70% (ref. 21 )) and may differ depending on the assessed symptom profile (for example, cannabis-associated hallucinations versus cannabis-associated paranoia), the study design (for example, observational versus experimental research), and the population (for example, healthy volunteers versus medicinal cannabis users). Second, distinct study designs have scrutinized similar questions concerning the risks involved in CAPS. As such, comparisons of the results from one study design (for example, observational studies, assessing self-reported cannabis use in recreational users 22 , 23 ) with another study design (for example, experimental studies administering varying doses of THC 24 , 25 ) can be used to triangulate findings on a given risk factor of interest (for example, potency of cannabis). Finally, studies focusing on predictors of CAPS typically assess hypothesized risk factors in isolation. Pooling all existing evidence across different risk factors therefore provides a more complete picture of the relative magnitude of the individual risk factors involved in CAPS.
In summary, this work is set out to synthesize all of the available evidence on CAPS across three lines of research. In light of the increasingly liberal cannabis policies around the world, alongside the rising levels of THC in cannabis, such efforts are key to informing harm-reduction strategies and future research avenues for public health. Considering that individuals presenting with acute cannabis-induced psychosis are at high risk of converting to a psychotic disorder (for example, rates ranging between 18% (ref. 26 ) and 45% (ref. 27 )), a deeper understanding of factors predicting CAPS would contribute to our understanding concerning risk of long-term psychosis in the context of cannabis use.
Of 20,428 published studies identified by the systematic search, 162 were included in this work. The reasons for exclusion are detailed in the PRISMA (Preferred Reporting Items for Systematic Reviews and Meta-Analyses) flow diagram (Fig. 1 ; see Supplementary Fig. 1 for a breakdown of the number of independent participants included in the different analytical models). The PRISMA reporting checklist is included in the Supplementary Results . At the full-text screening stage, the majority of studies were excluded because they did not report data on CAPS (83.88% of all excluded studies). Figure 2 displays the number of published studies included ( k ) and the number of (non-overlapping) study participants ( n ) per study design, highlighting that out of all participants included in this meta-analysis ( n = 201,283), most took part in observational research ( n = 174,300; 82.89%), followed by studies assessing medicinal cannabis products ( n = 33,502; 15.93%), experimental studies administering THC ( n = 2,009; 0.96%), and quasi-experimental studies ( n = 472; 0.22%). Screening of 10% of the studies at the full-text stage by an independent researcher (E.M.) did not identify missed studies.

Flow chart as adapted from the PRISMA flow chart ( http://www.prisma-statement.org/ ). Independent study participants are defined as the maximum number of participants available for an underlying study sample assessed in one or more of the included studies.

Number of included studies per year of publication and study design, including observational research assessing recreational cannabis users, experimental studies administering THC in healthy volunteers, and medicinal studies assessing adverse events in individuals taking cannabis products for medicinal use. Quasi-experimental research involved research testing the effects of THC administration in a naturalistic setting. 23 , 62 k , number of studies; n , number of (non-overlapping) study participants.
Rates of CAPS across the three study designs
A total of 99 studies published between 1971 and 2023 reported data on rates of CAPS and were included in the analysis, comprising 126,430 individuals from independent samples. Convergence of the data extracted by the two researchers (T.S. and W.B.) was high for the pooled rates on CAPS from observational studies (rate DIFF = −0.01%, where rate DIFF = rate TS – rate WB ), experimental studies (rate DIFF = 0%), and medicinal cannabis studies (rate DIFF = 0%). More specifically, we included data from 41 observational studies ( n = 92,888 cannabis users), 19 experimental studies administering THC ( n = 754), and 79 studies assessing efficacy and tolerability of medicinal cannabis products containing THC ( n = 32,821). In medicinal trials, the most common conditions treated with THC were pain ( k = 19 (23.75%)) and cancer ( k = 16 (20%)) (see Supplementary Table 1 for an overview). The age distribution of the included participants was similar in observational studies (mean age = 24.47 years, ranging from 16.6 to 34.34 years) and experimental studies (mean age = 25.1 years, ranging from 22.47 to 27.3 years). Individuals taking part in medicinal trials were substantially older (mean age = 48.16 years, ranging from 8 to 74.5 years).
As summarized in Fig. 3 and Supplementary Table 3 , substantial rates of CAPS were reported by observational studies (19.4%, 95% confidence interval (CI): 14.2%, 24.6%) and THC-challenge studies (21%, 95% CI: 11.3%, 30.7%), but not medicinal cannabis studies (1.5%, 95% CI: 1.1%, 1.9%). The pooled rates estimated for different symptom profiles of CAPS (CAPS – paranoia, CAPS – hallucinations, CAPS – delusions) are displayed in Supplementary Fig. 2 . All individual study estimates are listed in Supplementary Table 2 .

Pooled rates of CAPS across the three different study designs. Estimates on the y axis are the rates (in %, 95% confidence interval) obtained from models pooling together estimates on rates of CAPS (including psychosis-like symptoms, paranoia, hallucinations, and delusions) per study design.
Most models showed significant levels of heterogeneity (Supplementary Table 3 ), highlighting that rates of CAPS differed as a function of study-specific features. Risk of publication bias was indicated ( P Peters < 0.05) for one of the meta-analytical models combining all rates of CAPS (see funnel plots, Supplementary Fig. 2 ). Applying the trim-and-fill method slightly reduced the pooled rate of CAPS obtained from medicinal cannabis studies (rate unadjusted = 1.53%; rate adjusted = 1.18%). Finally, Fig. 4 summarizes rates of CAPS of a subset of studies where CAPS was defined as the occurrence of a full-blown cannabis-associated psychotic episode (as described in Table 1 ). When combined, the rate of CAPS (full episode) was 0.52% (0.42–0.62%) across the three study designs, highlighting that around one in 200 individuals experienced a severe episode of psychosis when exposed to cannabis/THC. Rates of CAPS (full episode) as reported by the individual studies showed high levels of consistency ( I 2 = 8%, P(I 2 ) = 0.45; Fig. 4 ).

Studies reporting rates of cannabis-associated psychosis (full episode). Depicted in violet are the individual study estimates (in %, 95% confidence interval) of studies reporting rates of (full-blown) cannabis-associated psychotic episodes. Included are studies using medicinal cannabis, observational, or experimental samples. The pooled meta-analyzed estimate is colored in blue. The I 2 statistic (scale of 0 to 100) indexes the level of heterogeneity across the estimates included in the meta-analysis.
Predictors of cannabis-associated psychotic symptoms
Assessing predictors of CAPS, we included 103 studies published between 1976 and 2023, corresponding to 80 independent samples ( n = 170,158 non-overlapping individuals). In total, we extracted 381 Cohen’s d that were pooled in 44 separate meta-analytical models. A summary of all extracted study estimates is provided in Supplementary Table 4 . Comparing the P values of the individual Cohen’s d to the original P values as reported in the studies revealed a high level of concordance ( r = 0.96 P = 1.1 × 10 –79 ), indicating that the conversion of the raw study estimates to a common metric did not result in a substantial loss of information. Comparing the results obtained from the data extracted by two researchers (T.S. and W.B.) identified virtually no inconsistencies when inspecting estimates of Cohen’s d , as obtained for severity of cannabis use on CAPS ( d DIFF = 0, where d DIFF = d TS –d WB ), gender ( d DIFF = 0), administration of (placebo controlled) medicinal cannabis ( d DIFF = 0.003), psychosis liability ( d DIFF = 0), and administration of a single dose of THC ( d DIFF = 0).
Figure 5 summarizes the results obtained from the meta-analytical models. We examined whether CAPS was predicted by the pharmacodynamic properties of cannabis, a person’s cannabis use history, demographic factors, mental health/personality traits, neurotransmitters, genetics, and use of other drugs: With respect to the pharmacodynamic properties of cannabis, the largest effect on CAPS severity was present for a single dose of THC ( d = 0.7, 95% CI: 0.52, 0.87) as administered in experimental studies, followed by a significant dose–response effect of THC on CAPS ( d = 0.42, 95% CI: 0.25, 0.59, that is, tested as moderation effects of THC dose in experimental studies). When tested in medicinal randomized controlled trials, cannabis products significantly increased symptoms of CAPS ( d = 0.14, 95% CI: 0.05, 0.23), albeit by a smaller magnitude. Protective effects were present for low THC/COOH levels ( d = −0.22, 95% CI: −0.39, −0.05, that is, the inactive metabolite of cannabis), but not for the THC/CBD (cannabidiol) ratio ( d = −0.19, 95% CI: −0.43, 0.05, P = 0.13).

Summary of pooled Cohen’s d , the corresponding 95% confidence intervals, and P values (two-sided, uncorrected for multiple testing). Positive estimates of Cohen’s d indicate increases in CAPS in response to the assessed predictor. Details regarding the classification and interpretation of each predictor are provided in the Supplementary Information . The reference list of all studies included in this figure is provided in Supplementary Table 4 . NS, neurotransmission.
Less clear were the findings with respect to the cannabis use history of the participants and its effect on CAPS. Here, neither young age of onset of cannabis use nor high-frequency use of cannabis or the preferred type of cannabis (strains high in THC, strains high in CBD) was associated with CAPS. The only demographic factors that significantly predicted CAPS were age ( d = −0.17, 95% CI: −0.292, −0.050) and gender (−0.09, 95% CI: −0.180, −0.001), indicating that younger and female cannabis users report higher levels of CAPS compared with older and male users. With respect to mental health and personality, the strongest predictors for CAPS were diagnosis of bipolar disorder ( d = 0.8, 95% CI: 0.54, 1.06)) and psychosis liability ( d = 0.49, 95% CI: 0.21, 0.77), followed by mood problems (anxiety d = 0.44, 95% CI: 0.03, 0.84; depression d = 0.37, 95% CI: 0.003, 0.740) and addiction liability ( d = 0.26, 95% CI: 0.14, 0.38). Summarizing the evidence from studies looking at neurotransmitter functioning showed that increased dopamine activity significantly predicted CAPS ( d = 0.4, 95% CI: 0.16, 0.64) (for example, reduced CAPS following administration of D2 blockers such as olanzapine 28 or haloperidol 29 ). By contrast, alterations in the opioid system did not reduce risk of CAPS. Similarly, none of the assessed candidate genes showed evidence of altering response to cannabis. Finally, out of 11 psychoactive substances with available data, only use histories of MDMA (3,4-methyl enedioxy methamphetamine) ( d = 0.2, 95% CI: 0.03, 0.36), crack ( d = 0.13, 95% CI: 0.03, 0.23), inhalants ( d = 0.12, 95% CI: 0.03, 0.22), and sedatives ( d = 0.12, 95% CI: 0.02, 0.22) linked to increases in CAPS.
Most of the meta-analytical models showed considerable levels of heterogeneity ( I 2 > 80%; Supplementary Table 5 ), notably when summarizing findings from observational studies (for example, severity of cannabis use: I 2 = 98%, age of onset of cannabis use: I 2 = 98%), highlighting that the individual effect estimates varied substantially across studies. By contrast, lower levels of heterogeneity were present when pooling evidence from experimental and medicinal cannabis studies (for example, effects of medicinal cannabis: I 2 = 18%; THC dose–response effects: I 2 = 37%). While risk of publication bias was indicated for four of the meta-analytical models (Egger’s test P < 0.05) (Supplementary Fig. 3 ), an inspection of trim-and-fill adjusted estimates did not alter the conclusions for (1) administration of a single dose of THC ( P Egger < 0.0001, d unadjusted = 0.7, d trim-and-fill = 0.49), (2) CBD administration ( P Egger = 0.0001, d unadjusted = −0.19, d trim-and-fill = −0.14, both P < 0.05), psychosis liability ( P Egger = 0.025, d unadjusted = 0.49, d trim-and-fill = 0.49), and (3) diagnosis of depression ( P Egger = 0.019, d unadjusted = 0.37, d trim-and-fill = 0.54). Outliers were identified for seven meta-analytical models (Supplementary Fig. 4 ). Removing outliers from the models did not substantially alter the conclusions drawn from the models, as indicated for age ( d = −0.18, d corr = −0.14, both P < 0.05); anxiety ( d = 0.61, d corr = 0.47, both P < 0.05), severity of cannabis use ( d = 0.19, d corr = 0.25, both P > 0.05), depression ( d = 0.41, d corr = 0.25, both P > 0.05), gender ( d = −0.09, d corr = −0.12, both P < 0.05), psychosis liability ( d = 0.49, d corr = 0.43, both P < 0.05), and administration of a single dose of THC ( d = 0.6, d corr = 0.56, both P < 0.05). Sensitivity checks assessing whether Cohen’s d changes as a function of within-subject correlation coefficient highlighted that the results were highly concordant (Supplementary Fig. 6 ). Minor deviations from the main analysis were present for the effects of a single dose of THC ( d r =0.3 = 0.64 versus d r =0.5 = 0.69 versus d r =0.7 = 0.77) and dose–response effects of THC ( d r =0.3 = 0.45 versus d r =0.5 = 0.42 versus d r =0.7 = 0.39), but this did not alter the interpretation of the findings.
Finally, we assessed consistency of findings for predictors examined in more than one of the different study designs (observational, experimental, and medicinal cannabis studies), as illustrated for four meta-analytical models in Fig. 6 (see Supplementary Fig. 7 for the complete set of results). Triangulating the results highlighted that consistency with respect to the direction of effects was particularly high for age ( d Experiments = −0.14 versus d Observational = −0.19 versus d Quasi-Experimental = −0.16) and gender ( d Experiments = −0.09 versus d Observational = −0.07 versus d Quasi-Experimental = −0.25) on CAPS. By contrast, little consistency across the different study designs was present with respect to cannabis use histories, notable age of onset of cannabis use ( d Observational = −0.3 versus d Quasi-Experimental = 0.24), and use of high-THC cannabis ( d Observational = 0.12 versus d Quasi-Experimental = −0.13).

Pooled estimates of Cohen’s d when estimated separately for each of the different study designs. The I 2 statistic (scale of 0 to 100) indexes the level of heterogeneity across the estimates included in the meta-analysis.
In this work, we examined rates and predictors of acute CAPS by synthesizing evidence from three distinct study designs: observational research, experimental studies administering THC, and studies testing medicinal cannabis products. Our results led to a number of key findings regarding the risk of CAPS in individuals exposed to cannabis. First, significant rates of CAPS were reported by all three study designs. This indicates that risk of acute psychosis-like symptoms exists after exposure to cannabis, irrespective of whether it is used recreationally, administered in controlled experiments, or prescribed as a medicinal product. Second, rates of CAPS vary across the different study designs, with substantially higher rates of CAPS in observational and experimental samples than in medicinal cannabis samples. Third, not every individual exposed to cannabis is equally at risk of CAPS as the interplay between individual differences and the pharmacological properties of the cannabis likely play an important role in modulating risk. In particular, risk appears most amplified in vulnerable individuals (for example, young age, pre-existing mental health problems) and increases with higher doses of THC (as shown in experimental studies).
Rates of cannabis-associated psychotic symptoms
Summarizing the existing evidence on rates of CAPS, we find that cannabis can acutely induce CAPS in a subset of cannabis-exposed individuals, irrespective of whether it is used recreationally, administered in controlled experiments, or prescribed as a medicinal product. Importantly, rates of CAPS varied substantially across the designs. More specifically, similar rates of CAPS were reported by observational and experimental evidence (around 19% and 21% in cannabis-exposed individuals, respectively), while considerably lower rates of CAPS were documented in medicinal cannabis samples (between 1% and 2%).
A number of factors likely contribute to the apparently different rates of CAPS across the three study designs. First, rates of CAPS are not directly comparable as different, design-specific measures were used: in observational/experimental research, CAPS is typically defined as the occurrence of transient cannabis-induced psychosis-like symptoms, whereas medicinal trials screen for CAPS as the occurrence of first-rank psychotic symptoms, often resulting in treatment discontinuation. 20 , 30 , 31 As such, transient CAPS may indeed occur commonly in cannabis-exposed individuals (as evident in the higher rates in observational/experimental research), while risk of severe CAPS requiring medical attention is less frequently reported (resulting in lower reported rates in medicinal cannabis samples). This converges with our meta-analytic results, showing that severe CAPS (full psychotic episode) may occur in about 1 in 200 (0.5%) cannabis users. Another key difference between medicinal trials and experimental/observational research lies in the demographic profile of participants recruited into the studies. For example, individuals taking part in medicinal trials were substantially older (mean age: 48 years) compared with subjects taking part in observational or experimental studies (mean age: 24 and 25 years, respectively). As such, older age may have buffered some of the adverse effects reported by adolescent individuals. Finally, cannabis products used in medicinal trials contain noticeable levels of CBD (for example, Sativex, with a THC/CBD ratio of approximately 1:1), a ratio different from that typically found in street cannabis (for example, >15% THC and <1% CBD 32 ) and in the experimental studies included in our meta-analyses (pure THC). As such, the use of medicinal cannabis (as opposed to street cannabis) may constitute a somewhat safer option. However, the potentially protective effects of CBD in this context require further investigation as we did not find a consistent effect of CBD co-administration on THC-induced psychosis-like symptoms. While earlier experimental studies included in our work were suggestive of protective effects of CBD, 33 , 34 , 35 two recent studies did not replicate these findings. 36 , 37
Interestingly, lower but significant rates of CAPS were also observed in placebo groups assessed as part of THC-challenge studies (% THC = 25% versus % placebo = 11%) and medicinal cannabis trials (% THC = 3% versus % placebo = 1%), highlighting that psychotic symptoms occur not only in the context of cannabis exposure. This is in line with the notion that cannabis use can increase risk of psychosis but appears to be neither a sufficient nor necessary cause for the emergence of psychotic symptoms. 38
Predictors of CAPS
Summarizing evidence on predictors of CAPS, we found that individual vulnerabilities and the pharmacological properties of cannabis both appear to play an important role in modulating risk. Regarding the pharmacological properties of cannabis, evidence from experimental studies showed that the administration of THC increases risk of CAPS, both in a single-dose and dose-dependent manner. Given the nature of the experimental design, these effects are independent of potential confounders that bias estimates obtained from observational studies. More challenging to interpret are therefore findings on individual cannabis use histories (for example, frequency/severity of cannabis use, age of onset of use, preferred cannabis strain) as assessed in observational studies. Contrary to evidence linking high-frequency and early-onset cannabis use to long-term risk of psychosis, 39 none of these factors associated with CAPS in our study. This discrepancy may indicate that cumulative effects of THC exposure are expressed differently for long-term risk of psychosis and acute CAPS: while users accustomed to cannabis may show a more blunted acute response as a result of tolerance, they are nevertheless at a higher risk of developing the clinical manifestation of psychosis in the long run. 38
We also tested a number of meta-analytical models for predictors tapping into demographic and mental health dimensions. Interestingly, among the assessed demographic factors, only age and gender associated with CAPS, with younger and female individuals reporting increased levels of CAPS. Other factors often linked to mental health, such as education or socioeconomic status, were not related to CAPS. Concerning predictors indexing mental health, we found converging evidence showing that a predisposition to psychosis increased the risk of experiencing CAPS. In addition, individuals with other pre-existing mental health vulnerabilities (for example, bipolar disorder, depression, anxiety, addiction liability) also showed a higher risk of CAPS, indicating that risk may stem partly from a common vulnerability to mental health problems.
These findings align with findings from studies focusing on the biological correlates of CAPS, showing that increases in dopamine activity, a neurotransmitter implicated in the etiology of psychosis, 40 altered sensitivity to cannabis. By contrast, none of the a priori selected candidate genes (chosen mostly to index schizophrenia liability) modulated risk of CAPS. This meta-analytic finding is coherent with results from the largest available genome-wide association study on schizophrenia, 41 where none of the candidate genes reached genome-wide significance ( P < 5 × 10 −8 ) ( Supplementary Information ). Instead, as for any complex trait, genetic risk underlying CAPS is likely to be more polygenic in nature, possibly converging on pathways as yet to be identified. As such, genetic testing companies that screen for the aforementioned genetic variants to provide their customers with an individualized risk profile (such as the Cannabis Genetic Test offered by Lobo Genetics ( https://www.lobogene.com )) are unlikely to fully capture the genetic risk underlying CAPS. Similarly, genetic counseling programs targeting specifically AKT1 allele carriers in the context of cannabis use 42 may be only of limited use when trying to reduce cannabis-associated harms.
Implications for research on cannabis use and psychosis
This work has a number of implications for future research avenues. First, experimental studies administering THC constitute the most stringent available causal inference method when studying risk of CAPS. Future studies should therefore capitalize on experimental designs to advance our understanding of the acute pharmacological effects of cannabis, in terms of standard cannabis units, 43 dose–response risk profiles, 44 the interplay of different cannabinoids, 44 , 45 and building on recent work.
Despite the value of experimental studies in causal inference, observational studies are essential to identify predictors of CAPS that cannot be experimentally manipulated (for example, age, long-term/chronic exposure to cannabis) and to strengthen external validity. However, a particular challenge for inference from observational studies results from bias due to confounding and reverse causation. Triangulating and comparing findings across study designs can therefore help to identify potential sources of bias that are specific to the different study designs. 46 For example, we observed that, despite THC dosing being robustly associated with CAPS in experimental studies, we did not find an association between cannabis use patterns (for example, high-THC cannabis strain) in observational and quasi-observational studies. This apparent inconsistency may result from THC effects that are blunted by long-term, early-onset and heavy cannabis use. For other designs, reverse causation may bias the association between cannabis use patterns and CAPS: as individuals may reduce cannabis consumption as a result of adverse acute effects, 47 the interpretation of cross-sectional estimates concerning different cannabis exposure and risk of CAPS is particularly challenging. Future observational studies should therefore exploit more robust causal inference methods (for example, THC administration in naturalistic settings 48 or within-subject comparisons controlling for time-invariant confounds 49 ) to better approximate the experimental design. In particular, innovative designs that can provide a higher temporal resolution on cannabis exposures and related experiences (for example, experience sampling, 50 assessing daily reactivity to cannabis 51 ) are a valuable addition to the causal inference toolbox for cannabis research. Applying genetically informed causal inferences such as Mendelian randomization analyses 52 can further help to triangulate findings, which would be possible once genome-wide summary results for both different cannabis use patterns and CAPS become available.
With respect to medicinal trials, it is important to note that an assessment of CAPS has not been a primary research focus. Although psychotic events are recognized as a potential adverse reaction to medicinal cannabis, 53 data on CAPS are rarely reported by medicinal trials, considering that only about 20% of medicinal cannabis randomized controlled trials screen for psychosis as a potential adverse effects. 5 As such, trials should systematically monitor CAPS, in addition to longer-term follow-ups assessing the risk of psychosis as a result of medicinal cannabis use. In particular, the use of validated instruments designed to capture more-subtle changes in CAPS should be included in trials to more adequately assess adverse reactions associated with medicinal cannabis products.
Second, with respect to factors associated with risk of CAPS, we find that these are similar to factors associated with onset of psychosis, notably pre-existing mental health vulnerabilities, 54 dose–response effects of cannabis, 55 and young age. 12 The key question deserving further attention is therefore whether CAPS constitutes, per se, a risk maker for long-term psychosis. Preliminary evidence found that in individuals with recent-onset psychosis, 37% reported to have experienced their first psychotic symptoms during cannabis intoxication. 56 Future longitudinal evidence building on this is required to determine whether subclinical cannabis-associated psychotic symptoms can help to identify users at high risk of developing psychosis in the long run. Follow-up research should also examine longitudinal trajectories of adverse cannabis-induced experiences and the distress associated with these experiences, given research suggesting that high levels of distress/persistence may constitute a marker of clinical relevance of psychotic-like experiences. 57 While few studies have explored this question in the context of CAPS, there is, for example, evidence suggesting that the level of distress caused by acute adverse reactions to cannabis may depend on the specific symptom dimension. 58 Here the highest levels of distress resulted from cannabis-associated paranoia and anxiety, rather than cannabis-associated hallucinations or experiences tapping into physical sensations (for example, body humming, numbness). In addition, some evidence highlights the re-occurring nature of CAPS in cannabis-exposed individuals. 22 , 58 Further research focusing on individuals with persisting symptoms of CAPS may therefore help to advance our knowledge concerning individual vulnerabilities underlying the development of long-term psychosis in the context of cannabis use.
Importantly, our synthesizing analysis is not immune to the sources of bias that exist for the different study designs, and our findings should therefore be considered in light of the aforementioned limitations (for example, residual confounding or reverse causation in observational studies, limited external validity in experimental studies). Nevertheless, comparing findings across the different study designs allowed us to pin down areas of inconsistency, which existed mostly with regard to cannabis-related parameters (for example, age of onset, frequency of use) and CAPS. In addition, we observed large levels of heterogeneity among most meta-analysis models, highlighting that study-specific findings may vary as a result of different sample characteristics and study methodologies. Future studies aiming to further discern potential sources of variation such as study design features (for example, treatment length in medicinal trials, route of THC administration in experimental studies), statistical modeling (for example, the type of confounding factors considered in observational research), and sample demographics (for example, age of the participants, previous experience with cannabis) are therefore essential when studying CAPS.
Conclusions
Our results demonstrate that cannabis can induce acute psychotic symptoms in individuals using cannabis for recreational or medicinal purposes. Some individuals appear to be particularly sensitive to the adverse acute effects of cannabis, notably young individuals with pre-existing mental health problems and individuals exposed to high levels of THC. Future studies should therefore monitor more closely adverse cannabis-related outcomes in vulnerable individuals as these individuals may benefit most from harm-reduction efforts.
Systematic search
A systematic literature search was performed in three databases (MEDLINE, EMBASE, and PsycInfo) following the PRISMA guidelines. 59 The final search was conducted on 6 December 2023 using 26 search terms indexing cannabis/THC and 20 terms indexing psychosis-like outcomes or cannabis-intoxication experiences (see Supplementary Information for a complete list of search terms). Search terms were chosen on the basis of terminology used in studies assessing CAPS, including observational studies (self-reported cannabis-induced psychosis-like experiences), THC-challenge studies (testing change in psychosis-like symptoms following THC administration), and medicinal studies testing the efficacy and safety of medicinal cannabis products (adverse events related to medicinal cannabis). Before screening the identified studies for inclusion, we removed non-relevant article types (reviews, case reports, comments, guidelines, editorials, letters, newspaper articles, book chapters, dissertations, conference abstracts) and duplicates using the R package revtools 60 . A senior researcher experienced in meta-analyses on cannabis use (T.S.) then reviewed all titles and abstracts for their relevance before conducting full-text screening. To reduce the risk of wrongful inclusion at the full-text screening stage, 10% of the articles selected for full-text screening were cross-checked for eligibility by a second researcher (E.M.).
Data extraction
We included all study estimates that could be used to derive rates of CAPS (the proportion of cannabis-exposed individuals reporting CAPS) or effect sizes (Cohen’s d ) for factors predicting CAPS. CAPS was defined as the occurrence of hallucinations, paranoia, and/or delusions during cannabis intoxication. These symptom-level items have been identified as the most reliable self-report measures screening for psychosis when validated against clinical interview measures. 61 Table 1 provides examples of CAPS as measured across the three different study designs. In brief, from observational studies, we extracted data if CAPS was assessed in cannabis-exposed individuals on the basis of self-report measures screening for subjective experiences while under the influence of cannabis. From experimental studies administering THC, CAPS was measured as the degree of psychotic symptom change in response to THC, either estimated from a between-subject (placebo groups versus THC group) or within-subject (pre-THC versus post-THC assessment) comparison. We also included data from natural experiments (referred to as quasi-experimental studies hereafter), where psychosis-like experiences were monitored in recreational cannabis users before and after they consumed their own cannabis products. 23 , 62 Finally, with respect to trials testing the efficacy and/or safety of medicinal cannabis products containing THC, we extracted data on adverse events, including the occurrence of psychosis, hallucinations, delusions, and/or paranoia during treatment with medicinal cannabis products. Medicinal studies that tested the effects of cannabis products not containing THC (for example, CBD only, olorinab, lenabasum) were not included.
For 10% of the included studies, data on rates and predictors of CAPS were extracted by a second researcher (W.B.), and agreement between the two extracted datasets was assessed by comparing the pooled estimates on rates and predictors of CAPS. In addition, following recommendations for improved reproducibility and transparency in meta-analytical works, 63 we provide all extracted data, the corresponding analytical scripts, and transformation information in the study repository.
Statistical analysis
Rates of caps.
We extracted the raw estimates of rates of CAPS as reported by observational, experimental, and medicinal cannabis studies. Classification of CAPS differs across the three study designs. In observational studies, occurrence of CAPS is typically defined as the experience of psychotic-like symptoms while under the influence of cannabis. In experimental studies administering THC, CAPS is commonly defined as a clinically significant change in psychotic symptom severity (for example, ≥3 points increase in Positive and Negative Syndrome Scale positive scores following THC 33 ). Finally, in medicinal cannabis samples, a binary measure of CAPS indicates whether psychotic symptoms occurred as an adverse event throughout the treatment with medicinal cannabis products. We derived rates of CAPS ( R CAPS = X Count of CAPS / N Sample size ) and the corresponding confidence intervals using the function BinomCI and the Clopper–Pearson method as implemented in the R package DescTools. 64 To estimate the pooled proportions, we fitted random-effects models or multilevel random-effects models as implemented in the R package metafor. 65 Multilevel random-effects models were used whenever accounting for non-independent sampling errors was necessary (further described in the following). Risk of publication bias was assessed using Peters’ test 66 and funnel plots and, if indicated ( P Peters < 0.05), corrected using the trim-and-fill method ( Supplementary Methods ).
To derive the pooled effects of factors predicting CAPS, we converted study estimates to the standardized effect size Cohen’s d as a common metric. For studies reporting mean differences, two formulas were used for the conversion. First, for studies reporting mean differences from between-subject comparisons (independent samples), we used the following formula:
where M E and M C are the mean scores on a continuous scale (severity of CAPS), reported for individuals exposed ( M E ) and unexposed ( M C ) to a certain risk factor (for example, cannabis users with pre-existing mental health problems versus cannabis users without pre-existing mental health problems). The formula used to derive the pooled standard deviations, SD P , and the variance of Cohen’s d are listed in the Supplementary Methods . Second, an extension of the preceding formula was used to derive Cohen’s d from within-subject comparisons, comparing time-point one ( M T1 ) with time-point two ( M T2 ).The formula takes into account the dependency between the two groups: 67
where r indexes the correlation between the pairs of observations, such as the correlation between the pre- and post-THC condition in the same set of individuals for a particular outcome measure. The correlation coefficient was set to be r = 0.5 for all studies included in the meta-analysis, on the basis of previous research. 13 We also assessed whether varying within-person correlation coefficients altered the interpretation of the results by re-estimating the pooled Cohen’s d for predictors of CAPS for two additional coefficients ( r = 0.3 and r = 0.7). The results were then compared with the findings obtained from the main analysis ( r = 0.5).
From experimental studies reporting multiple time points of psychosis-like experiences following THC administration (for example, refs. 68 , 69 , 70 , 71 , 72 ), we selected the most immediate time point following THC administration. Of note, whenever studies reported test statistics instead of means (for example, t -test or F -test statistics), the preceding formula was amended to accommodate these statistics. In addition, to allow for the inclusion of studies reporting metrics other than mean comparisons (for example, regression coefficients, correlations coefficients), we converted the results to Cohen’s d using existing formulas. All formulas used in this study are provided in the Supplementary Information . Whenever studies reported non-significant results without providing sufficient data to estimate Cohen’s d ( for example, results reported only as P > 0.05 ) , we used a conservative estimate of P = 1 and the corresponding sample size as the input to derive Cohen’s d . Finally, if studies reported estimates in figures only, we used WebPlotDigitizer ( https://automeris.io/WebPlotDigitizer ) to extract the data. Since the conversion of estimates from one metric to another may result in loss of precision, we also extracted the original P -value estimates (whenever reported as numerical values) and assessed the level of concordance with the P values corresponding to the estimated Cohen’s d .
Next, a series of meta-analytical models were fitted, each pooling estimates of Cohen’s d that belonged to the same class of predictors (for example, estimates indexing the effect of dopaminergic function on CAPS; estimates indexing the effect of age on CAPS). A detailed description of the classification of the included predictors is provided in the Supplementary Methods . Cohen’s d estimates were pooled if at least two estimates were available for one predictor class, using one of the following models:
Aggregation models (pooling effect sizes coming from the same underlying sample)
Random-effects models (pooling effect sizes coming from independent samples)
Multilevel random-effects models (pooling effect sizes coming from both independent and non-independent samples)
Predictors that could not meaningfully be grouped were not included in meta-analytical models but are, for completeness, reported as individual study estimates in the Supplementary Information . Levels of heterogeneity for each meta-analytical model were explored using the I 2 statistic, 73 indexing the contribution of study heterogeneity to the total variance. Here, I 2 > 30% represents moderate heterogeneity and I 2 > 50% represents substantial heterogeneity. Risk of publication bias was assessed visually using funnel plots alongside the application of Egger’s test to test for funnel-plot asymmetry. This test was performed for meta-analytical models containing at least six effect estimates. 74 The trim-and-fill 75 method was used whenever risk of publication bias was indicated ( P Egger < 0.05). To assess whether outliers distorted the conclusions of the meta-analytical models, we applied leave-one-out and outlier analysis 76 as implemented in the R package dmetar, 77 where a pooled estimate was re-calculated after omitting studies that deviated from the pooled estimate. Further details on all applied sensitivity analyses are provided in the Supplementary Methods .
Reporting summary
Further information on research design is available in the Nature Portfolio Reporting Summary linked to this article.
Data availability
The data are publicly available via GitHub at github.com/TabeaSchoeler/TS2023_MetaCAPS .
Code availability
All analytical code used to analyze, summarize, and present the data is accessible via GitHub at github.com/TabeaSchoeler/TS2023_MetaCAPS .
World Drug Report 2022 (UNODC, 2022); https://www.unodc.org/unodc/en/data-and-analysis/wdr-2022_booklet-3.html
Turna, J. et al. Overlapping patterns of recreational and medical cannabis use in a large community sample of cannabis users. Compr. Psychiatry 102 , 152188 (2020).
Article PubMed Google Scholar
Rhee, T. G. & Rosenheck, R. A. Increasing use of cannabis for medical purposes among US residents, 2013–2020. Am. J. Prev. Med. 65 , 528–533 (2023).
Green, B., Kavanagh, D. & Young, R. Being stoned: a review of self-reported cannabis effects. Drug Alcohol Rev. 22 , 453–460 (2003).
Whiting, P. F. et al. Cannabinoids for medical use. JAMA. 313 , 2456 (2015).
Callaghan, R. C. et al. Associations between Canada’s cannabis legalization and emergency department presentations for transient cannabis-induced psychosis and schizophrenia conditions: Ontario and Alberta, 2015–2019. Can. J. Psychiatry 67 , 616–625 (2022).
Article PubMed PubMed Central Google Scholar
Manthey, J., Freeman, T. P., Kilian, C., López-Pelayo, H. & Rehm, J. Public health monitoring of cannabis use in Europe: prevalence of use, cannabis potency, and treatment rates. Lancet Reg. Health Eur. 10 , 100227 (2021).
Pratt, M. et al. Benefits and harms of medical cannabis: a scoping review of systematic reviews. Syst. Rev. 8 , 320 (2019).
McGee, R., Williams, S., Poulton, R. & Moffitt, T. A longitudinal study of cannabis use and mental health from adolescence to early adulthood. Addiction 95 , 491–503 (2000).
Large, M., Sharma, S., Compton, M. T., Slade, T. & Nielssen, O. Cannabis use and earlier onset of psychosis. Arch. Gen. Psychiatry 68 , 555 (2011).
Marconi, A., Di Forti, M., Lewis, C. M., Murray, R. M. & Vassos, E. Meta-analysis of the association between the level of cannabis use and risk of psychosis. Schizophr. Bull. 42 , 1262–1269 (2016).
Hasan, A. et al. Cannabis use and psychosis: a review of reviews. Eur. Arch. Psychiatry Clin. Neurosci. 270 , 403–412 (2020).
Hindley, G. et al. Psychiatric symptoms caused by cannabis constituents: a systematic review and meta-analysis. Lancet Psychiatry 7 , 344–353 (2020).
Sexton, M., Cuttler, C. & Mischley, L. K. A survey of cannabis acute effects and withdrawal symptoms: differential responses across user types and age. J. Altern. Complement. Med. 25 , 326–335 (2019).
Schoeler, T., Ferris, J. & Winstock, A. R. Rates and correlates of cannabis-associated psychotic symptoms in over 230,000 people who use cannabis. Transl. Psychiatry 12 , 369 (2022).
Winstock, A., Lynskey, M., Borschmann, R. & Waldron, J. Risk of emergency medical treatment following consumption of cannabis or synthetic cannabinoids in a large global sample. J. Psychopharmacol. 29 , 698–703 (2015).
Kaufmann, R. M. et al. Acute psychotropic effects of oral cannabis extract with a defined content of Δ9-tetrahydrocannabinol (THC) in healthy volunteers. Pharmacopsychiatry 43 , 24–32 (2010).
Cameron, C., Watson, D. & Robinson, J. Use of a synthetic cannabinoid in a correctional population for posttraumatic stress disorder-related insomnia and nightmares, chronic pain, harm reduction, and other indications. J. Clin. Psychopharmacol. 34 , 559–564 (2014).
Aviram, J. et al. Medical cannabis treatment for chronic pain: outcomes and prediction of response. Eur. J. Pain 25 , 359–374 (2021).
Serpell, M. G., Notcutt, W. & Collin, C. Sativex long-term use: an open-label trial in patients with spasticity due to multiple sclerosis. J. Neurol. 260 , 285–295 (2013).
Colizzi, M. et al. Delta-9-tetrahydrocannabinol increases striatal glutamate levels in healthy individuals: implications for psychosis. Mol. Psychiatry. 25 , 3231–3240 (2020).
Bianconi, F. et al. Differences in cannabis-related experiences between patients with a first episode of psychosis and controls. Psychol. Med. 46 , 995–1003 (2016).
Valerie Curran, H. et al. Which biological and self-report measures of cannabis use predict cannabis dependency and acute psychotic-like effects? Psychol. Med. 49 , 1574–1580 (2019).
Kleinloog, D., Roozen, F., De Winter, W., Freijer, J. & Van Gerven, J. Profiling the subjective effects of Δ9-tetrahydrocannabinol using visual analogue scales. Int. J. Methods Psychiatr. Res. 23 , 245–256 (2014).
Ganesh, S. et al. Psychosis-relevant effects of intravenous delta-9-tetrahydrocannabinol: a mega analysis of individual participant-data from human laboratory studies. Int. J. Neuropsychopharmacol. 23 , 559–570 (2020).
Kendler, K. S., Ohlsson, H., Sundquist, J. & Sundquist, K. Prediction of onset of substance-induced psychotic disorder and its progression to schizophrenia in a Swedish national sample. Am. J. Psychiatry 176 , 711–719 (2019).
Arendt, M., Rosenberg, R., Foldager, L., Perto, G. & Munk-Jørgensen, P. Cannabis-induced psychosis and subsequent schizophrenia-spectrum disorders: follow-up study of 535 incident cases. Br. J. Psychiatry 187 , 510–515 (2005).
Kleinloog, D. et al. Does olanzapine inhibit the psychomimetic effects of Δ9-tetrahydrocannabinol? J. Psychopharmacol. 26 , 1307–1316 (2012).
Liem-Moolenaar, M. et al. Central nervous system effects of haloperidol on THC in healthy male volunteers. J. Psychopharmacol. 24 , 1697–1708 (2010).
Patti, F. et al. Efficacy and safety of cannabinoid oromucosal spray for multiple sclerosis spasticity. J. Neurol. Neurosurg. Psychiatry 87 , 944–951 (2016).
Thaler, A. et al. Single center experience with medical cannabis in Gilles de la Tourette syndrome. Parkinsonism Relat. Disord . 61 , 211–213 (2019).
Chandra, S. et al. New trends in cannabis potency in USA and Europe during the last decade (2008–2017). Eur. Arch. Psychiatry Clin. Neurosci. 269 , 5–15 (2019).
Englund, A. et al. Cannabidiol inhibits THC-elicited paranoid symptoms and hippocampal-dependent memory impairment. J. Psychopharmacol. 27 , 19–27 (2013).
Gibson, L. P. et al. Effects of cannabidiol in cannabis flower: implications for harm reduction. Addict. Biol. 27 , e13092 (2022).
Sainz-Cort, A. et al. The effects of cannabidiol and delta-9-tetrahydrocannabinol in social cognition: a naturalistic controlled study. Cannabis Cannabinoid Res . https://doi.org/10.1089/can.2022.0037 (2022).
Lawn, W. et al. The acute effects of cannabis with and without cannabidiol in adults and adolescents: a randomised, double‐blind, placebo‐controlled, crossover experiment. Addiction 118 , 1282–1294 (2023).
Englund, A. et al. Does cannabidiol make cannabis safer? A randomised, double-blind, cross-over trial of cannabis with four different CBD:THC ratios. Neuropsychopharmacology 48 , 869–876 (2023).
Arseneault, L., Cannon, M., Witton, J. & Murray, R. M. Causal association between cannabis and psychosis: examination of the evidence. Br. J. Psychiatry 184 , 110–117 (2004).
Di Forti, M. et al. The contribution of cannabis use to variation in the incidence of psychotic disorder across Europe (EU-GEI): a multicentre case-control study. Lancet Psychiatry 6 , 427–436 (2019).
McCutcheon, R. A., Abi-Dargham, A. & Howes, O. D. Schizophrenia, dopamine and the striatum: from biology to symptoms. Trends Neurosci. 42 , 205–220 (2019).
Trubetskoy, V. et al. Mapping genomic loci implicates genes and synaptic biology in schizophrenia. Nature 604 , 502–508 (2022).
Zwicker, A. et al. Genetic counselling for the prevention of mental health consequences of cannabis use: a randomized controlled trial‐within‐cohort. Early Interv. Psychiatry 15 , 1306–1314 (2021).
Hindocha, C., Norberg, M. M. & Tomko, R. L. Solving the problem of cannabis quantification. Lancet Psychiatry 5 , e8 (2018).
Englund, A. et al. The effect of five day dosing with THCV on THC-induced cognitive, psychological and physiological effects in healthy male human volunteers: a placebo-controlled, double-blind, crossover pilot trial. J. Psychopharmacol. 30 , 140–151 (2016).
Wall, M. B. et al. Individual and combined effects of cannabidiol and Δ9-tetrahydrocannabinol on striato-cortical connectivity in the human brain. J. Psychopharmacol. 36 , 732–744 (2022).
Hammerton, G. & Munafò, M. R. Causal inference with observational data: the need for triangulation of evidence. Psychol. Med. 51 , 563–578 (2021).
Sami, M., Notley, C., Kouimtsidis, C., Lynskey, M. & Bhattacharyya, S. Psychotic-like experiences with cannabis use predict cannabis cessation and desire to quit: a cannabis discontinuation hypothesis. Psychol. Med. 49 , 103–112 (2019).
Morgan, C. J. A., Schafer, G., Freeman, T. P. & Curran, H. V. Impact of cannabidiol on the acute memory and psychotomimetic effects of smoked cannabis: naturalistic study. Br. J. Psychiatry 197 , 285–290 (2010).
Schoeler, T. et al. Association between continued cannabis use and risk of relapse in first-episode psychosis: a quasi-experimental investigation within an observational study. JAMA Psychiatry 73 , 1173–1179 (2016).
Sznitman, S., Baruch, Y. Ben, Greene, T. & Gelkopf, M. The association between physical pain and cannabis use in daily life: an experience sampling method. Drug Alcohol Depend. 191 , 294–299 (2018).
Henquet, C. et al. Psychosis reactivity to cannabis use in daily life: an experience sampling study. Br. J. Psychiatry 196 , 447–453 (2010).
Pingault, J.-B. et al. Using genetic data to strengthen causal inference in observational research. Nat. Rev. Genet. 19 , 566–580 (2018).
Hill, K. P. Medical cannabis. JAMA 323 , 580 (2020).
Esterberg, M. L., Trotman, H. D., Holtzman, C., Compton, M. T. & Walker, E. F. The impact of a family history of psychosis on age-at-onset and positive and negative symptoms of schizophrenia: a meta-analysis. Schizophr. Res. 120 , 121–130 (2010).
Di Forti, M. et al. Proportion of patients in south London with first-episode psychosis attributable to use of high potency cannabis: a case-control study. Lancet Psychiatry 2 , 233–238 (2015).
Peters, B. D. et al. Subjective effects of cannabis before the first psychotic episode. Aust. N. Z. J. Psychiatry 43 , 1155–1162 (2009).
Karcher, N. R. et al. Persistent and distressing psychotic-like experiences using adolescent brain cognitive development study data. Mol. Psychiatry 27 , 1490–1501 (2022).
LaFrance, E. M., Stueber, A., Glodosky, N. C., Mauzay, D. & Cuttler, C. Overbaked: assessing and predicting acute adverse reactions to cannabis. J. Cannabis Res. 2 , 3 (2020).
Moher, D., Liberati, A., Tetzlaff, J. & Altman, D. G. Preferred reporting items for systematic reviews and meta-analyses: the PRISMA statement. Brit. Med. J. 339 , b2535 (2009).
Westgate, M. J. revtools: an R package to support article screening for evidence synthesis. Res. Synth. Methods. 10 , 606–614 (2019).
Kelleher, I., Harley, M., Murtagh, A. & Cannon, M. Are screening instruments valid for psychotic-like experiences? A validation study of screening questions for psychotic-like experiences using in-depth clinical interview. Schizophr. Bull. 37 , 362–369 (2011).
Morgan, C. J. A., Freeman, T. P., Powell, J. & Curran, H. V. AKT1 genotype moderates the acute psychotomimetic effects of naturalistically smoked cannabis in young cannabis smokers. Transl. Psychiatry 6 , e738 (2016).
Ivimey‐Cook, E. R., Noble, D. W. A., Nakagawa, S., Lajeunesse, M. J. & Pick, J. L. Advice for improving the reproducibility of data extraction in meta‐analysis. Res. Synth. Methods. 14 , 911–915 (2023).
Signorell, A. et al. DescTools: Tools for Descriptive Statistics R Package version 0.99 https://cran.r-project.org/web/packages/DescTools/index.html (2019).
Viechtbauer, W. Conducting meta-analyses in R with the metafor package. J. Stat. Softw . https://doi.org/10.18637/jss.v036.i03 (2010).
Peters, J. L. Comparison of two methods to detect publication bias in meta-analysis. JAMA 295 , 676–680 (2006).
Borenstein, M., Hedges, L. V., Higgins, J. P. T. & Rothstein, H. R. in Introduction to Meta-Analysis 225–238 (John Wiley & Sons, 2009); https://doi.org/10.1002/9780470743386.ch24
Mason, O. et al. Acute cannabis use causes increased psychotomimetic experiences in individuals prone to psychosis. Psychol. Med. 39 , 951–956 (2009).
D’Souza, D. C. et al. Delta-9-tetrahydrocannabinol effects in schizophrenia: implications for cognition, psychosis, and addiction. Biol. Psychiatry 57 , 594–608 (2005).
Solowij, N. et al. A randomised controlled trial of vaporised Δ9-tetrahydrocannabinol and cannabidiol alone and in combination in frequent and infrequent cannabis users: acute intoxication effects. Eur. Arch. Psychiatry Clin. Neurosci. 269 , 17–35 (2019).
Vadhan, N. P., Corcoran, C. M., Bedi, G., Keilp, J. G. & Haney, M. Acute effects of smoked marijuana in marijuana smokers at clinical high-risk for psychosis: a preliminary study. Psychiatry Res. 257 , 372–374 (2017).
Radhakrishnan, R. et al. GABA deficits enhance the psychotomimetic effects of Δ9-THC. Neuropsychopharmacology 40 , 2047–2056 (2015).
Higgins, J. P. T. & Thompson, S. G. Quantifying heterogeneity in a meta-analysis. Stat. Med. 21 , 1539–1558 (2002).
Tang, J.-L. & Liu, J. L. Misleading funnel plot for detection of bias in meta-analysis. J. Clin. Epidemiol. 53 , 477–484 (2000).
Duval, S. & Tweedie, R. Trim and fill: a simple funnel-plot-based method of testing and adjusting for publication bias in meta-analysis. Biometrics 56 , 455–463 (2000).
Viechtbauer, W. & Cheung, M. W.-L. Outlier and influence diagnostics for meta-analysis. Res. Synth. Methods 1 , 112–125 (2010).
Harrer, M., Cuijpers, P., Furukawa, T. & Ebert, D. D. dmetar: Companion R Package for the Guide ’Doing Meta-Analysis in R’ R package version 00.9000 http://dmetar.protectlab.org/ (2019).
Thomas, H. A community survey of adverse effects of cannabis use. Drug Alcohol Depend. 42 , 201–207 (1996).
Olsson, F. et al. An observational study of safety and clinical outcome measures across patient groups in the United Kingdom Medical Cannabis Registry. Expert Rev. Clin. Pharmacol. 16 , 257–266 (2023).
Arendt, M. et al. Testing the self-medication hypothesis of depression and aggression in cannabis-dependent subjects. Psychol. Med. 37 , 935–945 (2007).
Bonn-Miller, M. O. et al. The short-term impact of 3 smoked cannabis preparations versus placebo on PTSD symptoms: a randomized cross-over clinical trial. PLoS ONE 16 , e0246990 (2021).
Stokes, P. R. A., Mehta, M. A., Curran, H. V., Breen, G. & Grasby Paul, R. A. Can recreational doses of THC produce significant dopamine release in the human striatum? Neuroimage 48 , 186–190 (2009).
Zuurman, L. et al. Effect of intrapulmonary tetrahydrocannabinol administration in humans. J. Psychopharmacol. 22 , 707–716 (2008).
Safakish, R. et al. Medical cannabis for the management of pain and quality of life in chronic pain patients: a prospective observational study. Pain Med. 21 , 3073–3086 (2020).
Favrat, B. et al. Two cases of ‘cannabis acute psychosis’ following the administration of oral cannabis. BMC Psychiatry 5 , 17 (2005).
Balash, Y. et al. Medical cannabis in Parkinson disease: real-life patients' experience. Clin. Neuropharmacol. 40 , 268–272 (2017).
Habib, G. & Levinger, U. Characteristics of medical cannabis usage among patients with fibromyalgia. Harefuah 159 , 343–348 (2020).
PubMed Google Scholar
Beaulieu, P. Effects of nabilone, a synthetic cannabinoid, on postoperative pain. Can J. Anesth. 53 , 769–775 (2006).
Rup, J., Freeman, T. P., Perlman, C. & Hammond, D. Cannabis and mental health: adverse outcomes and self-reported impact of cannabis use by mental health status. Subst. Use Misuse 57 , 719–729 (2022).
Download references
Acknowledgments
This research was funded in whole, or in part, by the Wellcome Trust (grant nos. 218641/Z/19/Z (to T.S.) and 215917/Z/19/Z (to J.R.B.)). For the purpose of open access, the author has applied a CC BY public copyright license to any Author Accepted Manuscript version arising from this submission. J.-B.P. is funded by the Medical Research Foundation 2018 Emerging Leaders First Prize in Adolescent Mental Health (MRF-160-0002-ELP-PINGA (to J.-B.P.)). The funders had no role in study design, data collection and analysis, decision to publish, or preparation of the manuscript.
Author information
Authors and affiliations.
Department of Computational Biology, University of Lausanne, Lausanne, Switzerland
Tabea Schoeler
Department of Clinical, Educational and Health Psychology, Division of Psychology and Language Sciences, University College London, London, UK
Tabea Schoeler, Jessie R. Baldwin, Ellen Martin, Wikus Barkhuizen & Jean-Baptiste Pingault
Social, Genetic and Developmental Psychiatry Centre, Institute of Psychiatry, Psychology and Neuroscience, King’s College London, London, UK
Jessie R. Baldwin & Jean-Baptiste Pingault
You can also search for this author in PubMed Google Scholar
Contributions
T.S., J.R.B., and J.-B.P. conceived and designed the study. T.S., E.M., and W.B. acquired the data. T.S. analyzed the data and drafted the paper. All authors (T.S., J.R.B., E.M., W.B., and J.-B.P.) reviewed and approved the manuscript.
Corresponding author
Correspondence to Tabea Schoeler .
Ethics declarations
Competing interests.
The authors declare no competing interests.
Peer review
Peer review information.
Nature Mental Health thanks Evangelos Vassos and the other, anonymous, reviewer(s) for their contribution to the peer review of this work.
Additional information
Publisher’s note Springer Nature remains neutral with regard to jurisdictional claims in published maps and institutional affiliations.
Supplementary information
Supplementary information.
Supplementary Figs. 1–7, Methods (literature search, estimation of Cohen’s d , classification of predictors of CAPS, analysis plan), and references.
Reporting Summary
Supplementary tables.
Supplementary Tables 1–5.
Rights and permissions
Open Access This article is licensed under a Creative Commons Attribution 4.0 International License, which permits use, sharing, adaptation, distribution and reproduction in any medium or format, as long as you give appropriate credit to the original author(s) and the source, provide a link to the Creative Commons licence, and indicate if changes were made. The images or other third party material in this article are included in the article’s Creative Commons licence, unless indicated otherwise in a credit line to the material. If material is not included in the article’s Creative Commons licence and your intended use is not permitted by statutory regulation or exceeds the permitted use, you will need to obtain permission directly from the copyright holder. To view a copy of this licence, visit http://creativecommons.org/licenses/by/4.0/ .
Reprints and permissions
About this article
Cite this article.
Schoeler, T., Baldwin, J.R., Martin, E. et al. Assessing rates and predictors of cannabis-associated psychotic symptoms across observational, experimental and medical research. Nat. Mental Health (2024). https://doi.org/10.1038/s44220-024-00261-x
Download citation
Received : 06 September 2023
Accepted : 26 April 2024
Published : 03 June 2024
DOI : https://doi.org/10.1038/s44220-024-00261-x
Share this article
Anyone you share the following link with will be able to read this content:
Sorry, a shareable link is not currently available for this article.
Provided by the Springer Nature SharedIt content-sharing initiative
Quick links
- Explore articles by subject
- Guide to authors
- Editorial policies
Sign up for the Nature Briefing newsletter — what matters in science, free to your inbox daily.

Information
- Author Services
Initiatives
You are accessing a machine-readable page. In order to be human-readable, please install an RSS reader.
All articles published by MDPI are made immediately available worldwide under an open access license. No special permission is required to reuse all or part of the article published by MDPI, including figures and tables. For articles published under an open access Creative Common CC BY license, any part of the article may be reused without permission provided that the original article is clearly cited. For more information, please refer to https://www.mdpi.com/openaccess .
Feature papers represent the most advanced research with significant potential for high impact in the field. A Feature Paper should be a substantial original Article that involves several techniques or approaches, provides an outlook for future research directions and describes possible research applications.
Feature papers are submitted upon individual invitation or recommendation by the scientific editors and must receive positive feedback from the reviewers.
Editor’s Choice articles are based on recommendations by the scientific editors of MDPI journals from around the world. Editors select a small number of articles recently published in the journal that they believe will be particularly interesting to readers, or important in the respective research area. The aim is to provide a snapshot of some of the most exciting work published in the various research areas of the journal.
Original Submission Date Received: .
- Active Journals
- Find a Journal
- Proceedings Series
- For Authors
- For Reviewers
- For Editors
- For Librarians
- For Publishers
- For Societies
- For Conference Organizers
- Open Access Policy
- Institutional Open Access Program
- Special Issues Guidelines
- Editorial Process
- Research and Publication Ethics
- Article Processing Charges
- Testimonials
- Preprints.org
- SciProfiles
- Encyclopedia
Article Menu

- Subscribe SciFeed
- Recommended Articles
- Google Scholar
- on Google Scholar
- Table of Contents
Find support for a specific problem in the support section of our website.
Please let us know what you think of our products and services.
Visit our dedicated information section to learn more about MDPI.
JSmol Viewer
Morphological characteristics of the double mental foramen and its relevance in clinical practice: an observational study.

1. Introduction
2. materials and methods, 4. clinical considerations, 5. discussion, 6. conclusions, author contributions, institutional review board statement, informed consent statement, data availability statement, acknowledgments, conflicts of interest.
- Lipski, M.; Tomaszewska, I.M.; Lipska, W.; Lis, G.J.; Tomaszewski, K.A. The mandible and its foramen: Anatomy, anthropology, embryology and resulting clinical implications. Folia Morphol. 2013 , 72 , 285–292. [ Google Scholar ] [ CrossRef ] [ PubMed ]
- Tiwari, N. Left Accessory Mental Foramen in Dry Mandibles in Department of Anatomy in a Medical College: A Descriptive Cross-sectional Study. J. Nepal Med. Assoc. 2022 , 60 , 805–807. [ Google Scholar ] [ CrossRef ] [ PubMed ]
- Aljarbou, F.; Riyahi, A.M.; Altamimi, A.; Alabdulsalam, A.; Jabhan, N.; Aldosimani, M.; Alamri, H.M. Anatomy of the accessory mental foramen in a Saudi subpopulation: A multicenter CBCT study. Saudi Dent. J. 2021 , 33 , 1012–1017. [ Google Scholar ] [ CrossRef ] [ PubMed ]
- Iwanaga, J.; Saga, T.; Tabira, Y.; Nakamura, M.; Kitashima, S.; Watanabe, K.; Kusukawa, J.; Yamaki, K.-I. The clinical anatomy of accessory mental nerves and foramina. Clin. Anat. 2015 , 28 , 848–856. [ Google Scholar ] [ CrossRef ] [ PubMed ]
- Balcioglu, H.A.; Kilic, C.; Akyol, M.; Ulusoy, A.T. Horizontal migration of pre- and postnatal mental foramen: An anatomic study. Int. J. Pediatr. Otorhinolaryngol. 2011 , 75 , 1436–1441. [ Google Scholar ] [ CrossRef ]
- Yoon, T.Y.; Ahmadi, A.G.; Saed, N.A.; Estrin, N.; Miller, D.E.; Dinh, T.N. Prevalence and anatomical characteristics of the accessory mental foramen: A study using cone beam computed tomography. Gen. Dent. 2019 , 67 , 62–67. [ Google Scholar ] [ PubMed ]
- Valenzuela-Fuenzalida, J.J.; Cariseo, C.; Gold, M.; Díaz, D.; Orellana, M.; Iwanaga, J. Anatomical variations of the mandibular canal and their clinical implications in dental practice: A literature review. Surg. Radiol. Anat. 2021 , 43 , 1259–1272. [ Google Scholar ] [ CrossRef ] [ PubMed ]
- Daniel, P.; Rajkohila, J.; Ambikaipakan, S.; Rabi, S. Morphological and morphometric analysis of accessory mental foramen in dry human mandibles of south indian population. Indian J. Dent. Res. 2018 , 29 , 56–60. [ Google Scholar ] [ CrossRef ]
- Gümüşok, M.; Akarslan, Z.Z.; Başman, A.; Üçok, Ö. Evaluation of accessory mental foramina morphology with cone-beam computed tomography. Niger. J. Clin. Pract. 2017 , 20 , 1550–1554. [ Google Scholar ] [ CrossRef ]
- Nagarajappa, A.K.; Alam, M.K.; Alanazi, A.A.; Bandela, V.; Faruqi, S. Implications of impacted mandibular cuspids on mental foramen position. Saudi Dent. J. 2020 , 33 , 713–717. [ Google Scholar ] [ CrossRef ]
- Filo, K.; Schneider, T.; Locher, M.C.; Kruse, A.L.; Lübbers, H.T. The inferior alveolar nerve’s loop at the mental foramen and its implications for surgery. J. Am. Dent. Assoc. 2014 , 145 , 260–269. [ Google Scholar ] [ CrossRef ] [ PubMed ]
- Dalga, S. Topographic and morphometric study of the mental foramina of Abaza goats with its clinical implication for regional anesthesia. Folia Morphol. 2020 , 79 , 576–579. [ Google Scholar ] [ CrossRef ] [ PubMed ]
- Greenstein, G.; Tarnow, D. The mental foramen and nerve: Clinical and anatomical factors related to dental implant placement: A literature review. J. Periodontol. 2006 , 77 , 1933–1943. [ Google Scholar ] [ CrossRef ] [ PubMed ]
- Hwang, K.; Lee, W.J.; Song, Y.B.; Chung, I.H. Vulnerability of the inferior alveolar nerve and mental nerve during genioplasty: An anatomic study. J. Craniofacial Surg. 2005 , 16 , 10–14, discussion 14. [ Google Scholar ] [ CrossRef ]
- Laher, A.E.; Wells, M.; Motara, F.; Kramer, E.; Moolla, M.; Mahomed, Z. Finding the mental foramen. Surg. Radiol. Anat. 2016 , 38 , 469–476. [ Google Scholar ] [ CrossRef ] [ PubMed ]
- Pelé, A.; Berry, P.-A.; Evanno, C.; Jordana, F. Evaluation of Mental Foramen with Cone Beam Computed Tomography: A Systematic Review of Literature. Radiol. Res. Pract. 2021 , 2021 , 1–10. [ Google Scholar ] [ CrossRef ]
- Orhan, A.I.; Orhan, K.; Aksoy, S.; Özgül, O.; Horasan, S.; Arslan, A.; Kocyigit, D. Evaluation of perimandibular neurovascularization with accessory mental foramina using cone-beam computed tomography in children. J. Craniofacial Surg. 2013 , 24 , e365–e369. [ Google Scholar ] [ CrossRef ]
- Yalcin, T.Y.; Bektaş-Kayhan, K.; Yilmaz, A.; Ozcan, I. An Alternative Classification Scheme for Accessory Mental Foramen. Curr. Med. Imaging 2021 , 17 , 410–416. [ Google Scholar ] [ CrossRef ] [ PubMed ]
- Rahpeyma, A.; Khajehahmadi, S. Accessory mental foramen and maxillofacial surgery. J. Craniofacial Surg. 2018 , 29 , e216–e217. [ Google Scholar ] [ CrossRef ]
- Zmysłowska-Polakowska, E.; Radwański, M.; Łęski, M.; Ledzion, S.; Łukomska-Szymańska, M.; Polguj, M. The assessment of accessory mental foramen in a selected polish population: A CBCT study. BMC Med. Imaging 2017 , 17 , 17. [ Google Scholar ] [ CrossRef ]
- Torres, M.G.G.; Valverde, L.d.F.; Vidal, M.T.A.; Crusoé-Rebello, I.M. Accessory mental foramen: A rare anatomical variation detected by cone-beam computed tomography. Imaging Sci. Dent. 2015 , 45 , 61–65. [ Google Scholar ] [ CrossRef ]
- Naitoh, M.; Yoshida, K.; Nakahara, K.; Gotoh, K.; Ariji, E. Demonstration of the accessory mental foramen using rotational panoramic radiography compared with cone-beam computed tomography: Demonstration of the accessory mental foramen using rotational panoramic radiography. Clin. Oral Implant. Res. 2011 , 22 , 1415–1419. [ Google Scholar ] [ CrossRef ]
- Guo, J.L.; Su, L.; Zhao, J.L.; Yang, L.; Lv, D.L.; Li, Y.Q.; Cheng, F.B. Location of mental foramen based on soft- and hard-tissue landmarks in a chinese population. J. Craniofacial Surg. 2009 , 20 , 2235–2237. [ Google Scholar ] [ CrossRef ]
- Iwanaga, J.; Watanabe, K.; Saga, T.; Tabira, Y.; Kitashima, S.; Kusukawa, J.; Yamaki, K. Accessory mental foramina and nerves: Application to periodontal, periapical, and implant surgery. Clin. Anat. 2016 , 29 , 493–501. [ Google Scholar ] [ CrossRef ] [ PubMed ]
- Direk, F.; Uysal, I.I.; Kivrak, A.S.; Fazliogullari, Z.; Unver Dogan, N.; Karabulut, A.K. Mental foramen and lingual vascular canals of mandible on MDCT images: Anatomical study and review of the literature. Anat. Sci. Int. 2018 , 93 , 244–253. [ Google Scholar ] [ CrossRef ] [ PubMed ]
- Lam, M.; Koong, C.; Kruger, E.; Tennant, M. Prevalence of accessory mental foramina: A study of 4000 CBCT scans. Clin. Anat. 2019 , 32 , 1048–1052. [ Google Scholar ] [ CrossRef ]
- Li, Y.; Yang, X.; Zhang, B.; Wei, B.; Gong, Y. Detection and characterization of the accessory mental foramen using cone-beam computed tomography. Acta Odontol. Scand. 2018 , 76 , 77–85. [ Google Scholar ] [ CrossRef ] [ PubMed ]
- Naitoh, M.; Hiraiwa, Y.; Aimiya, H.; Gotoh, K.; Ariji, E. Accessory mental foramen assessment using cone-beam computed tomography. Oral Surg. Oral Med. Oral Pathol. Oral Radiol. Endodontol. 2009 , 107 , 289–294. [ Google Scholar ] [ CrossRef ] [ PubMed ]
- Paraskevas, G.; Mavrodi, A.; Natsis, K. Accessory mental foramen: An anatomical study on dry mandibles and review of the literature. Oral Maxillofac. Surg. 2015 , 19 , 177–181. [ Google Scholar ] [ CrossRef ]
- Sun, C.X.; Henkin, J.M.; Ririe, C.; Javadi, E. Implant failure associated with actinomycosis in a medically compromised patient. J. Oral Implant. 2013 , 39 , 206–209. [ Google Scholar ] [ CrossRef ]
- Muinelo-Lorenzo, J.; Rodríguez-Pato, R.; Martínez-Reglero, C.; Salgado-Barreira, A.; Suárez-Cunqueiro, M.M. Detection of the Accessory Mental Foramina on Human Mandibles Using Cone-beam Computed Tomography: A Systematic Review and Meta-analysis. J. Endod. 2021 , 47 , 1215–1228. [ Google Scholar ] [ CrossRef ] [ PubMed ]
- Katakami, K.; Mishima, A.; Shiozaki, K.; Shimoda, S.; Hamada, Y.; Kobayashi, K. Characteristics of accessory mental foramina observed on limited cone-beam computed tomography images. J. Endod. 2008 , 34 , 1441–1445. [ Google Scholar ] [ CrossRef ]
- Toh, H.; Kodama, J.; Yanagisako, M.; Ohmori, T. Anatomical study of the accessory mental foramen and the distribution of its nerve. Okajimas Folia Anat. Jpn. 1992 , 69 , 85–88. [ Google Scholar ] [ CrossRef ] [ PubMed ]
- Savoldi, F.; Yon, M.J.; Kwok, V.M.; Yeung, A.W.; Tanaka, R.; Tsoi, J.K.; Matinlinna, J.P.; Bornstein, M.M. Accuracy of CBCT in the Identification of Mental, Lingual, and Retromolar Foramina: A Comparison with Visual Inspection of Human Dry Mandibles. Int. J. Periodontics Restor. Dent. 2021 , 41 , e277–e286. [ Google Scholar ] [ CrossRef ] [ PubMed ]
- Hester, K.M.; Rahimi, O.B.; Fry, C.L.; Nation, H.L. The relative locations of the supraorbital, infraorbital, and mental foramina: A cadaveric study. J. Anat. 2021 , 239 , 782–787. [ Google Scholar ] [ CrossRef ] [ PubMed ]
- Kqiku, L.; Weiglein, A.; Kamberi, B.; Hoxha, V.; Meqa, K.; Städtler, P. Position of the mental foramen in Kosovarian population. Coll. Antropol. 2013 , 37 , 545–549. [ Google Scholar ]
- Han, S.-S.; Hwang, J.J.; Jeong, H.-G. Accessory mental foramina associated with neurovascular bundle in Korean population. Surg. Radiol. Anat. 2016 , 38 , 1169–1174. [ Google Scholar ] [ CrossRef ]
Click here to enlarge figure
| Author and Year | Country | Total N and Example | Presence Foramen Mentoniano Accesory | Unilateral (Left and Right) | Bilateral |
|---|---|---|---|---|---|
| Aljarbou, 2021 [ ] | Saudi Arabia | 603 via CBT | 60/603 9.95% | 27 left and 33 right | They did not report |
| Rahpeyma, 2018 [ ] | Iran | 5 via CBT and OPG | 5/5 100% | 1 left and 2 right | 2 |
| Zmysłowska-polakowska, 2017 [ ] | Poland | 200 via CBCT | 28/200 10% | 13 left and 15 right | They did not report |
| Torres, 2015 [ ] | Brazil | 1 via CBCT | 1/1 100% | 1 right | They did not report |
| Naitoh, 2011 [ ] | Japan | 365 via CBCT | 28/365 7.67% | 23 side is not specified | 7 |
| Gümüşok, 2017 [ ] | Turkey | 645 via CBCT | 75/645 11.62% | 69 side is not specified | 6 |
| Guo, 2009 [ ] | China | 21 through embalmed adult corpses | 2/21 9.52% | 2 side is not specified | They did not report |
| Iwanaga, 2016 [ ] | Japan | 63 via CBCT | 9/63 14.28% | 3 left and 1 right | 5 |
| Katakami, 2008 [ ] | Japan | 150 via CBCT | 16/150 10.66% | 15 side is not specified | 1 |
| Lam, 2019 [ ] | Australia | 4000 via CBCT | 254/4000 6.35% | 122 left and 110 right | 12 |
| Li, 2018 [ ] | China | 787 via CBCT | 57/787 7.24% | 16 left and 37 right | 4 |
| Muinelo Lorenzo, 2021 [ ] | Spain | 357 via CBCT and PAN | 48/357 13.44% | 20 left and 28 right | They did not report |
| Naitoh, 2009 [ ] | Japan | 157 via CBCT | 15/157 9.55% | 6 left and 9 right | They did not report |
| Paraskevás, 2015 [ ] | Germany | 96 through dry jaws | 4/96 4.16% | 4 side is not specified | They did not report |
| Sun, 2013 [ ] | South Korea | 446 via CBCT | 39/446 8.74% | 13 left and 20 right | 6 |
| Tiwari, 2022 [ ] | Nepal | 47 dry jaws | 4/47 8.51% | 4 left and 0 right | They did not report |
| Toh, 1992 [ ] | Japan | 3 corpses | 3/3 100% | 1 left and 2 right | They did not report |
| Current study, 2024 | Chile | 260 dry jaws | 8/260 3.07% | 3 left and 2 right | 3 |
| Total Studies | Number of Jaws | Unilateral Prevalence | Bilateral Prevalence | Prevalence in Women | Prevalence in Men | Prevalence by Region |
|---|---|---|---|---|---|---|
| 17 | 7946 Mean 467.4 | 597/7.5% | 41/0.51% | 127/21.27 | 125/20.93% | Asia: 12 Oceania: 1 Africa: 0 America: 1 Europe: 3 |
| Current study, 2024 | 260 | 5/1.84% | 3/1.23% | - | - | 1 South America |
| The statements, opinions and data contained in all publications are solely those of the individual author(s) and contributor(s) and not of MDPI and/or the editor(s). MDPI and/or the editor(s) disclaim responsibility for any injury to people or property resulting from any ideas, methods, instructions or products referred to in the content. |
Share and Cite
Bruna-Mejias, A.; Nova-Baeza, P.; Torres-Riquelme, F.; Delgado-Retamal, M.F.; Orellana-Donoso, M.; Suazo-Santibañez, A.; Sepulveda-Loyola, W.; Valdés-Orrego, I.; Sanchis-Gimeno, J.; Valenzuela-Fuenzalida, J.J. Morphological Characteristics of the Double Mental Foramen and Its Relevance in Clinical Practice: An Observational Study. Diagnostics 2024 , 14 , 1277. https://doi.org/10.3390/diagnostics14121277
Bruna-Mejias A, Nova-Baeza P, Torres-Riquelme F, Delgado-Retamal MF, Orellana-Donoso M, Suazo-Santibañez A, Sepulveda-Loyola W, Valdés-Orrego I, Sanchis-Gimeno J, Valenzuela-Fuenzalida JJ. Morphological Characteristics of the Double Mental Foramen and Its Relevance in Clinical Practice: An Observational Study. Diagnostics . 2024; 14(12):1277. https://doi.org/10.3390/diagnostics14121277
Bruna-Mejias, Alejandro, Pablo Nova-Baeza, Florencia Torres-Riquelme, Maria Fernanda Delgado-Retamal, Mathias Orellana-Donoso, Alejandra Suazo-Santibañez, Walter Sepulveda-Loyola, Iván Valdés-Orrego, Juan Sanchis-Gimeno, and Juan José Valenzuela-Fuenzalida. 2024. "Morphological Characteristics of the Double Mental Foramen and Its Relevance in Clinical Practice: An Observational Study" Diagnostics 14, no. 12: 1277. https://doi.org/10.3390/diagnostics14121277
Article Metrics
Article access statistics, further information, mdpi initiatives, follow mdpi.
Subscribe to receive issue release notifications and newsletters from MDPI journals
- Open access
- Published: 14 June 2024
Associations between deep venous thrombosis and thyroid diseases: a two-sample bidirectional Mendelian randomization study
- Lifeng Zhang 1 na1 ,
- Kaibei Li 2 na1 ,
- Qifan Yang 1 ,
- Yao Lin 1 ,
- Caijuan Geng 1 ,
- Wei Huang 1 &
- Wei Zeng 1
European Journal of Medical Research volume 29 , Article number: 327 ( 2024 ) Cite this article
151 Accesses
Metrics details
Some previous observational studies have linked deep venous thrombosis (DVT) to thyroid diseases; however, the findings were contradictory. This study aimed to investigate whether some common thyroid diseases can cause DVT using a two-sample Mendelian randomization (MR) approach.
This two-sample MR study used single nucleotide polymorphisms (SNPs) identified by the FinnGen genome-wide association studies (GWAS) to be highly associated with some common thyroid diseases, including autoimmune hyperthyroidism (962 cases and 172,976 controls), subacute thyroiditis (418 cases and 187,684 controls), hypothyroidism (26,342 cases and 59,827 controls), and malignant neoplasm of the thyroid gland (989 cases and 217,803 controls. These SNPs were used as instruments. Outcome datasets for the GWAS on DVT (6,767 cases and 330,392 controls) were selected from the UK Biobank data, which was obtained from the Integrative Epidemiology Unit (IEU) open GWAS project. The inverse variance weighted (IVW), MR-Egger and weighted median methods were used to estimate the causal association between DVT and thyroid diseases. The Cochran’s Q test was used to quantify the heterogeneity of the instrumental variables (IVs). MR Pleiotropy RESidual Sum and Outlier test (MR-PRESSO) was used to detect horizontal pleiotropy. When the causal relationship was significant, bidirectional MR analysis was performed to determine any reverse causal relationships between exposures and outcomes.
This MR study illustrated that autoimmune hyperthyroidism slightly increased the risk of DVT according to the IVW [odds ratio (OR) = 1.0009; p = 0.024] and weighted median methods [OR = 1.001; p = 0.028]. According to Cochran’s Q test, there was no evidence of heterogeneity in IVs. Additionally, MR-PRESSO did not detect horizontal pleiotropy ( p = 0.972). However, no association was observed between other thyroid diseases and DVT using the IVW, weighted median, and MR-Egger regression methods.
Conclusions
This study revealed that autoimmune hyperthyroidism may cause DVT; however, more evidence and larger sample sizes are required to draw more precise conclusions.
Introduction
Deep venous thrombosis (DVT) is a common type of disease that occurs in 1–2 individuals per 1000 each year [ 1 ]. In the post-COVID-19 era, DVT showed a higher incidence rate [ 2 ]. Among hospitalized patients, the incidence rate of this disease was as high as 2.7% [ 3 ], increasing the risk of adverse events during hospitalization. According to the Registro Informatizado Enfermedad Tromboembolica (RIETE) registry, which included data from ~ 100,000 patients from 26 countries, the 30-day mortality rate was 2.6% for distal DVT and 3.3% for proximal DVT [ 4 ]. Other studies have shown that the one-year mortality rate of DVT is 19.6% [ 5 ]. DVT and pulmonary embolism (PE), collectively referred to as venous thromboembolism (VTE), constitute a major global burden of disease [ 6 ].
Thyroid diseases are common in the real world. Previous studies have focused on the relationship between DVT and thyroid diseases, including thyroid dysfunction and thyroid cancer. Some case reports [ 7 , 8 , 9 ] have demonstrated that hyperthyroidism is often associated with DVT and indicates a worse prognosis [ 10 ]. The relationship between thyroid tumors and venous thrombosis has troubled researchers for many years. In 1989, the first case of papillary thyroid carcinoma presenting with axillary vein thrombosis as the initial symptom was reported [ 11 ]. In 1995, researchers began to notice the relationship between thyroid tumors and hypercoagulability [ 12 ], laying the foundation for subsequent extensive research. However, the aforementioned observational studies had limitations, such as small sample sizes, selection bias, reverse causality, and confounding factors, which may have led to unreliable conclusions [ 13 ].
Previous studies have explored the relationship of thyroid disease and DVT and revealed that high levels of thyroid hormones may increase the risk of DVT. Hyperthyroidism promotes a procoagulant and hypofibrinolytic state by affecting the von Willebrand factor, factors VIII, IV, and X, fibrinogen, and plasminogen activator inhibitor-1 [ 14 , 15 ]. At the molecular level, researchers believe that thyroid hormones affect coagulation levels through an important nuclear thyroid hormone receptor (TR), TRβ [ 16 ], and participate in pathological coagulation through endothelial dysfunction. Thyroid hormones may have non-genetic effects on the behavior of endothelial cells [ 17 , 18 ]. In a study regarding tumor thrombosis, Lou [ 19 ] found that 303 circular RNAs were differentially expressed in DVT using microarray. Kyoto Encyclopedia of Genes and Genomes (KEGG) analysis revealed that the most significantly enriched pathways included thyroid hormone-signaling pathway and endocytosis, and also increased level of proteoglycans in cancer. This indicated that tumor cells and thyroid hormones might interact to promote thrombosis. Based on these studies, we speculated that thyroid diseases, including thyroid dysfunction and thyroid tumors, may cause DVT.
Mendelian randomization (MR) research is a causal inference technique that can be used to assess the causal relationship and reverse causation between specific exposure and outcome factors. If certain assumptions [ 20 ] are fulfilled, genetic variants can be employed as instrumental variables (IVs) to establish causal relationships. Bidirectional MR analysis can clarify the presence of reverse causal relationships [ 21 ], making the conclusions more comprehensive. Accordingly, we aimed to apply a two-sample MR strategy to investigate whether DVT is related to four thyroid diseases, including autoimmune hyperthyroidism, subacute thyroiditis, hypothyroidism, and thyroid cancer.
Study design
MR relies on single nucleotide polymorphisms (SNPs) as IVs. The IVs should fulfill the following three criteria [ 22 ]: (1) IVs should be strongly associated with exposure. (2) Genetic variants must be independent of unmeasured confounding factors that may affect the exposure–outcome association. (3) IVs are presumed to affect the outcome only through their associations with exposure (Fig. 1 ). IVs that met the above requirements were used to estimate the relationship between exposure and outcome. Our study protocol conformed to the STROBE-MR Statement [ 23 ], and all methods were performed in accordance with the relevant guidelines and regulations.

The relationship between instrumental variables, exposure, outcome, and confounding factors
Data sources and instruments
Datasets (Table 1 ) in this study were obtained from a publicly available database (the IEU open genome-wide association studies (GWAS) project [ 24 ] ( https://gwas.mrcieu.ac.uk )). There was no overlap in samples between the data sources of outcome and exposures. Using de-identified summary-level data, privacy information such as overall age and gender were hidden. Ethical approval was obtained for all original work. This study complied with the terms of use of the database.
MR analysis was performed using the R package “TwoSampleMR”. SNPs associated with each thyroid disease at the genome-wide significance threshold of p < 5.0 × 10 –8 were selected as potential IVs. To ensure independence between the genetic variants used as IVs, the linkage disequilibrium (LD) threshold for grouping was set to r 2 < 0.001 with a window size of 10,000 kb. The SNP with the lowest p -value at each locus was retained for analyses.
Statistical analysis
Multiple MR methods were used to infer causal relationships between thyroid diseases and DVT, including the inverse variance weighted (IVW), weighted median, and MR-Egger tests, after harmonizing the SNPs across the GWASs of exposures and outcomes. The main analysis was conducted using the IVW method. Heterogeneity and pleiotropy were also performed in each MR analysis. Meanwhile, the MR-PRESSO Global test [ 25 ] was utilized to detect horizontal pleiotropy. The effect trend of SNP was observed through a scatter plot, and the forest plot was used to observe the overall effects. When a significant causal relationship was confirmed by two-sample MR analysis, bidirectional MR analysis was performed to assess reverse causal relationships by swapping exposure and outcome factors. Parameters were set the same as before. All abovementioned statistical analyses were performed using the package TwoSampleMR (version 0.5.7) in the R program (version 4.2.1).
After harmonizing the SNPs across the GWASs for exposures and outcomes, the IVW (OR = 1.0009, p = 0.024, Table 2 ) and weighted median analyses (OR = 1.001, p = 0.028) revealed significant causal effects between autoimmune hyperthyroidism and DVT risk. Similar results were observed using the weighted median approach Cochran’s Q test, MR-Egger intercept, and MR-PRESSO tests suggested that the results were not influenced by pleiotropy and heterogeneity (Table 2 ). However, the leave-one-out analysis revealed a significant difference after removing some SNPs (rs179247, rs6679677, rs72891915, and rs942495, p < 0.05, Figure S2a), indicating that MR results were dependent on these SNPs (Figure S2, Table S1). No significant effects were observed in other thyroid diseases (Table 2 ). The estimated scatter plot of the association between thyroid diseases and DVT is presented in Fig. 2 , indicating a positive causal relationship between autoimmune hyperthyroidism and DVT (Fig. 2 a). The forest plots of single SNPs affecting the risk of DVT are displayed in Figure S1.

The estimated scatter plot of the association between thyroid diseases and DVT. MR-analyses are derived using IVW, MR-Egger, weighted median and mode. By fitting different models, the scatter plot showed the relationship between SNP and exposure factors, predicting the association between SNP and outcomes
Bidirectional MR analysis was performed to further determine the relationship between autoimmune hyperthyroidism and DVT. The reverse causal relationship was not observed (Table S2), which indicated that autoimmune hyperthyroidism can cause DVT from a mechanism perspective.
This study used MR to assess whether thyroid diseases affect the incidence of DVT. The results showed that autoimmune hyperthyroidism can increase the risk of DVT occurrence, but a reverse causal relationship was not observed between them using bidirectional MR analysis. However, other thyroid diseases, such as subacute thyroiditis, hypothyroidism, and thyroid cancer, did not show a similar effect.
Recently, several studies have suggested that thyroid-related diseases may be associated with the occurrence of DVT in the lower extremities, which provided etiological clues leading to the occurrence of DVT in our subsequent research. In 2006, a review mentioned the association between thyroid dysfunction and coagulation disorders [ 26 ], indicating a hypercoagulable state in patients with hyperthyroidism. In 2011, a review further suggested a clear association between hypothyroidism and bleeding tendency, while hyperthyroidism appeared to increase the risk of thrombotic events, particularly cerebral venous thrombosis [ 27 ]. A retrospective cohort study [ 28 ] supported this conclusion, but this study only observed a higher proportion of concurrent thyroid dysfunction in patients with cerebral venous thrombosis. The relationship between thyroid function and venous thromboembolism remains controversial. Krieg VJ et al. [ 29 ] found that hypothyroidism has a higher incidence rate in patients with chronic thromboembolic pulmonary hypertension and may be associated with more severe disease, which seemed to be different from previous views that hyperthyroidism may be associated with venous thrombosis. Alsaidan [ 30 ] also revealed that the risk of developing venous thrombosis was almost increased onefold for cases with a mild-to-moderate elevation of thyroid stimulating hormone and Free thyroxine 4(FT4). In contrast, it increased twofold for cases with a severe elevation of thyroid stimulating hormone and FT4. Raised thyroid hormones may increase the synthesis or secretion of coagulation factors or may decrease fibrinolysis, which may lead to the occurrence of coagulation abnormality.
Other thyroid diseases are also reported to be associated with DVT. In a large prospective cohort study [ 31 ], the incidence of venous thromboembolism was observed to increase in patients with thyroid cancer over the age of 60. However, other retrospective studies did not find any difference compared with the general population [ 32 ]. In the post-COVID-19 era, subacute thyroiditis has received considerable attention from researchers. New evidence suggests that COVID-19 may be associated with subacute thyroiditis [ 33 , 34 ]. Mondal et al. [ 35 ] found that out of 670 COVID-19 patients, 11 presented with post-COVID-19 subacute thyroiditis. Among them, painless subacute thyroiditis appeared earlier and exhibited symptoms of hyperthyroidism. Another case report also indicated the same result, that is, subacute thyroiditis occurred after COVID-19 infection, accompanied by thyroid function changes [ 36 ]. This led us to hypothesize that subacute thyroiditis may cause DVT through alterations in thyroid function.
This study confirmed a significant causal relationship between autoimmune hyperthyroidism and DVT ( p = 0.02). The data were tested for heterogeneity and gene pleiotropy using MR-Egger, Cochran’s Q, and MR-PRESSO tests. There was no evidence that the results were influenced by pleiotropy or heterogeneity. In the leave-one-out analysis, four of the five selected SNPs showed significant effects of autoimmune hyperthyroidism on DVT, suggesting an impact of these SNPs on DVT outcome. Previous studies have focused on the relationship between hyperthyroidism and its secondary arrhythmias and arterial thromboembolism [ 37 , 38 ]. This study emphasized the risk of DVT in patients with hyperthyroidism, which has certain clinical implications. Prophylactic anticoagulant therapy was observed to help prevent DVT in patients with hyperthyroidism. Unfortunately, the results of this study did not reveal any evidence that suggests a relationship between other thyroid diseases and DVT occurrence. This may be due to the limited database, as this study only included the GWAS data from a subset of European populations. Large-scale multiracial studies are needed in the future.
There are some limitations to this study. First, it was limited to participants of European descent. Consequently, further investigation is required to confirm these findings in other ethnicities. Second, this study did not reveal the relationship between complications of hyperthyroidism and DVT. Additionally, this study selected IVs from the database using statistical methods rather than selecting them from the real population. This may result in weaker effects of the screened IVs and reduce the clinical significance of MR analysis. Moreover, the definitions of some diseases in this study were not clear in the original database, and some of the diseases were self-reported, which may reduce the accuracy of diagnosis. Further research is still needed to clarify the causal relationship between DVT and thyroid diseases based on prospective cohort and randomized controlled trials (RCTs).
This study analyzed large-scale genetic data and provided evidence of a causal relationship between autoimmune hyperthyroidism and the risk of DVT, Compared with the other thyroid diseases investigated. Prospective RCTs or MR studies with larger sample sizes are still needed to draw more precise conclusions.
Availability of data and materials
The IEU open gwas project, https://gwas.mrcieu.ac.uk/
Ortel TL, Neumann I, Ageno W, et al. American society of hematology 2020 guidelines for management of venous thromboembolism: treatment of deep vein thrombosis and pulmonary embolism. Blood Adv. 2020;4(19):4693–738.
Article CAS PubMed PubMed Central Google Scholar
Mehrabi F, Farshbafnadi M, Rezaei N. Post-discharge thromboembolic events in COVID-19 patients: a review on the necessity for prophylaxis. Clin Appl Thromb Hemost. 2023;29:10760296221148476.
Article PubMed PubMed Central Google Scholar
Loffredo L, Vidili G, Sciacqua A, et al. Asymptomatic and symptomatic deep venous thrombosis in hospitalized acutely ill medical patients: risk factors and therapeutic implications. Thromb J. 2022;20(1):72.
RIETE Registry. Death within 30 days. RIETE Registry. 2022[2023.8.23]. https://rieteregistry.com/graphics-interactives/dead-30-days/ .
Minges KE, Bikdeli B, Wang Y, Attaran RR, Krumholz HM. National and regional trends in deep vein thrombosis hospitalization rates, discharge disposition, and outcomes for medicare beneficiaries. Am J Med. 2018;131(10):1200–8.
Di Nisio M, van Es N, Büller HR. Deep vein thrombosis and pulmonary embolism. Lancet. 2016;388(10063):3060–73.
Article PubMed Google Scholar
Aquila I, Boca S, Caputo F, et al. An unusual case of sudden death: is there a relationship between thyroid disorders and fatal pulmonary thromboembolism? A case report and review of literature. Am J Forensic Med Pathol. 2017;38(3):229–32.
Katić J, Katić A, Katić K, Duplančić D, Lozo M. Concurrent deep vein thrombosis and pulmonary embolism associated with hyperthyroidism: a case report. Acta Clin Croat. 2021;60(2):314–6.
PubMed PubMed Central Google Scholar
Hieber M, von Kageneck C, Weiller C, Lambeck J. Thyroid diseases are an underestimated risk factor for cerebral venous sinus thrombosis. Front Neurol. 2020;11:561656.
Pohl KR, Hobohm L, Krieg VJ, et al. Impact of thyroid dysfunction on short-term outcomes and long-term mortality in patients with pulmonary embolism. Thromb Res. 2022;211:70–8.
Article CAS PubMed Google Scholar
Sirota DK. Axillary vein thrombosis as the initial symptom in metastatic papillary carcinoma of the thyroid. Mt Sinai J Med. 1989;56(2):111–3.
CAS PubMed Google Scholar
Raveh E, Cohen M, Shpitzer T, Feinmesser R. Carcinoma of the thyroid: a cause of hypercoagulability? Ear Nose Throat J. 1995;74(2):110–2.
Davey Smith G, Hemani G. Mendelian randomization: genetic anchors for causal inference in epidemiological studies. Hum Mol Genet. 2014;23(R1):R89–98.
Stuijver DJ, van Zaane B, Romualdi E, Brandjes DP, Gerdes VE, Squizzato A. The effect of hyperthyroidism on procoagulant, anticoagulant and fibrinolytic factors: a systematic review and meta-analysis. Thromb Haemost. 2012;108(6):1077–88.
PubMed Google Scholar
Son HM. Massive cerebral venous sinus thrombosis secondary to Graves’ disease. Yeungnam Univ J Med. 2019;36(3):273–80.
Elbers LP, Moran C, Gerdes VE, et al. The hypercoagulable state in hyperthyroidism is mediated via the thyroid hormone β receptor pathway. Eur J Endocrinol. 2016;174(6):755–62.
Davis PJ, Sudha T, Lin HY, et al. Thyroid hormone, hormone analogs, and angiogenesis. Compr Physiol. 2015;6(1):353–62.
Mousa SA, Lin HY, Tang HY, et al. Modulation of angiogenesis by thyroid hormone and hormone analogues: implications for cancer management. Angiogenesis. 2014;17(3):463–9.
Lou Z, Li X, Li C, et al. Microarray profile of circular RNAs identifies hsa_circ_000455 as a new circular RNA biomarker for deep vein thrombosis. Vascular. 2022;30(3):577–89.
Hemani G, Bowden J, Davey SG. Evaluating the potential role of pleiotropy in Mendelian randomization studies. Hum Mol Genet. 2018;27(R2):R195–208.
Zhang Z, Li L, Hu Z, et al. Causal effects between atrial fibrillation and heart failure: evidence from a bidirectional Mendelian randomization study. BMC Med Genomics. 2023;16(1):187.
Emdin CA, Khera AV, Kathiresan S. Mendelian randomization. JAMA. 2017;318(19):1925–6.
Skrivankova VW, Richmond RC, Woolf BAR, et al. Strengthening the reporting of observational studies in epidemiology using Mendelian randomization: the STROBE-MR statement. JAMA. 2021;326(16):1614–21.
Hemani G, Zheng J, Elsworth B, et al. The MR-Base platform supports systematic causal inference across the human phenome. Elife. 2018;7: e34408.
Verbanck M, Chen CY, Neale B, Do R. Detection of widespread horizontal pleiotropy in causal relationships inferred from Mendelian randomization between complex traits and diseases. Nat Genet. 2018;50(5):693–8.
Franchini M. Hemostatic changes in thyroid diseases: haemostasis and thrombosis. Hematology. 2006;11(3):203–8.
Franchini M, Lippi G, Targher G. Hyperthyroidism and venous thrombosis: a casual or causal association? A systematic literature review. Clin Appl Thromb Hemost. 2011;17(4):387–92.
Fandler-Höfler S, Pilz S, Ertler M, et al. Thyroid dysfunction in cerebral venous thrombosis: a retrospective cohort study. J Neurol. 2022;269(4):2016–21.
Krieg VJ, Hobohm L, Liebetrau C, et al. Risk factors for chronic thromboembolic pulmonary hypertension—importance of thyroid disease and function. Thromb Res. 2020;185:20–6.
Alsaidan AA, Alruwiali F. Association between hyperthyroidism and thromboembolism: a retrospective observational study. Ann Afr Med. 2023;22(2):183–8.
Walker AJ, Card TR, West J, Crooks C, Grainge MJ. Incidence of venous thromboembolism in patients with cancer—a cohort study using linked United Kingdom databases. Eur J Cancer. 2013;49(6):1404–13.
Ordookhani A, Motazedi A, Burman KD. Thrombosis in thyroid cancer. Int J Endocrinol Metab. 2017;16(1): e57897.
Ziaka M, Exadaktylos A. Insights into SARS-CoV-2-associated subacute thyroiditis: from infection to vaccine. Virol J. 2023;20(1):132.
Henke K, Odermatt J, Ziaka M, Rudovich N. Subacute thyroiditis complicating COVID-19 infection. Clin Med Insights Case Rep. 2023;16:11795476231181560.
Mondal S, DasGupta R, Lodh M, Ganguly A. Subacute thyroiditis following recovery from COVID-19 infection: novel clinical findings from an Eastern Indian cohort. Postgrad Med J. 2023;99(1172):558–65.
Nham E, Song E, Hyun H, et al. Concurrent subacute thyroiditis and graves’ disease after COVID-19: a case report. J Korean Med Sci. 2023;38(18): e134.
Mouna E, Molka BB, Sawssan BT, et al. Cardiothyreosis: epidemiological, clinical and therapeutic approach. Clin Med Insights Cardiol. 2023;17:11795468231152042.
Maung AC, Cheong MA, Chua YY, Gardner DS. When a storm showers the blood clots: a case of thyroid storm with systemic thromboembolism. Endocrinol Diabetes Metab Case Rep. 2021;2021:20–0118.
Download references
Not applicable.
Author information
Lifeng Zhang and Kaibei Li have contributed equally to this work and share the first authorship.
Authors and Affiliations
Department of Vascular Surgery, Hospital of Chengdu University of Traditional Chinese Medicine, No. 39, Shierqiao Road, Jinniu District, Chengdu, 610072, Sichuan, People’s Republic of China
Lifeng Zhang, Qifan Yang, Yao Lin, Caijuan Geng, Wei Huang & Wei Zeng
Disinfection Supply Center, Hospital of Chengdu University of Traditional Chinese Medicine, No. 39, Shierqiao Road, Jin Niu District, Chengdu, 610072, Sichuan, People’s Republic of China
You can also search for this author in PubMed Google Scholar
Contributions
Conception and design: LFZ and WZ. Analysis and interpretation: LFZ, KBL and WZ. Data collection: LFZ, QFY, YL, CJG and WH. Writing the article: LFZ, KBL. Critical revision of the article: LFZ, GFY and WZ. Final approval of the article: LFZ, KBL, YL, CJG, WH, QFY and WZ. Statistical analysis: YL, QFY.
Corresponding author
Correspondence to Wei Zeng .
Ethics declarations
Ethics approval and consent to participate.
Ethical approval was obtained in all original studies. This study complies with the terms of use of the database.
Competing interests
Additional information, publisher's note.
Springer Nature remains neutral with regard to jurisdictional claims in published maps and institutional affiliations.
Supplementary Information
Additional file 1., rights and permissions.
Open Access This article is licensed under a Creative Commons Attribution 4.0 International License, which permits use, sharing, adaptation, distribution and reproduction in any medium or format, as long as you give appropriate credit to the original author(s) and the source, provide a link to the Creative Commons licence, and indicate if changes were made. The images or other third party material in this article are included in the article's Creative Commons licence, unless indicated otherwise in a credit line to the material. If material is not included in the article's Creative Commons licence and your intended use is not permitted by statutory regulation or exceeds the permitted use, you will need to obtain permission directly from the copyright holder. To view a copy of this licence, visit http://creativecommons.org/licenses/by/4.0/ . The Creative Commons Public Domain Dedication waiver ( http://creativecommons.org/publicdomain/zero/1.0/ ) applies to the data made available in this article, unless otherwise stated in a credit line to the data.
Reprints and permissions
About this article
Cite this article.
Zhang, L., Li, K., Yang, Q. et al. Associations between deep venous thrombosis and thyroid diseases: a two-sample bidirectional Mendelian randomization study. Eur J Med Res 29 , 327 (2024). https://doi.org/10.1186/s40001-024-01933-1
Download citation
Received : 12 September 2023
Accepted : 09 June 2024
Published : 14 June 2024
DOI : https://doi.org/10.1186/s40001-024-01933-1
Share this article
Anyone you share the following link with will be able to read this content:
Sorry, a shareable link is not currently available for this article.
Provided by the Springer Nature SharedIt content-sharing initiative
- Deep venous thrombosis
- Thyroid diseases
- Mendelian randomization analysis
European Journal of Medical Research
ISSN: 2047-783X
- Submission enquiries: [email protected]
- General enquiries: [email protected]
Home — Essay Samples — Science — Observation — Examples Of Narrative Observation
Examples of Narrative Observation
- Categories: Observation
About this sample

Words: 561 |
Published: Jun 13, 2024
Words: 561 | Page: 1 | 3 min read
Table of contents
Introduction, body paragraph.

Cite this Essay
Let us write you an essay from scratch
- 450+ experts on 30 subjects ready to help
- Custom essay delivered in as few as 3 hours
Get high-quality help

Prof Ernest (PhD)
Verified writer
- Expert in: Science

+ 120 experts online
By clicking “Check Writers’ Offers”, you agree to our terms of service and privacy policy . We’ll occasionally send you promo and account related email
No need to pay just yet!
Related Essays
2 pages / 892 words
4 pages / 1722 words
1 pages / 663 words
4 pages / 2102 words
Remember! This is just a sample.
You can get your custom paper by one of our expert writers.
121 writers online
Still can’t find what you need?
Browse our vast selection of original essay samples, each expertly formatted and styled
Related Essays on Observation
Field placement is an integral part of many academic and professional programs, offering students the opportunity to gain practical experience in their chosen fields. Observing and documenting these experiences through essays [...]
Understanding human behavior is a complex and fascinating endeavor. One of the most effective methods for gaining insights into how people behave in their natural environments is through naturalistic observation. In this essay, [...]
Special education classrooms are designed to meet the unique needs of students with disabilities. These classrooms often have a different structure and focus compared to general education classrooms. Observing a special [...]
The halls of justice are often romanticized in popular culture, portrayed as arenas of dramatic revelations, eloquent arguments, and moral victories. However, a real-life observation of court proceedings offers a more nuanced [...]
Play is important for children, there are plenty of reason why play is an important thing for children such as learning how to socialize, learning their cognitive, exploring their imagination and much more from just simply [...]
Many schools around the world is based on students receiving homework and tests to further their knowledge to be successful. Why do that, if students will be more engaged and learn better with project-based learning. [...]
Related Topics
By clicking “Send”, you agree to our Terms of service and Privacy statement . We will occasionally send you account related emails.
Where do you want us to send this sample?
By clicking “Continue”, you agree to our terms of service and privacy policy.
Be careful. This essay is not unique
This essay was donated by a student and is likely to have been used and submitted before
Download this Sample
Free samples may contain mistakes and not unique parts
Sorry, we could not paraphrase this essay. Our professional writers can rewrite it and get you a unique paper.
Please check your inbox.
We can write you a custom essay that will follow your exact instructions and meet the deadlines. Let's fix your grades together!
Get Your Personalized Essay in 3 Hours or Less!
We use cookies to personalyze your web-site experience. By continuing we’ll assume you board with our cookie policy .
- Instructions Followed To The Letter
- Deadlines Met At Every Stage
- Unique And Plagiarism Free
IMAGES
VIDEO
COMMENTS
An observational study is used to answer a research question based purely on what the researcher observes. There is no interference or manipulation of the research subjects, and no control and treatment groups. These studies are often qualitative in nature and can be used for both exploratory and explanatory research purposes.
This kind of observational research can result in substantial profits. 5. Spying on Farms. Similar to the example above, observational research can also be implemented to study agriculture and farming. By using infrared imaging software from satellites, some companies can observe crops across the globe.
What is an Observational Study? An observational study uses sample data to find correlations in situations where the researchers do not control the treatment, or independent variable, that relates to the primary research question. The definition of an observational study hinges on the notion that the researchers only observe subjects and do not assign them to the control and treatment groups.
There are seven types of observational studies. Researchers might choose to use one type of observational study or combine any of these multiple observational study approaches: 1. Cross-sectional studies. Cross-sectional studies happen when researchers observe their chosen subject at one particular point in time.
The main types of observational studies used in health research, their purpose and main strengths and limitations are shown in the Table.2-8. Table. Summary of observational studies used in health research ... Multiple risk factors can be studied, but each case-control study can involve only one outcome.5 One example explored the relationship ...
Observational Research Examples. Here are some real-time observational research examples: ... For example, an observational study of shoppers in a grocery store might reveal that women are more likely than men to buy organic produce. This type of information can be useful for marketers or policy-makers who want to understand consumer ...
The observational design is subdivided into descriptive, including cross-sectional, case report or case series, and correlational, and analytic which includes cross-section, case-control, and cohort studies. Each research design has its uses and points of strength and limitations. The aim of this article to provide a simplified approach for the ...
Observational research is a broad term for various non-experimental studies in which behavior is carefully watched and recorded. The goal of this research is to describe a variable or a set of variables. More broadly, the goal is to capture specific individual, group, or setting characteristics. Since it is non-experimental and uncontrolled, we ...
For example, observational studies in market research might seek out information about the target market of a product or service by identifying the needs or problems of prospective consumers. In medical contexts, observers might be interested in how patients cope with a particular medical treatment or interact with doctors and nurses under ...
The term observational research is used to refer to several different types of non-experimental studies in which behavior is systematically observed and recorded. The goal of observational research is to describe a variable or set of variables. More generally, the goal is to obtain a snapshot of specific characteristics of an individual, group ...
In general, conducting observational research is relatively inexpensive, but it remains highly time-consuming and resource-intensive in data processing and analysis. ... For example, Mary Ainsworth used a behavior schedule to study how infants responded to brief periods of separation from their mothers. During the Strange Situation procedure ...
There are different types of observational studies. Two examples include natural history and longitudinal studies. ... There are few risks to taking part in an observational research study. One possible risk is the accidental release of information from your health records. To prevent this from happening, there are security measures in place to ...
Observational studies can be prospective or retrospective studies.On the other hand, randomized experiments must be prospective studies.. The choice between an observational study vs experiment hinges on your research objectives, the context in which you're working, available time and resources, and your ability to assign subjects to the experimental groups and control other variables.
Actually, the term is "Sample Survey" and you may search online for it. I think the difference lies in the aim of the three types of studies, sample surveys want to get data for a parameter while observational studies and experiments want to convert some data into information, i.e., correlation and causation respectively.
The term observational research is used to refer to several different types of non-experimental studies in which behavior is systematically observed and recorded. The goal of observational research is to describe a variable or set of variables. More generally, the goal is to obtain a snapshot of specific characteristics of an individual, group ...
Cohort studies and case studies are considered observational in design, whereas the randomized controlled trial would be an experimental study. Let's take a closer look at the different types of observational study design. The 3 types of Observational Studies. The different types of observational studies are used for different reasons.
observational study designs are possible but that they entail many potential pitfalls; • Describes the major threats to the integrity of observational research results such as threats to validity, reliability, statistical inference and generalizability; • Outlines some ways to improve each step in the research process, including choosing
Observation in qualitative research "is one of the oldest and most fundamental research methods approaches. This approach involves collecting data using one's senses, especially looking and listening in a systematic and meaningful way" (McKechnie, 2008, p. 573).Similarly, Adler and Adler (1994) characterized observations as the "fundamental base of all research methods" in the social ...
Qualitative observation is a type of observational study, often used in conjunction with other types of research through triangulation. It is often used in fields like social sciences, education, healthcare, marketing, and design. This type of study is especially well suited for gaining rich and detailed insights into complex and/or subjective ...
Observational research studies involve the passive observation of subjects without any intervention or manipulation by researchers. These studies are designed to scrutinize the relationships between variables and test subjects, uncover patterns, and draw conclusions grounded in real-world data. Researchers refrain from interfering with the ...
Qualitative observation is a method of collecting data that involves describing the attributes and properties of a phenomenon or subject through the senses, rather than using numerical measurements. This type of observation is most beneficial for studies designed to provide in-depth, detailed, nuanced, and contextualized case studies.
Although good agreement between clinical trials and observational research occurs often, the example of the WHI prevents having complete confidence in the results of observational studies. Table 2 Comparison of baseline characteristics and outcomes in the randomized controlled trial and observational study of estrogen-progestin treatment in the ...
Observational research examples. The first study we describe in this blog post explores how familiarity influences the use of electronic devices in different age groups. In the second study, researchers compared different methods of observing pain expressions in dementia patients. Example 1: Familiarity and intuitive use
Observational Studies. In an observational study, the investigator simply records observations and analyzes data, without assigning participants to a specific intervention or treatment. These studies may focus on observation of risk factors, natural history, variations in disease progression or disease treatment without delivering or assigning ...
Science is a systematic and logical approach to discovering how things in the universe work. Scientists use the scientific method to make observations, form hypotheses and gather evidence in an ...
In 2014, Girman et al. provided a clear set of steps for assessing study feasibility including examination of the appropriateness of the data for the research question (i.e., 'fit-for-purpose'), empirical equipoise, and interpretability, stating that comparative effectiveness research using observational data "should be designed with the ...
As such, comparisons of the results from one study design (for example, observational studies, assessing self-reported cannabis use in recreational users 22,23) with another study design (for ...
The sample for this research came from 260 dry jaws, showing the following findings from the total jaws studied, and to classify as an accessory MF, it will be examined and measured so that it complies with what is declared in the literature as the presence of AMF, which is between 0.74 mm. and 0.89 mm. ... In this descriptive observational ...
Background Some previous observational studies have linked deep venous thrombosis (DVT) to thyroid diseases; however, the findings were contradictory. This study aimed to investigate whether some common thyroid diseases can cause DVT using a two-sample Mendelian randomization (MR) approach. Methods This two-sample MR study used single nucleotide polymorphisms (SNPs) identified by the FinnGen ...
By providing a holistic view, narrative observation complements other research methods and contributes to a deeper understanding of the studied phenomena. As demonstrated through the examples discussed, narrative observation is an essential tool for researchers seeking to explore the intricacies of human behavior and social dynamics.