
Chapter 18. Data Analysis and Coding
Introduction.
Piled before you lie hundreds of pages of fieldnotes you have taken, observations you’ve made while volunteering at city hall. You also have transcripts of interviews you have conducted with the mayor and city council members. What do you do with all this data? How can you use it to answer your original research question (e.g., “How do political polarization and party membership affect local politics?”)? Before you can make sense of your data, you will have to organize and simplify it in a way that allows you to access it more deeply and thoroughly. We call this process coding . [1] Coding is the iterative process of assigning meaning to the data you have collected in order to both simplify and identify patterns. This chapter introduces you to the process of qualitative data analysis and the basic concept of coding, while the following chapter (chapter 19) will take you further into the various kinds of codes and how to use them effectively.
To those who have not yet conducted a qualitative study, the sheer amount of collected data will be a surprise. Qualitative data can be absolutely overwhelming—it may mean hundreds if not thousands of pages of interview transcripts, or fieldnotes, or retrieved documents. How do you make sense of it? Students often want very clear guidelines here, and although I try to accommodate them as much as possible, in the end, analyzing qualitative data is a bit more of an art than a science: “The process of bringing order, structure, and interpretation to a mass of collected data is messy, ambiguous, time-consuming, creative, and fascinating. It does not proceed in a linear fashion: it is not neat. At times, the researcher may feel like an eccentric and tormented artist; not to worry, this is normal” ( Marshall and Rossman 2016:214 ).
To complicate matters further, each approach (e.g., Grounded Theory, deep ethnography, phenomenology) has its own language and bag of tricks (techniques) when it comes to analysis. Grounded Theory, for example, uses in vivo coding to generate new theoretical insights that emerge from a rigorous but open approach to data analysis. Ethnographers, in contrast, are more focused on creating a rich description of the practices, behaviors, and beliefs that operate in a particular field. They are less interested in generating theory and more interested in getting the picture right, valuing verisimilitude in the presentation. And then there are some researchers who seek to account for the qualitative data using almost quantitative methods of analysis, perhaps counting and comparing the uses of certain narrative frames in media accounts of a phenomenon. Qualitative content analysis (QCA) often includes elements of counting (see chapter 17). For these researchers, having very clear hypotheses and clearly defined “variables” before beginning analysis is standard practice, whereas the same would be expressly forbidden by those researchers, like grounded theorists, taking a more emergent approach.
All that said, there are some helpful techniques to get you started, and these will be presented in this and the following chapter. As you become more of an expert yourself, you may want to read more deeply about the tradition that speaks to your research. But know that there are many excellent qualitative researchers that use what works for any given study, who take what they can from each tradition. Most of us find this permissible (but watch out for the methodological purists that exist among us).

Qualitative Data Analysis as a Long Process!
Although most of this and the following chapter will focus on coding, it is important to understand that coding is just one (very important) aspect of the long data-analysis process. We can consider seven phases of data analysis, each of which is important for moving your voluminous data into “findings” that can be reported to others. The first phase involves data organization. This might mean creating a special password-protected Dropbox folder for storing your digital files. It might mean acquiring computer-assisted qualitative data-analysis software ( CAQDAS ) and uploading all transcripts, fieldnotes, and digital files to its storage repository for eventual coding and analysis. Finding a helpful way to store your material can take a lot of time, and you need to be smart about this from the very beginning. Losing data because of poor filing systems or mislabeling is something you want to avoid. You will also want to ensure that you have procedures in place to protect the confidentiality of your interviewees and informants. Filing signed consent forms (with names) separately from transcripts and linking them through an ID number or other code that only you have access to (and store safely) are important.
Once you have all of your material safely and conveniently stored, you will need to immerse yourself in the data. The second phase consists of reading and rereading or viewing and reviewing all of your data. As you do this, you can begin to identify themes or patterns in the data, perhaps writing short memos to yourself about what you are seeing. You are not committing to anything in this third phase but rather keeping your eyes and mind open to what you see. In an actual study, you may very well still be “in the field” or collecting interviews as you do this, and what you see might push you toward either concluding your data collection or expanding so that you can follow a particular group or factor that is emerging as important. For example, you may have interviewed twelve international college students about how they are adjusting to life in the US but realized as you read your transcripts that important gender differences may exist and you have only interviewed two women (and ten men). So you go back out and make sure you have enough female respondents to check your impression that gender matters here. The seven phases do not proceed entirely linearly! It is best to think of them as recursive; conceptually, there is a path to follow, but it meanders and flows.
Coding is the activity of the fourth phase . The second part of this chapter and all of chapter 19 will focus on coding in greater detail. For now, know that coding is the primary tool for analyzing qualitative data and that its purpose is to both simplify and highlight the important elements buried in mounds of data. Coding is a rigorous and systematic process of identifying meaning, patterns, and relationships. It is a more formal extension of what you, as a conscious human being, are trained to do every day when confronting new material and experiences. The “trick” or skill is to learn how to take what you do naturally and semiconsciously in your mind and put it down on paper so it can be documented and verified and tested and refined.
At the conclusion of the coding phase, your material will be searchable, intelligible, and ready for deeper analysis. You can begin to offer interpretations based on all the work you have done so far. This fifth phase might require you to write analytic memos, beginning with short (perhaps a paragraph or two) interpretations of various aspects of the data. You might then attempt stitching together both reflective and analytical memos into longer (up to five pages) general interpretations or theories about the relationships, activities, patterns you have noted as salient.
As you do this, you may be rereading the data, or parts of the data, and reviewing your codes. It’s possible you get to this phase and decide you need to go back to the beginning. Maybe your entire research question or focus has shifted based on what you are now thinking is important. Again, the process is recursive , not linear. The sixth phase requires you to check the interpretations you have generated. Are you really seeing this relationship, or are you ignoring something important you forgot to code? As we don’t have statistical tests to check the validity of our findings as quantitative researchers do, we need to incorporate self-checks on our interpretations. Ask yourself what evidence would exist to counter your interpretation and then actively look for that evidence. Later on, if someone asks you how you know you are correct in believing your interpretation, you will be able to explain what you did to verify this. Guard yourself against accusations of “ cherry-picking ,” selecting only the data that supports your preexisting notion or expectation about what you will find. [2]
The seventh and final phase involves writing up the results of the study. Qualitative results can be written in a variety of ways for various audiences (see chapter 20). Due to the particularities of qualitative research, findings do not exist independently of their being written down. This is different for quantitative research or experimental research, where completed analyses can somewhat speak for themselves. A box of collected qualitative data remains a box of collected qualitative data without its written interpretation. Qualitative research is often evaluated on the strength of its presentation. Some traditions of qualitative inquiry, such as deep ethnography, depend on written thick descriptions, without which the research is wholly incomplete, even nonexistent. All of that practice journaling and writing memos (reflective and analytical) help develop writing skills integral to the presentation of the findings.
Remember that these are seven conceptual phases that operate in roughly this order but with a lot of meandering and recursivity throughout the process. This is very different from quantitative data analysis, which is conducted fairly linearly and processually (first you state a falsifiable research question with hypotheses, then you collect your data or acquire your data set, then you analyze the data, etc.). Things are a bit messier when conducting qualitative research. Embrace the chaos and confusion, and sort your way through the maze. Budget a lot of time for this process. Your research question might change in the middle of data collection. Don’t worry about that. The key to being nimble and flexible in qualitative research is to start thinking and continue thinking about your data, even as it is being collected. All seven phases can be started before all the data has been gathered. Data collection does not always precede data analysis. In some ways, “qualitative data collection is qualitative data analysis.… By integrating data collection and data analysis, instead of breaking them up into two distinct steps, we both enrich our insights and stave off anxiety. We all know the anxiety that builds when we put something off—the longer we put it off, the more anxious we get. If we treat data collection as this mass of work we must do before we can get started on the even bigger mass of work that is analysis, we set ourselves up for massive anxiety” ( Rubin 2021:182–183 ; emphasis added).
The Coding Stage
A code is “a word or short phrase that symbolically assigns a summative, salient, essence-capturing, and/or evocative attribute for a portion of language-based or visual data” ( Saldaña 2014:5 ). Codes can be applied to particular sections of or entire transcripts, documents, or even videos. For example, one might code a video taken of a preschooler trying to solve a puzzle as “puzzle,” or one could take the transcript of that video and highlight particular sections or portions as “arranging puzzle pieces” (a descriptive code) or “frustration” (a summative emotion-based code). If the preschooler happily shouts out, “I see it!” you can denote the code “I see it!” (this is an example of an in vivo, participant-created code). As one can see from even this short example, there are many different kinds of codes and many different strategies and techniques for coding, more of which will be discussed in detail in chapter 19. The point to remember is that coding is a rigorous systematic process—to some extent, you are always coding whenever you look at a person or try to make sense of a situation or event, but you rarely do this consciously. Coding is the process of naming what you are seeing and how you are simplifying the data so that you can make sense of it in a way that is consistent with your study and in a way that others can understand and follow and replicate. Another way of saying this is that a code is “a researcher-generated interpretation that symbolizes or translates data” ( Vogt et al. 2014:13 ).
As with qualitative data analysis generally, coding is often done recursively, meaning that you do not merely take one pass through the data to create your codes. Saldaña ( 2014 ) differentiates first-cycle coding from second-cycle coding. The goal of first-cycle coding is to “tag” or identify what emerges as important codes. Note that I said emerges—you don’t always know from the beginning what will be an important aspect of the study or not, so the coding process is really the place for you to begin making the kinds of notes necessary for future analyses. In second-cycle coding, you will want to be much more focused—no longer gathering wholly new codes but synthesizing what you have into metacodes.
You might also conceive of the coding process in four parts (figure 18.1). First, identify a representative or diverse sample set of interview transcripts (or fieldnotes or other documents). This is the group you are going to use to get a sense of what might be emerging. In my own study of career obstacles to success among first-generation and working-class persons in sociology, I might select one interview from each career stage: a graduate student, a junior faculty member, a senior faculty member.
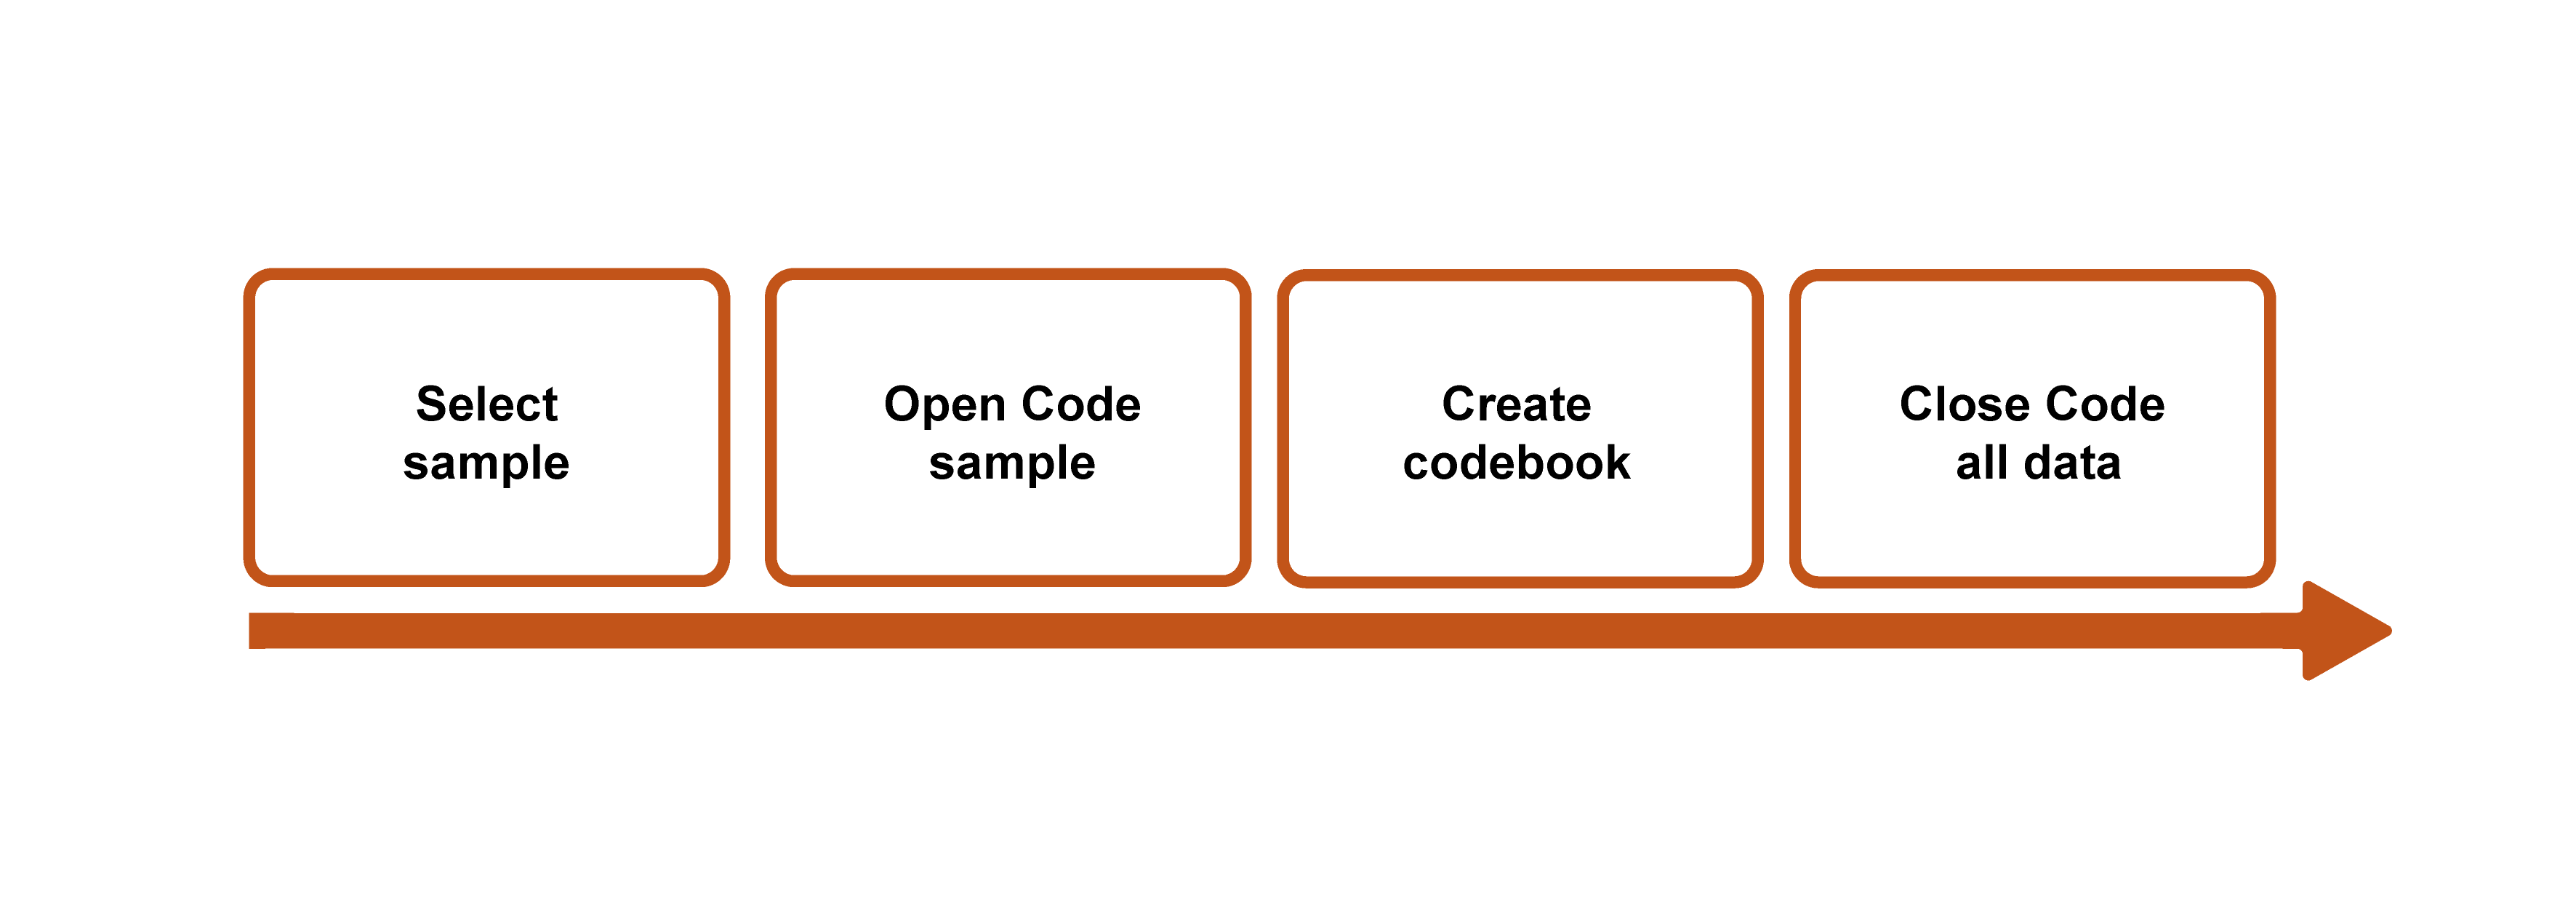
Second, code everything (“ open coding ”). See what emerges, and don’t limit yourself in any way. You will end up with a ton of codes, many more than you will end up with, but this is an excellent way to not foreclose an interesting finding too early in the analysis. Note the importance of starting with a sample of your collected data, because otherwise, open coding all your data is, frankly, impossible and counterproductive. You will just get stuck in the weeds.
Third, pare down your coding list. Where you may have begun with fifty (or more!) codes, you probably want no more than twenty remaining. Go back through the weeds and pull out everything that does not have the potential to bloom into a nicely shaped garden. Note that you should do this before tackling all of your data . Sometimes, however, you might need to rethink the sample you chose. Let’s say that the graduate student interview brought up some interesting gender issues that were pertinent to female-identifying sociologists, but both the junior and the senior faculty members identified as male. In that case, I might read through and open code at least one other interview transcript, perhaps a female-identifying senior faculty member, before paring down my list of codes.
This is also the time to create a codebook if you are using one, a master guide to the codes you are using, including examples (see Sample Codebooks 1 and 2 ). A codebook is simply a document that lists and describes the codes you are using. It is easy to forget what you meant the first time you penciled a coded notation next to a passage, so the codebook allows you to be clear and consistent with the use of your codes. There is not one correct way to create a codebook, but generally speaking, the codebook should include (1) the code (either name or identification number or both), (2) a description of what the code signifies and when and where it should be applied, and (3) an example of the code to help clarify (2). Listing all the codes down somewhere also allows you to organize and reorganize them, which can be part of the analytical process. It is possible that your twenty remaining codes can be neatly organized into five to seven master “themes.” Codebooks can and should develop as you recursively read through and code your collected material. [3]
Fourth, using the pared-down list of codes (or codebook), read through and code all the data. I know many qualitative researchers who work without a codebook, but it is still a good practice, especially for beginners. At the very least, read through your list of codes before you begin this “ closed coding ” step so that you can minimize the chance of missing a passage or section that needs to be coded. The final step is…to do it all again. Or, at least, do closed coding (step four) again. All of this takes a great deal of time, and you should plan accordingly.
Researcher Note
People often say that qualitative research takes a lot of time. Some say this because qualitative researchers often collect their own data. This part can be time consuming, but to me, it’s the analytical process that takes the most time. I usually read every transcript twice before starting to code, then it usually takes me six rounds of coding until I’m satisfied I’ve thoroughly coded everything. Even after the coding, it usually takes me a year to figure out how to put the analysis together into a coherent argument and to figure out what language to use. Just deciding what name to use for a particular group or idea can take months. Understanding this going in can be helpful so that you know to be patient with yourself.
—Jessi Streib, author of The Power of the Past and Privilege Lost
Note that there is no magic in any of this, nor is there any single “right” way to code or any “correct” codes. What you see in the data will be prompted by your position as a researcher and your scholarly interests. Where the above codes on a preschooler solving a puzzle emerged from my own interest in puzzle solving, another researcher might focus on something wholly different. A scholar of linguistics, for example, may focus instead on the verbalizations made by the child during the discovery process, perhaps even noting particular vocalizations (incidence of grrrs and gritting of the teeth, for example). Your recording of the codes you used is the important part, as it allows other researchers to assess the reliability and validity of your analyses based on those codes. Chapter 19 will provide more details about the kinds of codes you might develop.
Saldaña ( 2014 ) lists seven “necessary personal attributes” for successful coding. To paraphrase, they are the following:
- Having (or practicing) good organizational skills
- Perseverance
- The ability and willingness to deal with ambiguity
- Flexibility
- Creativity, broadly understood, which includes “the ability to think visually, to think symbolically, to think in metaphors, and to think of as many ways as possible to approach a problem” (20)
- Commitment to being rigorously ethical
- Having an extensive vocabulary [4]
Writing Analytic Memos during/after Coding
Coding the data you have collected is only one aspect of analyzing it. Too many beginners have coded their data and then wondered what to do next. Coding is meant to help organize your data so that you can see it more clearly, but it is not itself an analysis. Thinking about the data, reviewing the coded data, and bringing in the previous literature (here is where you use your literature review and theory) to help make sense of what you have collected are all important aspects of data analysis. Analytic memos are notes you write to yourself about the data. They can be short (a single page or even a paragraph) or long (several pages). These memos can themselves be the subject of subsequent analytic memoing as part of the recursive process that is qualitative data analysis.
Short analytic memos are written about impressions you have about the data, what is emerging, and what might be of interest later on. You can write a short memo about a particular code, for example, and why this code seems important and where it might connect to previous literature. For example, I might write a paragraph about a “cultural capital” code that I use whenever a working-class sociologist says anything about “not fitting in” with their peers (e.g., not having the right accent or hairstyle or private school background). I could then write a little bit about Bourdieu, who originated the notion of cultural capital, and try to make some connections between his definition and how I am applying it here. I can also use the memo to raise questions or doubts I have about what I am seeing (e.g., Maybe the type of school belongs somewhere else? Is this really the right code?). Later on, I can incorporate some of this writing into the theory section of my final paper or article. Here are some types of things that might form the basis of a short memo: something you want to remember, something you noticed that was new or different, a reaction you had, a suspicion or hunch that you are developing, a pattern you are noticing, any inferences you are starting to draw. Rubin ( 2021 ) advises, “Always include some quotation or excerpt from your dataset…that set you off on this idea. It’s happened to me so many times—I’ll have a really strong reaction to a piece of data, write down some insight without the original quotation or context, and then [later] have no idea what I was talking about and have no way of recreating my insight because I can’t remember what piece of data made me think this way” ( 203 ).
All CAQDAS programs include spaces for writing, generating, and storing memos. You can link a memo to a particular transcript, for example. But you can just as easily keep a notebook at hand in which you write notes to yourself, if you prefer the more tactile approach. Drawing pictures that illustrate themes and patterns you are beginning to see also works. The point is to write early and write often, as these memos are the building blocks of your eventual final product (chapter 20).
In the next chapter (chapter 19), we will go a little deeper into codes and how to use them to identify patterns and themes in your data. This chapter has given you an idea of the process of data analysis, but there is much yet to learn about the elements of that process!
Qualitative Data-Analysis Samples
The following three passages are examples of how qualitative researchers describe their data-analysis practices. The first, by Harvey, is a useful example of how data analysis can shift the original research questions. The second example, by Thai, shows multiple stages of coding and how these stages build upward to conceptual themes and theorization. The third example, by Lamont, shows a masterful use of a variety of techniques to generate theory.
Example 1: “Look Someone in the Eye” by Peter Francis Harvey ( 2022 )
I entered the field intending to study gender socialization. However, through the iterative process of writing fieldnotes, rereading them, conducting further research, and writing extensive analytic memos, my focus shifted. Abductive analysis encourages the search for unexpected findings in light of existing literature. In my early data collection, fieldnotes, and memoing, classed comportment was unmistakably prominent in both schools. I was surprised by how pervasive this bodily socialization proved to be and further surprised by the discrepancies between the two schools.…I returned to the literature to compare my empirical findings.…To further clarify patterns within my data and to aid the search for disconfirming evidence, I constructed data matrices (Miles, Huberman, and Saldaña 2013). While rereading my fieldnotes, I used ATLAS.ti to code and recode key sections (Miles et al. 2013), punctuating this process with additional analytic memos. ( 2022:1420 )
Example 2:” Policing and Symbolic Control” by Mai Thai ( 2022 )
Conventional to qualitative research, my analyses iterated between theory development and testing. Analytical memos were written throughout the data collection, and my analyses using MAXQDA software helped me develop, confirm, and challenge specific themes.…My early coding scheme which included descriptive codes (e.g., uniform inspection, college trips) and verbatim codes of the common terms used by field site participants (e.g., “never quit,” “ghetto”) led me to conceptualize valorization. Later analyses developed into thematic codes (e.g., good citizens, criminality) and process codes (e.g., valorization, criminalization), which helped refine my arguments. ( 2022:1191–1192 )
Example 3: The Dignity of Working Men by Michèle Lamont ( 2000 )
To analyze the interviews, I summarized them in a 13-page document including socio-demographic information as well as information on the boundary work of the interviewees. To facilitate comparisons, I noted some of the respondents’ answers on grids and summarized these on matrix displays using techniques suggested by Miles and Huberman for standardizing and processing qualitative data. Interviews were also analyzed one by one, with a focus on the criteria that each respondent mobilized for the evaluation of status. Moreover, I located each interviewee on several five-point scales pertaining to the most significant dimensions they used to evaluate status. I also compared individual interviewees with respondents who were similar to and different from them, both within and across samples. Finally, I classified all the transcripts thematically to perform a systematic analysis of all the important themes that appear in the interviews, approaching the latter as data against which theoretical questions can be explored. ( 2000:256–257 )
Sample Codebook 1
This is an abridged version of the codebook used to analyze qualitative responses to a question about how class affects careers in sociology. Note the use of numbers to organize the flow, supplemented by highlighting techniques (e.g., bolding) and subcoding numbers.
01. CAPS: Any reference to “capitals” in the response, even if the specific words are not used
01.1: cultural capital 01.2: social capital 01.3: economic capital
(can be mixed: “0.12”= both cultural and asocial capital; “0.23”= both social and economic)
01. CAPS: a reference to “capitals” in which the specific words are used [ bold : thus, 01.23 means that both social capital and economic capital were mentioned specifically
02. DEBT: discussion of debt
02.1: mentions personal issues around debt 02.2: discusses debt but in the abstract only (e.g., “people with debt have to worry”)
03. FirstP: how the response is positioned
03.1: neutral or abstract response 03.2: discusses self (“I”) 03.3: discusses others (“they”)
Sample Coded Passage:
| “I was really hurt when I didn’t get that scholarship. It was going to cost me thousands of dollars to stay in the program, and I was going to have to borrow all of it. My faculty advisor wasn’t helpful at all. They told | 03.2 |
| me not to worry about it, because it wasn’t really that much money! I almost fell over when they said that! Like, do they not understand what it’s like to be poor? I just felt so isolated then. I was on my own. | 02.1. 01.3 |
| I couldn’t talk to anyone about it, because no one else seemed to worry about it. Talk about economic capital!” |
* Question: What other codes jump out to you here? Shouldn’t there be a code for feelings of loneliness or alienation? What about an emotions code ?
Sample Codebook 2
| CODE | DEFINITION | WHEN TO APPLY | IN VIVO EXAMPLE |
|---|---|---|---|
| ALIENATION | Feeling out of place in academia | Any time uses the word alienation or impostor syndrome or feeling out of place | “I was so lonely in graduate school. It was an alienating experience.” |
| CULTURAL CAPITAL | Knowledge or other cultural resources that affect success in academia | When “cultural capital” is used but also when knowledge or lack of knowledge about cultural things are discussed | “We went to a fancy restaurant after my job interview and I was paralyzed with fear because I did not know which fork I was supposed to be using. Yikes!” |
| SOCIAL CAPITAL | Social networks that advance success in academia | When “social capital” is used but also when social networks are discussed or knowing the right people | “I didn’t know who to turn to. It seemed like everyone else had parents who could help them and I didn’t know anyone else who had ever even gone to college!” |
This is an example that uses "word" categories only, with descriptions and examples for each code
Further Readings
Elliott, Victoria. 2018. “Thinking about the Coding Process in Qualitative Analysis.” Qualitative Report 23(11):2850–2861. Address common questions those new to coding ask, including the use of “counting” and how to shore up reliability.
Friese, Susanne. 2019. Qualitative Data Analysis with ATLAS.ti. 3rd ed. A good guide to ATLAS.ti, arguably the most used CAQDAS program. Organized around a series of “skills training” to get you up to speed.
Jackson, Kristi, and Pat Bazeley. 2019. Qualitative Data Analysis with NVIVO . 3rd ed. Thousand Oaks, CA: SAGE. If you want to use the CAQDAS program NVivo, this is a good affordable guide to doing so. Includes copious examples, figures, and graphic displays.
LeCompte, Margaret D. 2000. “Analyzing Qualitative Data.” Theory into Practice 39(3):146–154. A very practical and readable guide to the entire coding process, with particular applicability to educational program evaluation/policy analysis.
Miles, Matthew B., and A. Michael Huberman. 1994. Qualitative Data Analysis: An Expanded Sourcebook . 2nd ed. Thousand Oaks, CA: SAGE. A classic reference on coding. May now be superseded by Miles, Huberman, and Saldaña (2019).
Miles, Matthew B., A. Michael Huberman, and Johnny Saldaña. 2019. Qualitative Data Analysis: A Methods Sourcebook . 4th ed. Thousand Oaks, CA; SAGE. A practical methods sourcebook for all qualitative researchers at all levels using visual displays and examples. Highly recommended.
Saldaña, Johnny. 2014. The Coding Manual for Qualitative Researchers . 2nd ed. Thousand Oaks, CA: SAGE. The most complete and comprehensive compendium of coding techniques out there. Essential reference.
Silver, Christina. 2014. Using Software in Qualitative Research: A Step-by-Step Guide. 2nd ed. Thousand Oaks, CA; SAGE. If you are unsure which CAQDAS program you are interested in using or want to compare the features and usages of each, this guidebook is quite helpful.
Vogt, W. Paul, Elaine R. Vogt, Diane C. Gardner, and Lynne M. Haeffele2014. Selecting the Right Analyses for Your Data: Quantitative, Qualitative, and Mixed Methods . New York: The Guilford Press. User-friendly reference guide to all forms of analysis; may be particularly helpful for those engaged in mixed-methods research.
- When you have collected content (historical, media, archival) that interests you because of its communicative aspect, content analysis (chapter 17) is appropriate. Whereas content analysis is both a research method and a tool of analysis, coding is a tool of analysis that can be used for all kinds of data to address any number of questions. Content analysis itself includes coding. ↵
- Scientific research, whether quantitative or qualitative, demands we keep an open mind as we conduct our research, that we are “neutral” regarding what is actually there to find. Students who are trained in non-research-based disciplines such as the arts or philosophy or who are (admirably) focused on pursuing social justice can too easily fall into the trap of thinking their job is to “demonstrate” something through the data. That is not the job of a researcher. The job of a researcher is to present (and interpret) findings—things “out there” (even if inside other people’s hearts and minds). One helpful suggestion: when formulating your research question, if you already know the answer (or think you do), scrap that research. Ask a question to which you do not yet know the answer. ↵
- Codebooks are particularly useful for collaborative research so that codes are applied and interpreted similarly. If you are working with a team of researchers, you will want to take extra care that your codebooks remain in synch and that any refinements or developments are shared with fellow coders. You will also want to conduct an “intercoder reliability” check, testing whether the codes you have developed are clearly identifiable so that multiple coders are using them similarly. Messy, unclear codes that can be interpreted differently by different coders will make it much more difficult to identify patterns across the data. ↵
- Note that this is important for creating/denoting new codes. The vocabulary does not need to be in English or any particular language. You can use whatever words or phrases capture what it is you are seeing in the data. ↵
A first-cycle coding process in which gerunds are used to identify conceptual actions, often for the purpose of tracing change and development over time. Widely used in the Grounded Theory approach.
A first-cycle coding process in which terms or phrases used by the participants become the code applied to a particular passage. It is also known as “verbatim coding,” “indigenous coding,” “natural coding,” “emic coding,” and “inductive coding,” depending on the tradition of inquiry of the researcher. It is common in Grounded Theory approaches and has even given its name to one of the primary CAQDAS programs (“NVivo”).
Computer-assisted qualitative data-analysis software. These are software packages that can serve as a repository for qualitative data and that enable coding, memoing, and other tools of data analysis. See chapter 17 for particular recommendations.
The purposeful selection of some data to prove a preexisting expectation or desired point of the researcher where other data exists that would contradict the interpretation offered. Note that it is not cherry picking to select a quote that typifies the main finding of a study, although it would be cherry picking to select a quote that is atypical of a body of interviews and then present it as if it is typical.
A preliminary stage of coding in which the researcher notes particular aspects of interest in the data set and begins creating codes. Later stages of coding refine these preliminary codes. Note: in Grounded Theory , open coding has a more specific meaning and is often called initial coding : data are broken down into substantive codes in a line-by-line manner, and incidents are compared with one another for similarities and differences until the core category is found. See also closed coding .
A set of codes, definitions, and examples used as a guide to help analyze interview data. Codebooks are particularly helpful and necessary when research analysis is shared among members of a research team, as codebooks allow for standardization of shared meanings and code attributions.
The final stages of coding after the refinement of codes has created a complete list or codebook in which all the data is coded using this refined list or codebook. Compare to open coding .
A first-cycle coding process in which emotions and emotionally salient passages are tagged.
Introduction to Qualitative Research Methods Copyright © 2023 by Allison Hurst is licensed under a Creative Commons Attribution-ShareAlike 4.0 International License , except where otherwise noted.
University Library, University of Illinois at Urbana-Champaign

Qualitative Data Analysis: Coding
- Atlas.ti web
- R for text analysis
- Microsoft Excel & spreadsheets
- Other options
- Planning Qual Data Analysis
- Free Tools for QDA
- QDA with NVivo
- QDA with Atlas.ti
- QDA with MAXQDA
- PKM for QDA
- QDA with Quirkos
- Working Collaboratively
- Qualitative Methods Texts
- Transcription
- Data organization
- Example Publications
- Find Methods Examples
Coding Qualitative Data
Planning your coding strategy.
Coding is a qualitative data analysis strategy in which some aspect of the data is assigned a descriptive label that allows the researcher to identify related content across the data. How you decide to code - or whether to code- your data should be driven by your methodology. But there are rarely step-by-step descriptions, and you'll have to make many decisions about how to code for your own project.
Some questions to consider as you decide how to code your data:
What will you code?
What aspects of your data will you code? If you are not coding all of your available data, how will you decide which elements need to be coded? If you have recordings interviews or focus groups, or other types of multimedia data, will you create transcripts to analyze and code? Or will you code the media itself (see Farley, Duppong & Aitken, 2020 on direct coding of audio recordings rather than transcripts).
Where will your codes come from?
Depending on your methodology, your coding scheme may come from previous research and be applied to your data (deductive). Or you my try to develop codes entirely from the data, ignoring as much as possible, previous knowledge of the topic under study, to develop a scheme grounded in your data (inductive). In practice, however, many practices will fall between these two approaches.
How will you apply your codes to your data?
You may decide to use software to code your qualitative data, to re-purpose other software tools (e.g. Word or spreadsheet software) or work primarily with physical versions of your data. Qualitative software is not strictly necessary, though it does offer some advantages, like:
- Codes can be easily re-labeled, merged, or split. You can also choose to apply multiple coding schemes to the same data, which means you can explore multiple ways of understanding the same data. Your analysis, then, is not limited by how often you are able to work with physical data, such as paper transcripts.
- Most software programs for QDA include the ability to export and import coding schemes. This means you can create a re-use a coding scheme from a previous study, or that was developed in outside of the software, without having to manually create each code.
- Some software for QDA includes the ability to directly code image, video, and audio files. This may mean saving time over creating transcripts. Or, your coding may be enhanced by access to the richness of mediated content, compared to transcripts.
- Using QDA software may also allow you the ability to use auto-coding functions. You may be able to automatically code all of the statements by speaker in a focus group transcript, for example, or identify and code all of the paragraphs that include a specific phrase.
What will be coded?
Will you deploy a line-by-line coding approach, with smaller codes eventually condensed into larger categories or concepts? Or will you start with codes applied to larger segments of the text, perhaps later reviewing the examples to explore and re-code for differences between the segments?
How will you explain the coding process?
- Regardless of how you approach coding, the process should be clearly communicated when you report your research, though this is not always the case (Deterding & Waters, 2021).
- Carefully consider the use of phrases like "themes emerged." This phrasing implies that the themes lay passively in the data, waiting for the researcher to pluck them out. This description leaves little room for describing how the researcher "saw" the themes and decided which were relevant to the study. Ryan and Bernard (2003) offer a terrific guide to ways that you might identify themes in the data, using both your own observations as well as manipulations of the data.
How will you report the results of your coding process?
How you report your coding process should align with the methodology you've chosen. Your methodology may call for careful and consistent application of a coding scheme, with reports of inter-rater reliability and counts of how often a code appears within the data. Or you may use the codes to help develop a rich description of an experience, without needing to indicate precisely how often the code was applied.
How will you code collaboratively?
If you are working with another researcher or a team, your coding process requires careful planning and implementation. You will likely need to have regular conversations about your process, particularly if your goal is to develop and consistently apply a coding scheme across your data.
Coding Features in QDA Software Programs
- Atlas.ti (Mac)
- Atlas.ti (Windows)
- NVivo (Windows)
- NVivo (Mac)
- Coding data See how to create and manage codes and apply codes to segments of the data (known as quotations in Atlas.ti).
- Search and Code Using the search and code feature lets you locate and automatically code data through text search, regular expressions, Named Entity Recognition, and Sentiment Analysis.
- Focus Group Coding Properly prepared focus group documents can be automatically coded by speaker.
- Inter-Coder Agreement Coded text, audio, and video documents can be tested for inter-coder agreement. ICA is not available for images or PDF documents.
- Quotation Reader Once you've coded data, you can view just the data that has been assigned that code.
- Find Redundant Codings (Mac) This tool identifies "overlapping or embedded" quotations that have the same code, that are the result of manual coding or errors when merging project files.
- Coding Data in Atlas.ti (Windows) Demonstrates how to create new codes, manage codes and applying codes to segments of the data (known as quotations in Atlas.ti)
- Search and Code in Atlas.ti (Windows) You can use a text search, regular expressions, Named Entity Recognition, and Sentiment Analysis to identify and automatically code data in Atlas.ti.
- Focus Group Coding in Atlas.ti (Windows) Properly prepared focus group transcripts can be automatically coded by speaker.
- Inter-coder Agreement in Atlas.ti (Windows) Coded text, audio, and video documents can be tested for inter-coder agreement. ICA is not available for images or PDF documents.
- Quotation Reader in Atlas.ti (Windows) Once you've coded data, you can view and export the quotations that have been assigned that code.
- Find Redundant Codings in Atlas.ti (Windows) This tool identifies "overlapping or embedded" quotations that have the same code, that are the result of manual coding or errors when merging project files.
- Coding in NVivo (Windows) This page includes an overview of the coding features in NVivo.
- Automatic Coding in Documents in NVivo (Windows) You can use paragraph formatting styles or speaker names to automatically format documents.
- Coding Comparison Query in NVivo (Windows) You can use the coding comparison feature to compare how different users have coded data in NVivo.
- Review the References in a Node in NVivo (Windows) References are the term that NVivo uses for coded segments of the data. This shows you how to view references related to a code (or any node)
- Text Search Queries in NVivo (Windows) Text queries let you search for specific text in your data. The results of your query can be saved as a node (a form of auto coding).
- Coding Query in NVivo (Windows) Use a coding query to display references from your data for a single code or multiples of codes.
- Code Files and Manage Codes in NVivo (Mac) This page offers an overview of coding features in NVivo. Note that NVivo uses the concept of a node to refer to any structure around which you organize your data. Codes are a type of node, but you may see these terms used interchangeably.
- Automatic Coding in Datasets in NVivo (Mac) A dataset in NVivo is data that is in rows and columns, as in a spreadsheet. If a column is set to be codable, you can also automatically code the data. This approach could be used for coding open-ended survey data.
- Text Search Query in NVivo (Mac) Use the text search query to identify relevant text in your data and automatically code references by saving as a node.
- Review the References in a Node in NVivo (Mac) NVivo uses the term references to refer to data that has been assigned to a code or any node. You can use the reference view to see the data linked to a specific node or combination of nodes.
- Coding Comparison Query in NVivo (Mac) Use the coding comparison query to calculate a measure of inter-rater reliability when you've worked with multiple coders.
The MAXQDA interface is the same across Mac and Windows devices.
- The "Code System" in MAXQDA This section of the manual shows how to create and manage codes in MAXQDA's code system.
- How to Code with MAXQDA
- Display Coded Segments in the Document Browser Once you've coded a document within MAXQDA, you can choose which of those codings will appear on the document, as well as choose whether or not the text is highlighted in the color linked to the code.
- Creative Coding in MAXQDA Use the creative coding feature to explore the relationships between codes in your system. If you develop a new structure to you codes that you like, you can apply the changes to your overall code scheme.
- Text Search in MAXQDA Use a Text Search to identify data that matches your search terms and automatically code the results. You can choose whether to code only the matching results, the sentence the results are in, or the paragraph the results appear in.
- Segment Retrieval in MAXQDA Data that has been coded is considered a segment. Segment retrieval is how you display the segments that match a code or combination of codes. You can use the activation feature to show only the segments from a document group, or that match a document variable.
- Intercorder Agreement in MAXQDA MAXQDA includes the ability to compare coding between two coders on a single project.
- Create Tags in Taguette Taguette uses the term tag to refer to codes. You can create single tags as well as a tag hierarchy using punctuation marks.
- Highlighting in Taguette Select text with a document (a highlight) and apply tags to code data in Taguette.
Useful Resources on Coding

Deterding, N. M., & Waters, M. C. (2021). Flexible coding of in-depth interviews: A twenty-first-century approach. Sociological Methods & Research , 50 (2), 708–739. https://doi.org/10.1177/0049124118799377
Farley, J., Duppong Hurley, K., & Aitken, A. A. (2020). Monitoring implementation in program evaluation with direct audio coding. Evaluation and Program Planning , 83 , 101854. https://doi.org/10.1016/j.evalprogplan.2020.101854
Ryan, G. W., & Bernard, H. R. (2003). Techniques to identify themes. Field Methods , 15 (1), 85–109. https://doi.org/10.1177/1525822X02239569.
- << Previous: Data organization
- Next: Citations >>
- Last Updated: Jun 6, 2024 9:59 AM
- URL: https://guides.library.illinois.edu/qualitative
A guide to coding qualitative research data
Last updated
12 February 2023
Reviewed by
Short on time? Get an AI generated summary of this article instead
Each time you ask open-ended and free-text questions, you'll end up with numerous free-text responses. When your qualitative data piles up, how do you sift through it to determine what customers value? And how do you turn all the gathered texts into quantifiable and actionable information related to your user's expectations and needs?
Qualitative data can offer significant insights into respondents’ attitudes and behavior. But to distill large volumes of text / conversational data into clear and insightful results can be daunting. One way to resolve this is through qualitative research coding.
Streamline data coding
Use global data tagging systems in Dovetail so everyone analyzing research is speaking the same language
- What is coding in qualitative research?
This is the system of classifying and arranging qualitative data . Coding in qualitative research involves separating a phrase or word and tagging it with a code. The code describes a data group and separates the information into defined categories or themes. Using this system, researchers can find and sort related content.
They can also combine categorized data with other coded data sets for analysis, or analyze it separately. The primary goal of coding qualitative data is to change data into a consistent format in support of research and reporting.
A code can be a phrase or a word that depicts an idea or recurring theme in the data. The code’s label must be intuitive and encapsulate the essence of the researcher's observations or participants' responses. You can generate these codes using two approaches to coding qualitative data: manual coding and automated coding.
- Why is it important to code qualitative data?
By coding qualitative data, it's easier to identify consistency and scale within a set of individual responses. Assigning codes to phrases and words within feedback helps capture what the feedback entails. That way, you can better analyze and understand the outcome of the entire survey.
Researchers use coding and other qualitative data analysis procedures to make data-driven decisions according to customer responses. Coding in customer feedback will help you assess natural themes in the customers’ language. With this, it's easy to interpret and analyze customer satisfaction .
- How do inductive and deductive approaches to qualitative coding work?
Before you start qualitative research coding, you must decide whether you're starting with some predefined code frames, within which the data will be sorted (deductive approach). Or, you may plan to develop and evolve the codes while reviewing the qualitative data generated by the research (inductive approach). A combination of both approaches is also possible.
In most instances, a combined approach will be best. For example, researchers will have some predefined codes/themes they expect to find in the data, but will allow for a degree of discovery in the data where new themes and codes come to light.
Inductive coding
This is an exploratory method in which new data codes and themes are generated by the review of qualitative data. It initiates and generates code according to the source of the data itself. It's ideal for investigative research, in which you devise a new idea, theory, or concept.
Inductive coding is otherwise called open coding. There's no predefined code-frame within inductive coding, as all codes are generated by reviewing the raw qualitative data.
If you're adding a new code, changing a code descriptor, or dividing an existing code in half, ensure you review the wider code frame to determine whether this alteration will impact other feedback codes. Failure to do this may lead to similar responses at various points in the qualitative data, generating different codes while containing similar themes or insights.
Inductive coding is more thorough and takes longer than deductive coding, but offers a more unbiased and comprehensive overview of the themes within your data.
Deductive coding
This is a hierarchical approach to coding. In this method, you develop a codebook using your initial code frames. These frames may depend on an ongoing research theory or questions. Go over the data once again and filter data to different codes.
After generating your qualitative data, your codes must be a match for the code frame you began with. Program evaluation research could use this coding approach.
Inductive and deductive approaches
Research studies usually blend both inductive and deductive coding approaches. For instance, you may use a deductive approach for your initial set of code sets, and later use an inductive approach to generate fresh codes and recalibrate them while you review and analyze your data.
- What are the practical steps for coding qualitative data?
You can code qualitative data in the following ways:
1. Conduct your first-round pass at coding qualitative data
You need to review your data and assign codes to different pieces in this step. You don't have to generate the right codes since you will iterate and evolve them ahead of the second-round coding review.
Let's look at examples of the coding methods you may use in this step.
Open coding : This involves the distilling down of qualitative data into separate, distinct coded elements.
Descriptive coding : In this method, you create a description that encapsulates the data section’s content. Your code name must be a noun or a term that describes what the qualitative data relates to.
Values coding : This technique categorizes qualitative data that relates to the participant's attitudes, beliefs, and values.
Simultaneous coding : You can apply several codes to a single piece of qualitative data using this approach.
Structural coding : In this method, you can classify different parts of your qualitative data based on a predetermined design to perform additional analysis within the design.
In Vivo coding : Use this as the initial code to represent specific phrases or single words generated via a qualitative interview (i.e., specifically what the respondent said).
Process coding : A process of coding which captures action within data. Usually, this will be in the form of gerunds ending in “ing” (e.g., running, searching, reviewing).
2. Arrange your qualitative codes into groups and subcodes
You can start organizing codes into groups once you've completed your initial round of qualitative data coding. There are several ways to arrange these groups.
You can put together codes related to one another or address the same subjects or broad concepts, under each category. Continue working with these groups and rearranging the codes until you develop a framework that aligns with your analysis.
3. Conduct more rounds of qualitative coding
Conduct more iterations of qualitative data coding to review the codes and groups you've already established. You can change the names and codes, combine codes, and re-group the work you've already done during this phase.
In contrast, the initial attempt at data coding may have been hasty and haphazard. But these coding rounds focus on re-analyzing, identifying patterns, and drawing closer to creating concepts and ideas.
Below are a few techniques for qualitative data coding that are often applied in second-round coding.
Pattern coding : To describe a pattern, you join snippets of data, similarly classified under a single umbrella code.
Thematic analysis coding : When examining qualitative data, this method helps to identify patterns or themes.
Selective coding/focused coding : You can generate finished code sets and groups using your first pass of coding.
Theoretical coding : By classifying and arranging codes, theoretical coding allows you to create a theoretical framework's hypothesis. You develop a theory using the codes and groups that have been generated from the qualitative data.
Content analysis coding : This starts with an existing theory or framework and uses qualitative data to either support or expand upon it.
Axial coding : Axial coding allows you to link different codes or groups together. You're looking for connections and linkages between the information you discovered in earlier coding iterations.
Longitudinal coding : In this method, by organizing and systematizing your existing qualitative codes and categories, it is possible to monitor and measure them over time.
Elaborative coding : This involves applying a hypothesis from past research and examining how your present codes and groups relate to it.
4. Integrate codes and groups into your concluding narrative
When you finish going through several rounds of qualitative data coding and applying different forms of coding, use the generated codes and groups to build your final conclusions. The final result of your study could be a collection of findings, theory, or a description, depending on the goal of your study.
Start outlining your hypothesis , observations , and story while citing the codes and groups that served as its foundation. Create your final study results by structuring this data.
- What are the two methods of coding qualitative data?
You can carry out data coding in two ways: automatic and manual. Manual coding involves reading over each comment and manually assigning labels. You'll need to decide if you're using inductive or deductive coding.
Automatic qualitative data analysis uses a branch of computer science known as Natural Language Processing to transform text-based data into a format that computers can comprehend and assess. It's a cutting-edge area of artificial intelligence and machine learning that has the potential to alter how research and insight is designed and delivered.
Although automatic coding is faster than human coding, manual coding still has an edge due to human oversight and limitations in terms of computer power and analysis.
- What are the advantages of qualitative research coding?
Here are the benefits of qualitative research coding:
Boosts validity : gives your data structure and organization to be more certain the conclusions you are drawing from it are valid
Reduces bias : minimizes interpretation biases by forcing the researcher to undertake a systematic review and analysis of the data
Represents participants well : ensures your analysis reflects the views and beliefs of your participant pool and prevents you from overrepresenting the views of any individual or group
Fosters transparency : allows for a logical and systematic assessment of your study by other academics
- What are the challenges of qualitative research coding?
It would be best to consider theoretical and practical limitations while analyzing and interpreting data. Here are the challenges of qualitative research coding:
Labor-intensive: While you can use software for large-scale text management and recording, data analysis is often verified or completed manually.
Lack of reliability: Qualitative research is often criticized due to a lack of transparency and standardization in the coding and analysis process, being subject to a collection of researcher bias.
Limited generalizability : Detailed information on specific contexts is often gathered using small samples. Drawing generalizable findings is challenging even with well-constructed analysis processes as data may need to be more widely gathered to be genuinely representative of attitudes and beliefs within larger populations.
Subjectivity : It is challenging to reproduce qualitative research due to researcher bias in data analysis and interpretation. When analyzing data, the researchers make personal value judgments about what is relevant and what is not. Thus, different people may interpret the same data differently.
- What are the tips for coding qualitative data?
Here are some suggestions for optimizing the value of your qualitative research now that you are familiar with the fundamentals of coding qualitative data.
Keep track of your codes using a codebook or code frame
It can be challenging to recall all your codes offhand as you code more and more data. Keeping track of your codes in a codebook or code frame will keep you organized as you analyze the data. An Excel spreadsheet or word processing document might be your codebook's basic format.
Ensure you track:
The label applied to each code and the time it was first coded or modified
An explanation of the idea or subject matter that the code relates to
Who the original coder is
Any notes on the relationship between the code and other codes in your analysis
Add new codes to your codebook as you code new data, and rearrange categories and themes as necessary.
- How do you create high-quality codes?
Here are four useful tips to help you create high-quality codes.
1. Cover as many survey responses as possible
The code should be generic enough to aid your analysis while remaining general enough to apply to various comments. For instance, "product" is a general code that can apply to many replies but is also ambiguous.
Also, the specific statement, "product stops working after using it for 3 hours" is unlikely to apply to many answers. A good compromise might be "poor product quality" or "short product lifespan."
2. Avoid similarities
Having similar codes is acceptable only if they serve different objectives. While "product" and "customer service" differ from each other, "customer support" and "customer service" can be unified into a single code.
3. Take note of the positive and the negative
Establish contrasting codes to track an issue's negative and positive aspects separately. For instance, two codes to identify distinct themes would be "excellent customer service" and "poor customer service."
4. Minimize data—to a point
Try to balance having too many and too few codes in your analysis to make it as useful as possible.
What is the best way to code qualitative data?
Depending on the goal of your research, the procedure of coding qualitative data can vary. But generally, it entails:
Reading through your data
Assigning codes to selected passages
Carrying out several rounds of coding
Grouping codes into themes
Developing interpretations that result in your final research conclusions
You can begin by first coding snippets of text or data to summarize or characterize them and then add your interpretative perspective in the second round of coding.
A few techniques are more or less acceptable depending on your study’s goal; there is no right or incorrect way to code a data set.
What is an example of a code in qualitative research?
A code is, at its most basic level, a label specifying how you should read a text. The phrase, "Pigeons assaulted me and took my meal," is an illustration. You can use pigeons as a code word.
Is there coding in qualitative research?
An essential component of qualitative data analysis is coding. Coding aims to give structure to free-form data so one can systematically study it.
Should you be using a customer insights hub?
Do you want to discover previous research faster?
Do you share your research findings with others?
Do you analyze research data?
Start for free today, add your research, and get to key insights faster
Editor’s picks
Last updated: 18 April 2023
Last updated: 27 February 2023
Last updated: 6 February 2023
Last updated: 6 October 2023
Last updated: 5 February 2023
Last updated: 16 April 2023
Last updated: 7 March 2023
Last updated: 9 March 2023
Last updated: 12 December 2023
Last updated: 11 March 2024
Last updated: 6 March 2024
Last updated: 5 March 2024
Last updated: 13 May 2024
Latest articles
Related topics, .css-je19u9{-webkit-align-items:flex-end;-webkit-box-align:flex-end;-ms-flex-align:flex-end;align-items:flex-end;display:-webkit-box;display:-webkit-flex;display:-ms-flexbox;display:flex;-webkit-flex-direction:row;-ms-flex-direction:row;flex-direction:row;-webkit-box-flex-wrap:wrap;-webkit-flex-wrap:wrap;-ms-flex-wrap:wrap;flex-wrap:wrap;-webkit-box-pack:center;-ms-flex-pack:center;-webkit-justify-content:center;justify-content:center;row-gap:0;text-align:center;max-width:671px;}@media (max-width: 1079px){.css-je19u9{max-width:400px;}.css-je19u9>span{white-space:pre;}}@media (max-width: 799px){.css-je19u9{max-width:400px;}.css-je19u9>span{white-space:pre;}} decide what to .css-1kiodld{max-height:56px;display:-webkit-box;display:-webkit-flex;display:-ms-flexbox;display:flex;-webkit-align-items:center;-webkit-box-align:center;-ms-flex-align:center;align-items:center;}@media (max-width: 1079px){.css-1kiodld{display:none;}} build next, decide what to build next.

Users report unexpectedly high data usage, especially during streaming sessions.

Users find it hard to navigate from the home page to relevant playlists in the app.

It would be great to have a sleep timer feature, especially for bedtime listening.

I need better filters to find the songs or artists I’m looking for.
Log in or sign up
Get started for free

Coding Qualitative Data: A Beginner’s How-To + Examples

When gathering feedback, whether it’s from surveys , online reviews, or social mentions , the most valuable insights usually come from free-form or open-ended responses.
Though these types of responses allow for more detailed feedback, they are also difficult to measure and analyse on a large scale. Coding qualitative data allows you to transform these unique responses into quantitative metrics that can be compared to the rest of your data set.
Read on to learn about this process.
What is Qualitative Data Coding?

Qualitative data coding is the process of assigning quantitative tags to the pieces of data. This is necessary for any type of large-scale analysis because you 1) need to have a consistent way to compare and contrast each piece of qualitative data, and 2) will be able to use tools like Excel and Google Sheets to manipulate quantitative data.
For example, if a customer writes a Yelp review stating “The atmosphere was great for a Friday night, but the food was a bit overpriced,” you can assign quantitative tags based on a scale or sentiment. We’ll get into how exactly to assign these tags in the next section.
Inductive Coding vs Deductive Coding

When deciding how you will scale and code your data, you’ll first have to choose between the inductive or deductive methods. We cover the pros and cons of each method below.
Inductive Coding
Inductive coding is when you don’t already have a set scale or measurement with which to tag the data. If you’re analysing a large amount of qualitative data for the first time, such as the first round of a customer feedback survey, then you will likely need to start with inductive coding since you don’t know exactly what you will be measuring yet.
Inductive coding can be a lengthy process, as you’ll need to comb through your data manually. Luckily, things get easier the second time around when you’re able to use deductive coding.
Deductive Coding
Deductive coding is when you already have a predetermined scale or set of tags that you want to use on your data. This is usually if you’ve already analysed a set of qualitative data with inductive reasoning and want to use the same metrics.
To continue from the example above, say you noticed in the first round that a lot of Yelp reviews mentioned the price of food, and, using inductive coding, you were able to create a scale of 1-5 to measure appetisers, entrees, and desserts.
When analysing new Yelp reviews six months later, you’ll be able to keep the same scale and tag the new responses based on deductive coding, and therefore compare the data to the first round of analysis.
3 Steps for Coding Qualitative Data From the Top-Down

For this section, we will assume that we’re using inductive coding.
1. Start with Broad Categories
The first thing you will want to do is sort your data into broad categories. Think of each of these categories as specific aspects you want to know more about.
To continue with the restaurant example, your categories could include food quality, food price, atmosphere, location, service, etc.
Or for a business in the B2B space, your categories could look something like product quality, product price, customer service, chatbot quality, etc.
2. Assign Emotions or Sentiments
The next step is to then go through each category and assign a sentiment or emotion to each piece of data. In the broadest terms, you can start with just positive emotion and negative emotion.
Remember that when using inductive coding, you’re figuring out your scale and measurements as you go, so you can always start with broad analysis and drill down deeper as you become more familiar with your data.
3. Combine Categories and Sentiments to Draw Conclusions
Once you’ve sorted your data into categories and assigned sentiments, you can start comparing the numbers and drawing conclusions.
For example, perhaps you see that out of the 500 Yelp reviews you’ve analysed, 300 fall into the food price/negative sentiment section of your data. That’s a pretty clear indication that customers think your food is too expensive, and you may see an improvement in customer retention by dropping prices.
The three steps outlined above cover just the very basics of coding qualitative data, so you can understand the theory behind the analysis.
In order to gain more detailed conclusions, you’ll likely need to dig deeper into the data by assigning more complex sentiment tags and breaking down the categories further. We cover some useful tips and a coding qualitative data example below.
4 Tips to Keep in Mind for Accurate Qualitative Data Coding

Here are some helpful reminders to keep on hand when going through the three steps outlined above.
1. Start with a Small Sample of the Data
You’ll want to start with a small sample of your data to make sure the tags you’re using will be applicable to the rest of the set. You don’t want to waste time by going through and manually tagging each piece of data, only to realise at the end that the tags you’ve been using actually aren’t accurate.
Once you’ve broken up your qualitative data into the different categories, choose 10-20% of responses in each category to tag using inductive coding.
Then, continue onto the analysis phase using just that 10-20%.
If you’re able to find takeaways and easily compare the data with that small sample size , then you can continue coding the rest of the data in that same way, adding additional tags where needed.
2. Use Numerical Scales for Deeper Analysis
Instead of just assigning positive and negative sentiments to your data points, you can break this down even further by utilising numerical scales.
Exactly how negative or how positive was the piece of feedback? In the Yelp review example from the beginning of this article, the reviewer stated that the food was “a bit overpriced.” If you’re using a scale of 1-5 to tag the category “food price,” you could tag this as a ⅗ rating.
You’ll likely need to adjust your scales as you work through your initial sample and get a clearer picture of the review landscape.
Having access to more nuanced data like this is important for making accurate decisions about your business.
If you decided to stick with just positive and negative tags, your “food price” category might end up being 50% negative, indicating that a massive change to your pricing structure is needed immediately.
But if it turns out that most of those negative reviews are actually ⅗’s and not ⅕’s, then the situation isn’t as dire as it might have appeared at first glance.
3. Remember That Each Data Point Can Contain Multiple Pieces of Information
Remember that qualitative data can have multiple sentiments and multiple categories (such as the Yelp review example mentioning both atmosphere and price), so you may need to double or even triple-sort some pieces of data.
That’s the beauty of and the struggle with handling open-ended or free-form responses.
However, these responses allow for more accurate insights into your business vs narrow multiple-choice questions.
4. Be Mindful of Having Too Many Tags
Remember, you’re able to draw conclusions from your qualitative data by combining category tags and sentiment tags.
An easy mistake for data analysis newcomers to make is to end up with so many tags that comparing them becomes impossible. This usually stems from an overabundance of caution that you’re tagging responses accurately.
For example, say you’re tagging a review that’s discussing a restaurant host’s behavior. You put it in the category “host/hostess behavior” and tag it as a ⅗ for the sentiment.
Then, you come across another review discussing a server’s behaviour that’s slightly more positive, so you tag this as “server behaviour” for the category and 3.75/5 for the sentiment.
By getting this granular, you’re going to end up with very few data points in the same category and sentiment, which defeats the purpose of coding qualitative data.
In this example, unless you’re very specifically looking at the behaviour of individual restaurant positions, you’re better off tagging both responses as “customer service” for the category and ⅗ for the sentiment for consistency’s sake.
Coding Qualitative Data Example
Below we’ll walk through an example of coding qualitative data, utilising the steps and tips detailed above.

Step 1: Read through your data and define your categories. For this example, we’ll use “customer service,” “product quality,” and “price.”
Step 2: Sort a sample of the data into the above categories. Remember that each data point can be included in multiple categories.
- “This software is amazing, does exactly what I need it to [Product Quality]. However, I do wish they’d stop raising prices every year as it’s starting to get a little out of my budget [Price].”
- “Love the product [Product Quality], but honestly I can’t deal with the terrible customer service anymore [Customer Service]. I’ll be shopping around for a new solution.”
- “Meh, this software is okay [Product Quality] but cheaper competitors [Price] are just as good with much better customer service [Customer Service].”
Step 3: Assign sentiments to the sample. For more in-depth analysis, use a numerical scale. We’ll use 1-5 in this example, with 1 being the lowest satisfaction and 5 being the highest.
- Product Quality:
- “This software is amazing, does exactly what I need it to do” [5/5]
- “Love the product” [5/5]
- “Meh, this software is okay [⅖]
- Customer Service:
- “Honestly I can’t deal with the terrible customer service anymore [⅕]
- “...Much better customer service,” [⅖]
- “However, I do wish they’d stop raising prices every year as it’s starting to get a little out of my budget.” [⅗]
- “Cheaper competitors are just as good.” [⅖]
Step 4: After confirming that the established category and sentiment tags are accurate, continue steps 1-3 for the rest of your data, adding tags where necessary.
Step 5: Identify recurring patterns using data analysis. You can combine your insights with other types of data , like demographic and psychographic customer profiles.
Step 6: Take action based on what you find! For example, you may discover that customers aged 20-30 were the most likely to provide negative feedback on your customer service team, equating to ⅖ or ⅕ on your coding scale. You may be able to conclude that younger customers need a more streamlined way to communicate with your company, perhaps through an automated chatbot service.
Step 7: Repeat this process with more specific research goals in mind to continue digging deeper into what your customers are thinking and feeling . For example, if you uncover the above insight through coding qualitative data from online reviews, you could send out a customer feedback survey specifically asking free-form questions about how your customers would feel interacting with a chatbot instead.
How AI tools help with Coding Qualitative Data

Now that you understand the work that goes into coding qualitative data, you’re probably wondering if there’s an easier solution than manually sorting through every response.
The good news is that, yes, there is. Advanced AI-backed tools are available to help companies quickly and accurately analyse qualitative data at scale, such as customer surveys and online reviews.
These tools can not only code data based on a set of rules you determine, but they can even do their own inductive coding to determine themes and create the most accurate tags as they go.
These capabilities allow business owners to make accurate decisions about their business based on actual data and free up the necessary time and employee bandwidth to act on these insights.
The infographic below gives a visual summary of how to code qualitative data and why it’s essential for businesses to learn how:

Try Chattermill today today to learn how our AI-powered software can help you make smarter business decisions.
Related articles.
The faster horses myth and 3 CX lessons it teaches us
This week we take a look at what we can learn from the quotes attributed to Henry Ford - and the 3 timeless CX fundamentals of success.

Rules Are Made to Be Broken: Modernizing CX Feedback with Advanced AI

5 learnings of (nearly) a decade working with marketplaces
See chattermill in action.
Understand the voice of your customers in realtime with Customer Feedback Analytics from Chattermill.
- AI & NLP
- Churn & Loyalty
- Customer Experience
- Customer Journeys
- Customer Metrics
- Feedback Analysis
- Product Experience
- Product Updates
- Sentiment Analysis
- Surveys & Feedback Collection
- Try Thematic
Welcome to the community

Coding Qualitative Data: How To Guide
How many hours have you spent sitting in front of Excel spreadsheets trying to find new insights from customer feedback?
You know that asking open-ended survey questions gives you more actionable insights than asking your customers for just a numerical Net Promoter Score (NPS) . But when you ask open-ended, free-text questions, you end up with hundreds (or even thousands) of free-text responses.
How can you turn all of that text into quantifiable, applicable information about your customers’ needs and expectations? By coding qualitative data.
In this article, we will cover different coding methods for qualitative data, including both manual and automated approaches, to provide a comprehensive understanding of the techniques used in the first-round pass at coding.
Keep reading to learn:
- What coding qualitative data means (and why it’s important)
- Different methods of coding qualitative data
- How to manually code qualitative data to find significant themes in your data
What is coding in qualitative research?
Conducting qualitative research, particularly through coding, is a crucial step in ensuring the validity and reliability of the findings. Coding is the process of labeling and organizing your qualitative data to identify different themes and the relationships between them.
When coding customer feedback , you assign labels to words or phrases that represent important (and recurring) themes in each response. These labels can be words, phrases, or numbers; we recommend using words or short phrases, since they’re easier to remember, skim, and organize.
Coding qualitative research to find common themes and concepts is part of thematic analysis . Thematic analysis extracts themes from text by analyzing the word and sentence structure.
Within the context of customer feedback, it’s important to understand the many different types of qualitative feedback a business can collect, such as open-ended surveys, social media comments, reviews & more.
What is qualitative data analysis?
Qualitative data analysis , including coding and analyzing qualitative data, is essential for understanding the depth and complexity of qualitative data. It is the process of examining and interpreting qualitative data to understand what it represents.
Qualitative analysis is crucial as it involves various methods such as thematic analysis, emotion coding, inductive and deductive thematic analysis, and content analysis. These methods help in coding the data, which is vital for the validity of the analysis.
Qualitative data is defined as any non-numerical and unstructured data; when looking at customer feedback, qualitative data usually refers to any verbatim or text-based feedback such as reviews, open-ended responses in surveys , complaints, chat messages, customer interviews, case notes or social media posts.
For example, NPS metric can be strictly quantitative, but when you ask customers why they gave you a rating a score, you will need qualitative data analysis methods in place to understand the comments that customers leave alongside numerical responses.
Methods of qualitative data analysis
Thematic analysis.
This refers to the uncovering of themes, by analyzing the patterns and relationships in a set of qualitative data. A theme emerges or is built when related findings appear to be meaningful and there are multiple occurrences. Thematic analysis can be used by anyone to transform and organize open-ended responses, analyze online reviews , and other qualitative data into significant themes. Thematic analysis coding is a method that aids in categorizing data extracts and deriving themes and patterns for qualitative analysis, facilitating the identification of themes revolving around a particular concept or phenomenon in the social sciences.
Content analysis:
This refers to the categorization, tagging and thematic analysis of qualitative data. Essentially content analysis is a quantification of themes, by counting the occurrence of concepts, topics or themes. Content analysis can involve combining the categories in qualitative data with quantitative data, such as behavioral data or demographic data, for deeper insights.
Narrative analysis:
Some qualitative data, such as interviews or field notes may contain a story on how someone experienced something. For example, the process of choosing a product, using it, evaluating its quality and decision to buy or not buy this product next time. The goal of narrative analysis is to turn the individual narratives into data that can be coded. This is then analyzed to understand how events or experiences had an impact on the people involved. Process coding is particularly useful in narrative analysis for identifying specific phases, sequences, and movements within the stories, capturing actions within qualitative data by using codes that typically represent gerunds ending in 'ing', providing a dynamic account of events within the data.
Discourse analysis:
This refers to analysis of what people say in social and cultural context. The goal of discourse analysis is to understand user or customer behavior by uncovering their beliefs, interests and agendas. These are reflected in the way they express their opinions, preferences and experiences. Structural coding is a method that can be applied here, organizing data based on predetermined structures, such as the structure of discourse elements, to enhance the analysis of discourse. It’s particularly useful when your focus is on building or strengthening a brand , by examining how they use metaphors and rhetorical devices.
Framework analysis:
When performing qualitative data analysis, it is useful to have a framework to organize the buckets of meaning. A taxonomy or code frame (a hierarchical set of themes used in coding qualitative data) is an example of the result. Don't fall into the trap of starting with a framework to make it faster to organize your data. You should look at how themes relate to each other by analyzing the data and consistently check that you can validate that themes are related to each other .
Grounded theory:
This method of analysis starts by formulating a theory around a single data case. Therefore the theory is “grounded' in actual data. Then additional cases can be examined to see if they are relevant and can add to the original theory.
Why is it important to code qualitative data?
Coding qualitative data makes it easier to interpret customer feedback. Assigning codes to words and phrases in each response helps capture what the response is about which, in turn, helps you better analyze and summarize the results of the entire survey.
Researchers use coding and other qualitative data analysis processes to help them make data-driven decisions based on customer feedback. When you use coding to analyze your customer feedback, you can quantify the common themes in customer language. This makes it easier to accurately interpret and analyze customer satisfaction.
What is thematic coding?
Thematic coding, also called thematic analysis, is a type of qualitative data analysis that finds themes in text by analyzing the meaning of words and sentence structure.
When you use thematic coding to analyze customer feedback for example, you can learn which themes are most frequent in feedback. This helps you understand what drives customer satisfaction in an accurate, actionable way.
To learn more about how Thematic analysis software helps you automate the data coding process, check out this article .
Automated vs. Manual coding of qualitative data
Methods of coding qualitative data fall into three categories: automated coding and manual coding, and a blend of the two.
You can automate the coding of your qualitative data with thematic analysis software . Thematic analysis and qualitative data analysis software use machine learning, artificial intelligence (AI) natural language processing (NLP) to code your qualitative data and break text up into themes.
Thematic analysis software is autonomous , which means…
- You don't need to set up themes or categories in advance.
- You don't need to train the algorithm — it learns on its own.
- You can easily capture the “unknown unknowns” to identify themes you may not have spotted on your own.
…all of which will save you time (and lots of unnecessary headaches) when analyzing your customer feedback.
Businesses are also seeing the benefit of using thematic analysis software. The capacity to aggregate data sources into a single source of analysis helps to break down data silos, unifying the analysis and insights across departments . This is now being referred to as Omni channel analysis or Unified Data Analytics .
Use Thematic Analysis Software
Try Thematic today to discover why leading companies rely on the platform to automate the coding of qualitative customer feedback at scale. Whether you have tons of customer reviews, support chat or open-ended survey responses, Thematic brings every valuable insight to the surface, while saving you thousands of hours.
Advances in natural language processing & machine learning have made it possible to automate the analysis of qualitative data, in particular content and framework analysis. The most commonly used software for automated coding of qualitative data is text analytics software such as Thematic .
While manual human analysis is still popular due to its perceived high accuracy, automating most of the analysis is quickly becoming the preferred choice. Unlike manual analysis, which is prone to bias and doesn't scale to the amount of qualitative data that is generated today, automating analysis is not only more consistent and therefore can be more accurate, but can also save a ton of time, and therefore money.
Our Theme Editor tool ensures you take a reflexive approach, an important step in thematic analysis. The drag-and-drop tool makes it easy to refine, validate, and rename themes as you get more data. By guiding the AI, you can ensure your results are always precise, easy to understand and perfectly aligned with your objectives.
Thematic is the best software to automate code qualitative feedback at scale.
Don't just take it from us. Here's what some of our customers have to say:
I'm a fan of Thematic's ability to save time and create heroes. It does an excellent job using a single view to break down the verbatims into themes displayed by volume, sentiment and impact on our beacon metric, often but not exclusively NPS.
It does a superlative job using GenAI in summarizing a theme or sub-theme down to a single paragraph making it clear what folks are trying to say. Peter K, Snr Research Manager.
Thematic is a very intuitive tool to use. It boasts a robust level of granularity, allowing the user to see the general breadth of verbatim themes, dig into the sub-themes, and further into the sentiment of the open text itself. Artem C, Sr Manager of Research. LinkedIn.
AI-powered software to transform qualitative data at scale through a thematic and content analysis.
How to manually code qualitative data
For the rest of this post, we'll focus on manual coding. Different researchers have different processes, but manual coding usually looks something like this:
- Choose whether you'll use deductive or inductive coding.
- Read through your data to get a sense of what it looks like. Assign your first set of codes.
- Go through your data line-by-line to code as much as possible. Your codes should become more detailed at this step.
- Categorize your codes and figure out how they fit into your coding frame.
- Identify which themes come up the most — and act on them.
Let's break it down a little further…
Deductive coding vs. inductive coding
Before you start qualitative data coding, you need to decide which codes you'll use.
What is Deductive Coding?
Deductive coding means you start with a predefined set of codes, then assign those codes to the new qualitative data. These codes might come from previous research, or you might already know what themes you're interested in analyzing. Deductive coding is also called concept-driven coding.
For example, let's say you're conducting a survey on customer experience . You want to understand the problems that arise from long call wait times, so you choose to make “wait time” one of your codes before you start looking at the data.
The deductive approach can save time and help guarantee that your areas of interest are coded. But you also need to be careful of bias; when you start with predefined codes, you have a bias as to what the answers will be. Make sure you don't miss other important themes by focusing too hard on proving your own hypothesis.
What is Inductive Coding?
Inductive coding , also called open coding, starts from scratch and creates codes based on the qualitative data itself. You don't have a set codebook; all codes arise directly from the survey responses.
Here's how inductive coding works:
- Break your qualitative dataset into smaller samples.
- Read a sample of the data.
- Create codes that will cover the sample.
- Reread the sample and apply the codes.
- Read a new sample of data, applying the codes you created for the first sample.
- Note where codes don't match or where you need additional codes.
- Create new codes based on the second sample.
- Go back and recode all responses again.
- Repeat from step 5 until you've coded all of your data.
If you add a new code, split an existing code into two, or change the description of a code, make sure to review how this change will affect the coding of all responses. Otherwise, the same responses at different points in the survey could end up with different codes.
Sounds like a lot of work, right? Inductive coding is an iterative process, which means it takes longer and is more thorough than deductive coding. A major advantage is that it gives you a more complete, unbiased look at the themes throughout your data.
Combining inductive and deductive coding
In practice, most researchers use a blend of inductive and deductive approaches to coding.
For example, with Thematic, the AI inductively comes up with themes , while also framing the analysis so that it reflects how business decisions are made . At the end of the analysis, researchers use the Theme Editor to iterate or refine themes. Then, in the next wave of analysis, as new data comes in, the AI starts deductively with the theme taxonomy.
Categorize your codes with coding frames
Once you create your codes, you need to put them into a coding frame. A coding frame represents the organizational structure of the themes in your research. There are two types of coding frames: flat and hierarchical.
Flat Coding Frame
A flat coding frame assigns the same level of specificity and importance to each code. While this might feel like an easier and faster method for manual coding, it can be difficult to organize and navigate the themes and concepts as you create more and more codes. It also makes it hard to figure out which themes are most important, which can slow down decision making.
Hierarchical Coding Frame
Hierarchical frames help you organize codes based on how they relate to one another. For example, you can organize the codes based on your customers' feelings on a certain topic:

Hierarchical Coding Frame example
In this example:
- The top-level code describes the topic (customer service)
- The mid-level code specifies whether the sentiment is positive or negative
- The third level details the attribute or specific theme associated with the topic
Hierarchical framing supports a larger code frame and lets you organize codes based on organizational structure. It also allows for different levels of granularity in your coding.
Whether your code frames are hierarchical or flat, your code frames should be flexible. Manually analyzing survey data takes a lot of time and effort; make sure you can use your results in different contexts.
For example, if your survey asks customers about customer service, you might only use codes that capture answers about customer service. Then you realize that the same survey responses have a lot of comments about your company's products. To learn more about what people say about your products, you may have to code all of the responses from scratch! A flexible coding frame covers different topics and insights, which lets you reuse the results later on.
Tips for manually coding qualitative data
Now that you know the basics of coding your qualitative data, here are some tips on making the most of your qualitative research.
Use a codebook to keep track of your codes
As you code more and more data, it can be hard to remember all of your codes off the top of your head. Tracking your codes in a codebook helps keep you organized throughout the data analysis process. Your codebook can be as simple as an Excel spreadsheet or word processor document. As you code new data, add new codes to your codebook and reorganize categories and themes as needed.
Make sure to track:
- The label used for each code
- A description of the concept or theme the code refers to
- Who originally coded it
- The date that it was originally coded or updated
- Any notes on how the code relates to other codes in your analysis
How to create high-quality codes - 4 tips
1. cover as many survey responses as possible..
The code should be generic enough to apply to multiple comments, but specific enough to be useful in your analysis. For example, “Product” is a broad code that will cover a variety of responses — but it's also pretty vague. What about the product? On the other hand, “Product stops working after using it for 3 hours” is very specific and probably won't apply to many responses. “Poor product quality” or “short product lifespan” might be a happy medium.
2. Avoid commonalities.
Having similar codes is okay as long as they serve different purposes. “Customer service” and “Product” are different enough from one another, while “Customer service” and “Customer support” may have subtle differences but should likely be combined into one code.
3. Capture the positive and the negative.
Try to create codes that contrast with each other to track both the positive and negative elements of a topic separately. For example, “Useful product features” and “Unnecessary product features” would be two different codes to capture two different themes.
4. Reduce data — to a point.
Let's look at the two extremes: There are as many codes as there are responses, or each code applies to every single response. In both cases, the coding exercise is pointless; you don't learn anything new about your data or your customers. To make your analysis as useful as possible, try to find a balance between having too many and too few codes.
Group responses based on themes, not words
Make sure to group responses with the same themes under the same code, even if they don't use the same exact wording. For example, a code such as “cleanliness” could cover responses including words and phrases like:
- Looked like a dump
- Could eat off the floor
Having only a few codes and hierarchical framing makes it easier to group different words and phrases under one code. If you have too many codes, especially in a flat frame, your results can become ambiguous and themes can overlap. Manual coding also requires the coder to remember or be able to find all of the relevant codes; the more codes you have, the harder it is to find the ones you need, no matter how organized your codebook is.
Make accuracy a priority
Manually coding qualitative data means that the coder's cognitive biases can influence the coding process. For each study, make sure you have coding guidelines and training in place to keep coding reliable, consistent, and accurate .
One thing to watch out for is definitional drift, which occurs when the data at the beginning of the data set is coded differently than the material coded later. Check for definitional drift across the entire dataset and keep notes with descriptions of how the codes vary across the results.
If you have multiple coders working on one team, have them check one another's coding to help eliminate cognitive biases.
Conclusion: 6 main takeaways for coding qualitative data
Here are 6 final takeaways for manually coding your qualitative data:
- Coding is the process of labeling and organizing your qualitative data to identify themes. After you code your qualitative data, you can analyze it just like numerical data.
- Inductive coding (without a predefined code frame) is more difficult, but less prone to bias, than deductive coding.
- Code frames can be flat (easier and faster to use) or hierarchical (more powerful and organized).
- Your code frames need to be flexible enough that you can make the most of your results and use them in different contexts.
- When creating codes, make sure they cover several responses, contrast one another, and strike a balance between too much and too little information.
- Consistent coding = accuracy. Establish coding procedures and guidelines and keep an eye out for definitional drift in your qualitative data analysis.
Some more detail in our downloadable guide
If you've made it this far, you'll likely be interested in our free guide: Best practices for analyzing open-ended questions.
The guide includes some of the topics covered in this article, and goes into some more niche details.
If your company is looking to automate your qualitative coding process, try Thematic !
If you're looking to trial multiple solutions, check out our free buyer's guide . It covers what to look for when trialing different feedback analytics solutions to ensure you get the depth of insights you need.
Happy coding!
Authored by Alyona Medelyan, PhD – Natural Language Processing & Machine Learning

CEO and Co-Founder
Alyona has a PhD in NLP and Machine Learning. Her peer-reviewed articles have been cited by over 2600 academics. Her love of writing comes from years of PhD research.
We make it easy to discover the customer and product issues that matter.
Unlock the value of feedback at scale, in one platform. Try it for free now!
- Questions to ask your Feedback Analytics vendor
- How to end customer churn for good
- Scalable analysis of NPS verbatims
- 5 Text analytics approaches
- How to calculate the ROI of CX
Our experts will show you how Thematic works, how to discover pain points and track the ROI of decisions. To access your free trial, book a personal demo today.
Recent posts
Discover the power of thematic analysis to unlock insights from qualitative data. Learn about manual vs. AI-powered approaches, best practices, and how Thematic software can revolutionize your analysis workflow.
When two major storms wreaked havoc on Auckland and Watercare’s infrastructurem the utility went through a CX crisis. With a massive influx of calls to their support center, Thematic helped them get inisghts from this data to forge a new approach to restore services and satisfaction levels.
Become a qualitative theming pro! Creating a perfect code frame is hard, but thematic analysis software makes the process much easier.
Coding Qualitative Data
- First Online: 02 January 2023
Cite this chapter

- Marla Rogers 4
Part of the book series: Springer Texts in Education ((SPTE))
5178 Accesses
1 Citations
With the advent and proliferation of analysis software (e.g., Nvivo, Atlas.ti), coding data has become much easier in terms of application. Where autocoding algorithms do much to assist and enlighten a researcher in analysis, coding qualitative data remains an act that must largely be undertaken by a human in order to fully address the research question(s) (Kaufmann, A. A., Barcomb, A., & Riehle, D. (2020). Supporting interview analysis with autocoding. HICSS. https://www.semanticscholar.org/paper/Supporting-Interview-Analysis-with-Autocoding-Kaufmann-Barcomb/b6e045859b5ce94e1eb144a9545b26c5e9fa6f32 ). Even seasoned qualitative researchers can find the process of coding their datum corpus to be arduous at times. For novice researchers, the task can quickly become baffling and overwhelming.
This is a preview of subscription content, log in via an institution to check access.
Access this chapter
- Available as PDF
- Read on any device
- Instant download
- Own it forever
- Available as EPUB and PDF
- Compact, lightweight edition
- Dispatched in 3 to 5 business days
- Free shipping worldwide - see info
Tax calculation will be finalised at checkout
Purchases are for personal use only
Institutional subscriptions
Analyzing Qualitative Data Using NVivo

Creating Inheritable Digital Codebooks for Qualitative Research Data Analysis

How We Code
Anonymous Author. (2019, July 2). Resolve: Finding a resolution for infertility: Infertility support group and discussion community [online discussion post]. https://www.inspire.com/
Basit, T. N. (2003). Manual or electronic? The role of coding in qualitative data analysis. Educational Research, 45 (2), 143–154.
Article Google Scholar
Braun, V., & Clarke, V. (2006). Using thematic analysis in psychology. Qualitative Research in Psychology, 3 (2), 77–101.
Caulfield, J. (2019, September 6). How to do thematic analysis . www.scribbr.com/methodology/thematicanalysis
Creswell, J. (2015). 30 Essential skills for the qualitative researcher . SAGE.
Google Scholar
Elliot, V. (2018). Thinking about the coding process in qualitative data analysis. The Qualitative Report, 23 (11), 2850–2861. https://nsuworks.nova.edu/tqr/vol23/iss11/14
Kaufmann, A. A., Barcomb, A., & Riehle, D. (2020). Supporting interview analysis with autocoding. HICSS. https://www.semanticscholar.org/paper/Supporting-Interview-Analysis-with-Autocoding-Kaufmann-Barcomb/b6e045859b5ce94e1eb144a9545b26c5e9fa6f32
Saldana, J. (2009). The coding manual for qualitative researchers. SAGE.
Further Readings
Analyzing Qualitative Data: Nvivo 12 Pro for Windows (2 hours). https://www.youtube.com/watch?v=CKPS4LF9G8A
How to Analyze Interview Transcripts. (2 minutes). https://www.rev.com/blog/analyze-interview-transcripts-in-qualitative-research
How to Know You Are Coding Correctly (4 minutes). https://www.youtube.com/watch?v=iL7Ww5kpnIM
Download references
Author information
Authors and affiliations.
University of Saskatchewan, Saskatoon, Canada
Marla Rogers
You can also search for this author in PubMed Google Scholar
Corresponding author
Correspondence to Marla Rogers .
Editor information
Editors and affiliations.
Department of Educational Administration, College of Education, University of Saskatchewan, Saskatoon, SK, Canada
Janet Mola Okoko
Scott Tunison
Department of Educational Administration, University of Saskatchewan, Saskatoon, SK, Canada
Keith D. Walker
Rights and permissions
Reprints and permissions
Copyright information
© 2023 The Author(s), under exclusive license to Springer Nature Switzerland AG
About this chapter
Rogers, M. (2023). Coding Qualitative Data. In: Okoko, J.M., Tunison, S., Walker, K.D. (eds) Varieties of Qualitative Research Methods. Springer Texts in Education. Springer, Cham. https://doi.org/10.1007/978-3-031-04394-9_12
Download citation
DOI : https://doi.org/10.1007/978-3-031-04394-9_12
Published : 02 January 2023
Publisher Name : Springer, Cham
Print ISBN : 978-3-031-04396-3
Online ISBN : 978-3-031-04394-9
eBook Packages : Education Education (R0)
Share this chapter
Anyone you share the following link with will be able to read this content:
Sorry, a shareable link is not currently available for this article.
Provided by the Springer Nature SharedIt content-sharing initiative
- Publish with us
Policies and ethics
- Find a journal
- Track your research
Want to create or adapt books like this? Learn more about how Pressbooks supports open publishing practices.
Chapter 10: Qualitative Data Collection & Analysis Methods
10.6 Qualitative Coding, Analysis, and Write-up: The How to Guide
This section provides an abbreviated set of steps and directions for coding, analyzing, and writing up qualitative data, taking an inductive approach. The following material is adapted from Research Rundowns, retrieved from https://researchrundowns.com/qual/qualitative-coding-analysis/ .
Step1: Open coding
At this first level of coding, the researcher is looking for distinct concepts and categories in the data, which will form the basic units of the analysis. In other words, the researcher is breaking down the data into first level concepts, or master headings, and second-level categories, or subheadings.
Researchers often use highlighters to distinguish concepts and categories. For example, if interviewees consistently talk about teaching methods, each time an interviewee mentions teaching methods, or something related to a teaching method, the researcher uses the same colour highlight. Teaching methods would become a concept, and other things related (types, etc.) would become categories – all highlighted in the same colour. It is valuable to use different coloured highlights to distinguish each broad concept and category. At the end of this stage, the transcripts contain many different colours of highlighted text. The next step is to transfer these into a brief outline, with main headings for concepts and subheadings for categories.
Step 2: Axial (focused) coding
In open coding, the researcher is focused primarily on the text from the interviews to define concepts and categories. In axial coding, the researcher is using the concepts and categories developed in the open coding process, while re-reading the text from the interviews. This step is undertaken to confirm that the concepts and categories accurately represent interview responses.
In axial coding, the researcher explores how the concepts and categories are related. To examine the latter, you might ask: What conditions caused or influenced concepts and categories? What is/was the social/political context? What are the associated effects or consequences? For example, let us suppose that one of the concepts is Adaptive Teaching , and two of the categories are tutoring and group projects . The researcher would then ask: What conditions caused or influenced tutoring and group projects to occur? From the interview transcripts, it is apparent that participants linked this condition (being able to offer tutoring and group projects) with being enabled by a supportive principle. Consequently, an axial code might be a phrase like our principal encourages different teaching methods . This discusses the context of the concept and/or categories and suggests that the researcher may need a new category labeled “supportive environment.” Axial coding is merely a more directed approach to looking at the data, to help make sure that the researcher has identified all important aspects.
Step 3: Build a data table
Table 10.4 illustrates how to transfer the final concepts and categories into a data table. This is a very effective way to organize results and/or discussion in a research paper. While this appears to be a quick process, it requires a lot of time to do it well.
Table 10.4 Major categories and associated concept
| Open Coding | ||
| Axial Coding Themes | Our principal encourages different teaching methods. | |
| New Category | Supportive environment. | |
| Add concepts that relate to supportive environment. | ||
| Continue on until you have undertaken an exhaustive analysis of the data. |
Step 4: Analysis & write-up
Not only is Table 10.4 an effective way to organize the analysis, it is also a good approach for assisting with the data analysis write-up. The first step in the analysis process is to discuss the various categories and describe the associated concepts. As part of this process, the researcher will describe the themes created in the axial coding process (the second step).
There are a variety of ways to present the data in the write-up, including: 1) telling a story; 2) using a metaphor; 3) comparing and contrasting; 4) examining relations among concepts/variables; and 5) counting. Please note that counting should not be a stand-alone qualitative data analysis process to use when writing up the results, because it cannot convey the richness of the data that has been collected. One can certainly use counting for stating the number of participants, or how many participants spoke about a specific theme or category; however, the researcher must present a much deeper level of analysis by drawing out the words of the participants, including the use of direct quotes from the participants´ interviews to demonstrate the validity of the various themes.
Here are some links to demonstrations on other methods for coding qualitative data:
- https://www.youtube.com/watch?reload=9&v=phXssQBCDls
- https://www.youtube.com/watch?v=lYzhgMZii3o
- http://qualisresearch.com/DownLoads/qda.pdf
When writing up the analysis, it is best to “identify” participants through a number, alphabetical letter, or pseudonym in the write-up (e.g. Participant #3 stated …). This demonstrates that you drawing data from all of the participants. Think of it this way, if you were doing quantitative analysis on data from 400 participants, you would present the data for all 400 participants, assuming they all answered a specific question. You will often see in a table of quantitative results (n=400), indicating that 400 people answered the question. This is the researcher’s way of confirming, to the reader, how many participants answered a particular research question. Assigning participant numbers, letters, or pseudonyms serves the same purpose in qualitative analysis.
Research Methods for the Social Sciences: An Introduction Copyright © 2020 by Valerie Sheppard is licensed under a Creative Commons Attribution-NonCommercial-ShareAlike 4.0 International License , except where otherwise noted.
Share This Book
- Customer Feedback Analytics
- Integrations
- Data Sources
- Marketing Intelligence
- Sentiment Analysis
- Ticket Driver Report
- AI Chatbot Preparation
- For Voice of Customer Teams
- For Product Operations Teams
- For Customer Support Teams
- For Customer Experience Teams
- Our Story and Team
- Customer Reviews
- Partner Program
- Start for free
Actionable guide for coding qualitative data

Calculating a Net Promoter Score (NPS) or similar numerically based surveys for your business is easy because numerical data is easy to add, average, and summarize. These can be easily calculated and averaged to create benchmarks and measure business growth. When you throw qualitative data (non-numerical feedback) into the mix, however, it’s less easy to analyze and summarize on its own without a customer feedback management platform or detailed, manual summary analysis of the data.
This is why developing a system for coding qualitative data, so it’s numbers or category-based, is helpful. Once quantified, this data can be used to interpret things like interview answers, reviews, and comments into meaningful, actionable results.
In this guide, we discuss coding qualitative data, including:
What is qualitative data?
What is data coding in qualitative research, steps for a qualitative data analysis, how do you code qualitative data in excel, bonus tips for quantifying qualitative data, what is the fastest way to code qualitative data, focus groups, record keeping, observation, longitudinal studies, case studies (storytelling or narratives), deductive coding, inductive coding, grounded theory, hierarchical coding frames, examples of qualitative data coding, step 1: create high-level categories, step 2: assign sentiments, step 3: combine and analyze, step 1: set up your spreadsheet, step 2: create your master list of category tags, step 3: add qualitative data, step 4: assign categories to data, step 5: assign sentiments, step 6: combine and average category ratings.
Qualitative data is non-numerical data feedback. It comes from written, audio, or imagery responses. Here’s an example of how the same question can be asked in 2 different ways, resulting in qualitative data and quantitative data:
- Qualitative : Tell us about your satisfaction with our software.
- Quantitative : Rate your satisfaction with our software on a scale from 1-10.
Most surveys will ask both qualitative and quantitative questions to collect more detailed data. And while it provides helpful, detailed information, the qualitative data analysis is not as quick to summarize and analyze afterwards without being quantified in some way, whether that be by manual analysis or using customer insight software . This is why brands are using qualitative data coding to better understand customer feedback.
Types of qualitative research
There are many types of qualitative research methods. Here are six popular ways to collect the qualitative data from your customers:
In interviews, you ask the respondent open-ended questions and record their answers. These often require a more personal approach and are best performed by a third party to avoid hesitation or biased responses.
In group settings, limit focus groups to six to ten people and use a third-party moderator for transparency.
Look for other sources of information to use in your qualitative data analysis. This could include customer records, purchase history, and other customer data you have legally obtained or collected.
This is when you or a third party observes your customers using the product and records what they observe (either by writing down or recording video or audio). Ethically, the customers should know they are being observed and for what purpose.
This is a longer-form research style where you collect data from the same source and conditions over a longer period. An example of this is medical studies that measure patients’ response to a drug over the long term.
You collect data from case studies to make empirical observations and draw inferences. This helps you understand the entire lifespan of a customer, including:
- Their key pain points
- Why they chose your product
- How they use(d) your product
- Why they would or would not recommend it to others.
The easiest raw data to collate, analyze and summarize is quantitative data; however, we can still use thematic analysis when coding qualitative data to help us come to the same, if not more detailed, conclusion and summary. When you identify themes from your data, you can put your qualitative responses into buckets of similar feedback to dive deeper into areas of your business or offerings that really need help.
In qualitative research, “coding data” means assigning categories or values to each written or observed response. These values can then be added and averaged to determine an accurate overall representation of each area of your business that you are analyzing.
For example, you could ask one of two questions:
- Are you happy with your product or service? (Answers to include either yes/no or a satisfaction rating scale.)
- Tell us about your experience using our product. (The response is open-ended.)
When you ask the first type of question you’ll get a high-level “yes, we like your product” or “no, we don’t” type of response. While this data is helpful, it doesn’t indicate what it is about the product that people like or don’t like.
When you ask open-ended survey questions, you can get more detailed responses about why they’re satisfied or dissatisfied with your offering. They may point out a feature that doesn’t work as advertised (which you can now fix) or that the long wait time to reach a customer service rep through the chat box on your website has prevented them from using your product to its full potential.
Coding frameworks and methodology
Your methodology used for coding qualitative data will impact the level of detail and results you achieve. The more specific your qualitative data coding is, the more detail you’ll uncover.
Here are some common qualitative research coding frameworks:
A deductive approach to coding qualitative data works best when you have sound foundational tags and categories in place. With deductive methods, you use the data you have to look for patterns, develop a hypothesis, and write your theory.
Deductive coding works great for annual survey data because you can use the same tags as the previous year as your benchmark and compare it to current results. You can also choose to combine your deductive coding with inductive coding.
With inductive methods, you create a theory that you test, observe, and confirm. Inductive coding is best for your first round of analysis to help you determine the tags that’ll be of the highest value. This will be a lengthier process than deductive coding, but it’s an essential first step to getting the foundational data and labels you need for more in-depth coding and thematic analysis of your data.
Inductive coding also works best when you have scale measurements or are analyzing large amounts of qualitative data you haven’t analyzed before. Without qualitative coding software, it requires manually reviewing the data, which is why inductive coding takes so long.
Another way to code data is using a grounded theory. This is when you develop a theory based on data from a single customer. Your theory is “grounded” in real customer data, and you can test your theory by expanding your analysis to additional customers. This will help you determine if your theory is statistically applicable to a larger population of customers, or is an isolated case.
Your coding method can be as basic as determining a positive or negative sentiment towards a specific tag or category. It can also be tagged to understand specific reasons for that sentiment. There’s no right or wrong way to do this. It all depends on how much specificity and detail you want.
For example, when coding the sentiments of your product or service offering, Level 1 is the category tag you are analyzing. Level 2 is the sentiment (either positive or negative). The final level goes into more detail about why the respondent chose that sentiment. This is a tagset that you may not be able to create until you’ve analyzed at least some of the data (unless you already know this information from previous research, customer feedback , or grounded theories).
There are different ways of coding qualitative data. Here are some examples:
- In Vivo Coding : Coding is based on the participant’s words, not your own interpretation. For example, if the response includes emotional words to describe how they feel about your product, use those exact words as your tags.
- Process Coding : This helps understand people’s processes or steps. For example, if someone is describing how they use your software product to get their end result, they may explain actions (usually using “ing”) words. Use each “step” they describe as a tag to analyze the sentiment related to that step.
- Descriptive Coding : This analysis includes the analyst summarizing the response into a description. You then code the qualitative data based on a keyword or noun in that description.
- Values Coding : You take your qualitative data and create codes according to values, attitudes or beliefs.
- Simultaneous Coding : This is when a single open-ended response will correspond to several category codes. This is common in written testimonials and reviews. For example, a customer writes the following review: “I love this product. The features and customer support were outstanding.” This references an overall positive sentiment about the product and high ratings for the features and customer support. To capture this detailed data, this would be tagged with three predefined codes: product sentiment, product features, and customer service.
If you are coding qualitative data manually, there are three basic steps to code the data:
Assign the categories of data you want to analyze. For example, if you’re doing an annual survey for the purposes of understanding customer sentiment and satisfaction with your company and its offerings, you may choose some of these tags (or others based on your type of business):
- Product features
- Customer support
To quantify qualitative data in this situation, apply a sentiment to each response. Start small and tag as either positive, negative, or neutral sentiments. At a fundamental level, people will either be happy, unhappy, or neutral about a feature or interaction with your brand.
Read each response and determine if this is a happy customer, a dissatisfied customer, or someone who doesn’t seem to care one way or the other. If you are unsure, code this answer as “Neutral.”
As you dive deeper into your data, you can expand on these three basic sentiments to make a full rating scale of responses which may, for example, include a rating scale for sentiment:
- Highly dissatisfied
- Somewhat dissatisfied
- Somewhat satisfied
- Very satisfied
Now that you have finished the coding process and have assigned sentiments or ratings to your qualitative data, you can use this information to generalize your data and look for trends.
For example:
- If you notice that you have primarily negative sentiments, you can deduce that people are generally unsatisfied with your brand or offerings. Then you can read deeper into the data to see the areas they are dissatisfied with and make changes to increase customer satisfaction.
- If you notice people are indicating an indifference in their responses (mostly threes on your coding scale), perhaps these are customers who may leave soon because you’re not giving them the solution to their problem. You can analyze the data deeper to determine how to increase customer satisfaction to increase the Average Customer Lifetime value and duration, thus improving your sentiment scores in your next survey.
You can also combine your qualitative data results with any quantitative data you may have to provide a more detailed analysis of your survey results .
Using spreadsheet software like Excel or Google Sheets for coding qualitative data works well due to the software’s built-in calculative abilities.
Here’s an example of how to code qualitative data based on written Google reviews in a spreadsheet:
Start by adding your column headings to your spreadsheet. Basic qualitative analysis requires three columns. In this case, it’ll be your written Google review, the category tags you want to assign, and a sentiment rating or score.
We suggest starting with just 3-5 tags at the maximum to get started. For ease and consistency, use the dropdown list functionality in Excel ( Data Validation in Google Sheets). Add a dropdown list of multi-select options for each category in Column B.
Your spreadsheet should look similar to this:

Now you are ready to begin adding your Google reviews to the spreadsheet. Add one review per cell in Column A:
In written responses like Google Reviews, one reviewer may mention several categories. For best results, highlight each category and include in the dropdown in column B:
Assign each piece of feedback a sentiment using a rating scale of your choosing . We usually find that 1-3 (Unhappy, Neutral, Happy) works well, but feel free to expand that to a rating system of 5 if you want more granular feedback.
Next, you want to look at each category individually to see which areas need improvement and which are performing well.
In the above example, calculate your average score percentage:
- Product Feedback: 5/5 + 3/5 = 4/5 average
- Price Feedback: 3/5 + 4/5 = 3.5/5 average
- Customer Service: 5/5 + 5/5 = 5/5 average
This tells us that your company has an excellent reputation for its customer service, but perhaps pricing could be improved to attract more customers. The product satisfaction rating is a good 80%, with room for improvement based on a deeper analysis of why customers don’t think your product is perfect.
While collecting and interpreting qualitative data, here are some tips to ensure your results are as accurate as possible:
Start Small
It’s best to test your qualitative coding and analysis on small sample sets before dedicating more considerable resources to your research. Start with a couple of high level category tags and sample data and try your methods first. We suggest using 10-20% of your survey data for testing.
Use Scales
Consider ways to use rating scales when analyzing qualitative data rather than just recording sentiment. After all, humans are not just happy and sad for no reason. For example, if you get the response “I like the service, but feel it’s overpriced,” you could quantify that by either:
- They like the product (sentiment analysis)
- It’s a 3/5 because they don’t think this price is fair (scale analysis).
By using a scale, you now have quantitative data that you can average and summarize.
Track Multiples
Look at each question or dataset to see what other data you can infer or assume about the responses. For example, if you asked how they liked your restaurant’s food, they responded with, “It was tasty, but it could have been better if the waiter was more friendly.” This answer provides feedback on the food quality and the staff. Based on this, you can code their response into two categories with individual sentiments.
Don’t overdo your tags and categories. You can use tags to go deeper into interpreting qualitative data, but unless you have the resources to analyze this level of detail, it likely won’t be helpful for you. Machine learning algorithms like Idiomatic and AI can help you analyze and summarize more tags and data.
Create tags based on themes, not wording
In most cases, the specific wording someone uses to describe your shop as dirty doesn’t matter. The fact that people think your storefront is filthy-looking is enough data to inform a business change or decision. People may describe “dirty” as dusty, grimy, or filthy, but they all mean the same thing.
When coding qualitative data like this, look for one word to encompass the sentiment of dirty, not each individual term used to describe it.
Qualitative data analysis software or machine learning algorithms and AI programs (like Idiomatic ) are the fastest way to code qualitative data and present you with actionable results. It can also help you determine the more accurate tags and sentiment rules.
Idiomatic can take your qualitative data and use its robust machine learning algorithms to do the hard work for you. You can input any mix of research data into this qualitative coding software. Your qualitative data analysis is done in a machine-learned, systematic way to provide consistently reliable results every time you add new data.
To learn more about using Idiomatic as your qualitative data analysis software, request an Idiomatic demo today.
Request a demo

Chris Martinez
Co-Chief Executive Officer | Growth
Chris is obsessed with pushing Idiomatic to move faster in providing value to customers. Prior to Idiomatic, he co-founded Glow (15+ Million users, 40 countries). He has a BS in Math and Computer Science, a JD, and an MBA from Stanford. Outside of work, he can typically be found cooking, playing basketball (or really any other sport), or traveling with his wife and three children. His favorite quote is “fear is the mind-killer” from the novel Dune.
The Coding Manual for Qualitative Researchers (3rd edition)
Qualitative Research in Organizations and Management
ISSN : 1746-5648
Article publication date: 12 June 2017
Wicks, D. (2017), "The Coding Manual for Qualitative Researchers (3rd edition)", Qualitative Research in Organizations and Management , Vol. 12 No. 2, pp. 169-170. https://doi.org/10.1108/QROM-08-2016-1408
Emerald Publishing Limited
Copyright © 2017, Emerald Publishing Limited
The Coding Manual for Qualitative Researchers addresses an important aspect of many qualitative research traditions, the process of attaching meaningful attributes (codes) to qualitative data that allows researchers to engage in a range of analytic processes (e.g. pattern detection, categorization and theory building). It is a book intended to “supplement introductory works in the subject” and provide an extensive collection of coding methods from a range of sources for a variety of purposes. It is a book that is probably best positioned to those in somewhere in the middle of the beginner-experienced continuum of qualitative researchers, especially to those looking for examples of different ways to analyze qualitative data.
Saldaña states that this manual “serves primarily as a reference work” rather than a monograph to be read cover to cover. This is a claim important for a prospective reader to understand, and one that I agree with to a certain extent. A good reference work needs to have widely understood content in order for readers to know what to look for, and in this way the primary organizing scheme of the book into chapters on first and second cycle coding methods (and subsequently into a multitude of subcategories) is difficult to understand without a high degree of familiarity with this terminology. The opening chapter does a good job of exemplifying different approaches to coding and clarifying related terminology (e.g. patterns, codifying, categorization and themes) in a way that is helpful to the novice qualitative researcher. Perhaps less helpful in this part of the manual is the quick reference to dozens of specific coding types that are elaborated upon in later chapters and defined in the glossaries contained in the book’s appendices. Despite what for me is too much material covered in only a surface way to start the manual, it is otherwise well organized, through and thoughtful.
Saldaña’s many examples are very helpful, showing how particular data segments can be coded. Where this was particularly helpful was in the otherwise unclear discussion of selecting the appropriate coding method(s) for a particular study to start Chapter 3. That chapter alone describes 33 choices of “first cycle coding methods,” those that happen during the initial stages of data analysis. Arguably it is difficult to provide a concise answer to that question, because quite obviously the decision rests on many factors related to the researcher and the phenomenon researched. It was therefore interesting to see a short example of how an interview excerpt could be coded using descriptive codes (what is being talked about), in vivo codes (derived from the actual language used) and process coding (conceptual actions relayed by participants), each producing different yet equally valid insights about qualitative data.
Another useful aspect of the manual is the discussion of how computer-aided qualitative data analysis software (CAQDAS) can be used, complete with screen shots from many of these programs. The companion website provides a wide range of online resources, particularly to the CAQDAS options available to researchers. I agree with Saldaña’s claim that manual data analysis processes are perfectly fine for small-scale projects, but can be less than efficient or manageable with larger qualitative data sets. I dislike seeing “manual coding” compared with “CAQDAS coding” because it suggests that a computer does the coding. What appears as an artificial distinction between manual and electronic coding largely disappears as examples are given and emphasis is given to the role of the researcher to provide analytic reflection.
Saldaña does a generally good job of balancing the art and science of coding. From early on in the manual, he makes it clear that coding is “primarily an interpretive act,” one that can be done in a variety of equally compelling ways. He effectively discusses the writing of analytic memos (Chapter 2) in a way that I think is helpful and inspirational for researchers, highlighting how good qualitative research is not only about using good/proper methods, but more importantly about good thinking. By providing a categorization of the ways in which qualitative data can be reflected upon, and indeed become part of a cyclical process of data analysis, readers of all types can likely find new and interesting ways to relate to their data that move them beyond simple description of what is being said and the production of a journalistic account of respondents.
The Coding Manual for Qualitative Researchers seems well positioned to a graduate student or researcher who is looking for a synthesis of the many extant approaches to analyzing qualitative data. Experienced researchers would no doubt glean some techniques and terminology from the manual, but likely ones that make marginal refinements to the approaches they already know and/or use. Novice qualitative researchers, on the other hand, will probably find this manual overwhelming and lacking in a thorough discussion of a manageable number of approaches to coding qualitative data and sometimes awkward integration of coding examples. Researchers and students less familiar with analyzing qualitative data would benefit from reading one of the many good books on the topic, for example David Silverman’s Doing Qualitative Research: A Practical Handbook (Sage), Pushkala Prasad’s Crafting Qualitative Research: Working in the Postpositivist Traditions (Routledge) or Jennifer Mason’s Qualitative Researching (Sage). For those in between, however, the range of examples, suggestions for additional readings, companion website and exercises/activities in the appendices should contribute to expanding the horizons of researchers, educators and students in the social sciences.
Related articles
All feedback is valuable.
Please share your general feedback
Report an issue or find answers to frequently asked questions
Contact Customer Support
- Tools and Resources
- Customer Services
- Affective Science
- Biological Foundations of Psychology
- Clinical Psychology: Disorders and Therapies
- Cognitive Psychology/Neuroscience
- Developmental Psychology
- Educational/School Psychology
- Forensic Psychology
- Health Psychology
- History and Systems of Psychology
- Individual Differences
- Methods and Approaches in Psychology
- Neuropsychology
- Organizational and Institutional Psychology
- Personality
- Psychology and Other Disciplines
- Social Psychology
- Sports Psychology
- Share This Facebook LinkedIn Twitter
Article contents
General coding and analysis in qualitative research.
- Michael G. Pratt Michael G. Pratt Carroll School of Management, Boston College
- https://doi.org/10.1093/acrefore/9780190236557.013.859
- Published online: 31 January 2023
Coding and analysis are central to qualitative research, moving the researcher from study design and data collection to discovery, theorizing, and writing up the findings in some form (e.g., a journal article, report, book chapter or book). Analysis is a systematic way of approaching data for the purpose of better understanding it. In qualitative research, such understanding often involves the process of translating raw data—such as interview transcripts, observation notes, or videos—into a more abstract understanding of that data, often in the form of theory. Analytical techniques common to qualitative approaches include writing memos, narratives, cases, timelines, and figures, based on one’s data. Coding often involves using short labels to capture key elements in the data. Codes can either emerge from the data, or they can be predetermined based on extant theorizing. The type of coding one engages in depends on whether one is being inductive, deductive or abductive. Although often confounded, coding is only a part of the broader analytical process.
In many qualitative approaches, coding and analysis occur concurrently with data collection, although the type and timing of specific coding and analysis practices vary by method (e.g., ethnography versus grounded theory). These coding and analytic techniques are used to facilitate the intuitive leaps, flashes of insight, and moments of doubt and discovery necessary for theorizing. When building new theory, care should be taken to ensure that one’s coding does not do undue “violence to experience”: rather, coding should reflect the lived experiences of those one has studied.
- qualitative methods
- grounded theory
- ethnography
- inductive research
You do not currently have access to this article
Please login to access the full content.
Access to the full content requires a subscription
Printed from Oxford Research Encyclopedias, Psychology. Under the terms of the licence agreement, an individual user may print out a single article for personal use (for details see Privacy Policy and Legal Notice).
date: 25 June 2024
- Cookie Policy
- Privacy Policy
- Legal Notice
- Accessibility
- [185.80.151.41]
- 185.80.151.41
Character limit 500 /500
Research, Digital, UX and a PhD.
A Guide to Coding Qualitative Data
Published September 18, 2014 by Salma Patel
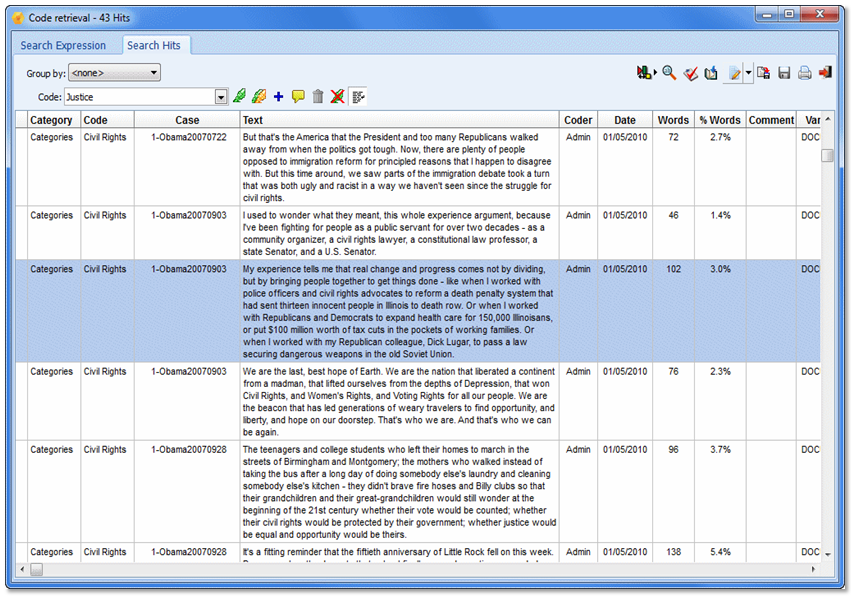
Coding qualitative data can be a daunting task, especially for the first timer. Below are my notes, which is a useful summary on coding qualitative data (please note, most of the text has been taken directly from The Coding Manual for Qualitative Researchers by Johnny Saldana ).
Background to Coding
A coding pattern can be characterised by:
- similarity (things happen the same way)
- difference (they happen in predictably different ways)
- frequency (they happen often or seldom)
- sequence (they happen in a certain order)
- correspondence (they happen in relation to other activities or events)
- causation (one appears to cause another)
A theme is an outcome of coding
Questions to consider when you are coding:
- what are people doing? What are they trying to accomplish?
- How, exactly, do they do this? What specific means and/or strategies do they use?
- How do members talk about, characterise, and understand what is going on?
- what assumptions are they making?
- what do I see going on here?
- what did I learn from these notes?
- why did I include them?
- what surprised me? (To track your assumptions)
- what intrigued me? (To track your positionality)
- what disturbed me? (To track the tensions within your value, attitude, and belief systems)
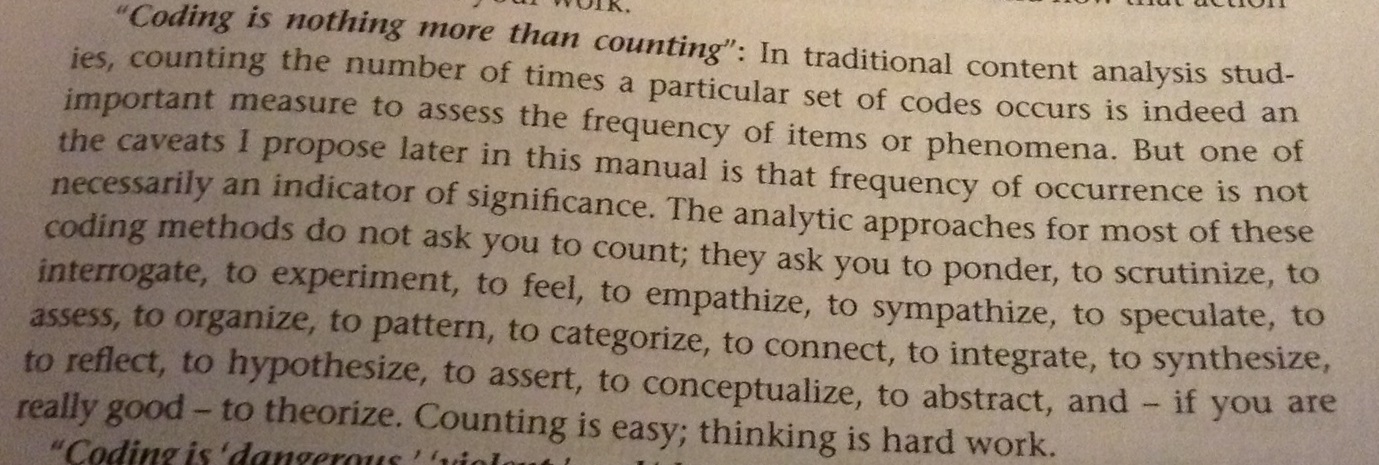
Writing Analytic Memos
Gordon-Finlayson (2010) emphasises that “coding is simply a structure on which reflection (via memo writing) happens. It is memo-writing that is the engine go grounded theory, not coding”. Glazer and Holton (2004) further clarify that “Memos present hypotheses about connections between categories and/or their properties and begin to integrate these connections with clusters of other categories to generate the theory”.
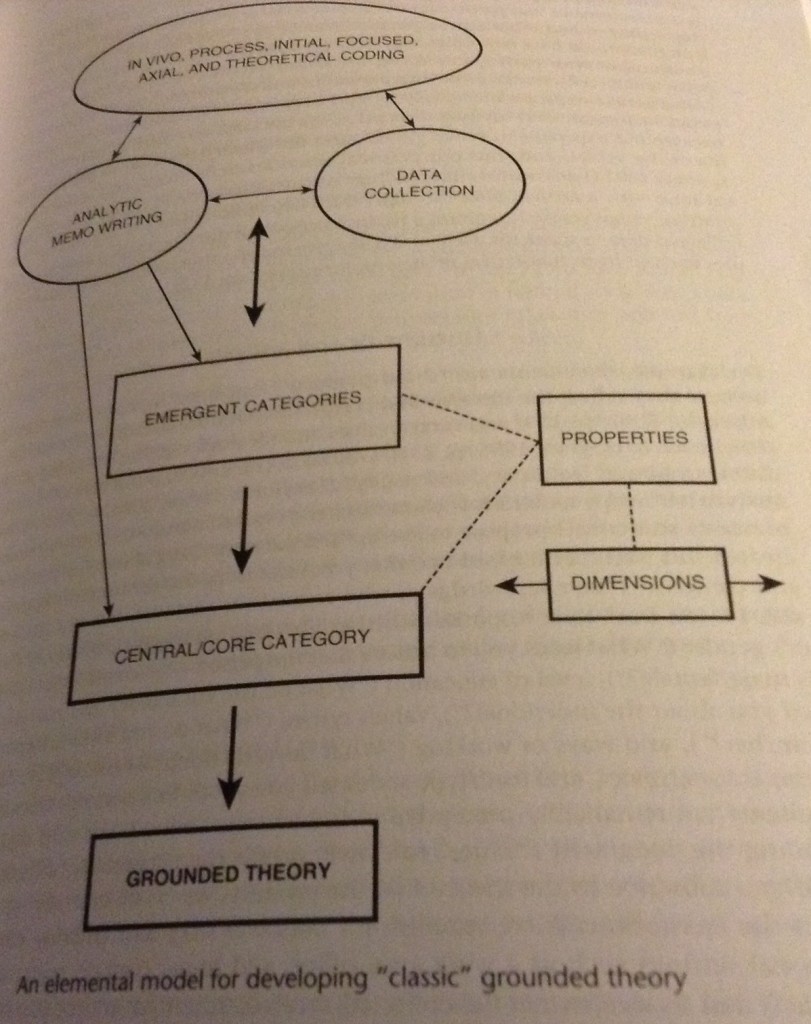
The coding cycles
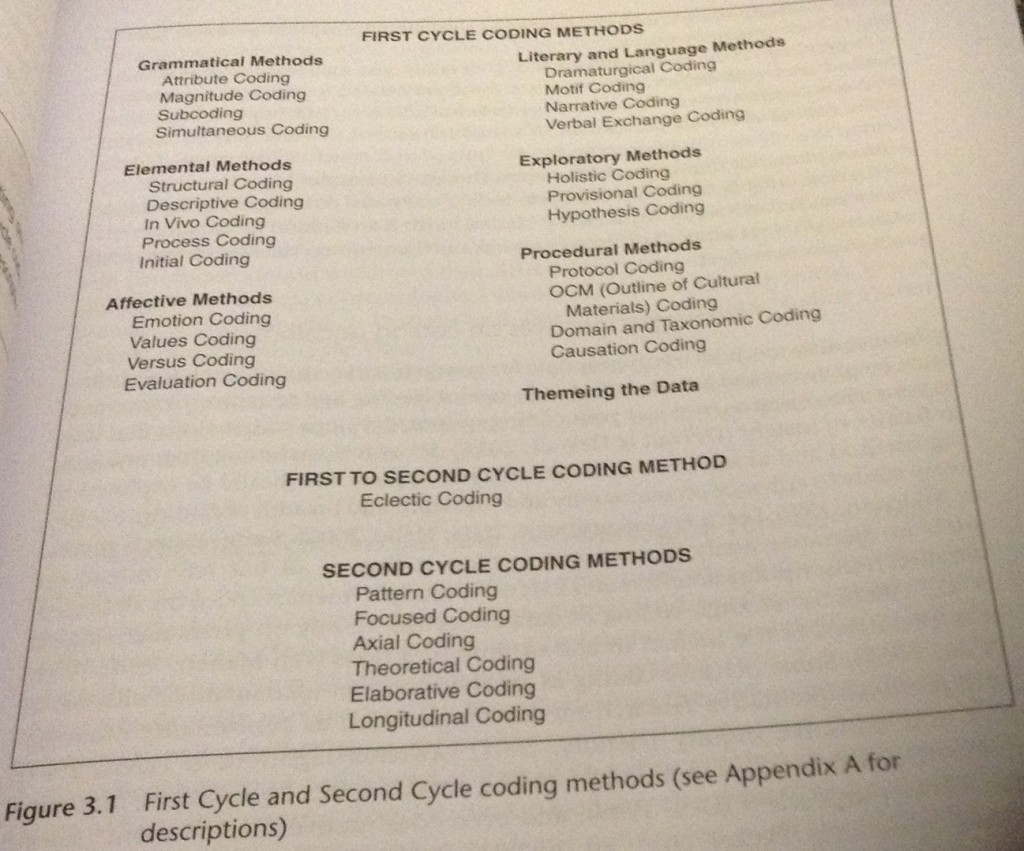
Depending on the qualitative coding method(s) you employ, the choice may have numerical conversion and transformation possibilities for basic descriptive statistics for mixed method studies.
First Cycle Coding
1. Grammatical Methods include
- attribute coding (essential information about the data and demographic characteristics of the participants for future management and reference)
- magnitude coding (applies alphanumeric or symbolic codes to data, to describe their variable characteristics such as intensity or frequency, example, Strongly (STR) Moderately (MOD) No opinions (NO). They can be qualitative, quantitative and/or nominal indicators to enhance description, and it’s a way of quantitizing and qualitizing data
- sub coding and simultaneous coding.
2. Elemental methods are primary approaches to data analysis. They include:
- structural coding is a question-based code that acts as a labelling and index device, allowing researchers to quickly access data likely to be relevant to a particular analysis from a larger data set. It’s used as a categorisation technique for further qualitative data analysis.
- descriptive coding summarises in a word or noun the basic topic of a passage of qualitative data.
- In Vivo Coding refers to coding with a word or short phrase from the actual language found in the qualitative data record.
- Process coding uses gerunds (“-ing” words) exclusively to connote action in the data.
- Initial Coding is breaking down qualitative data into discrete parts, closely examining them, and comparing them for similarities and differences.
3. Affective methods investigate subjective qualities of human experience (eg emotions, values, conflicts, judgements) by directly acknowledging and naming those experiences. They include:
- Emotion coding labels the emotion recalled or experienced
- Values coding assess a participant’s integrated value, attitude, and belief systems. (side note: Questionnaires and surveys such as Likert scales and semantic differentials, are designed to collect and measure a participant’s values, attitudes, and beliefs about selected subjects).
- Versus Coding acknowledges that humans are frequently in conflict, and the codes identify which individuals, groups, or systems are struggling for power.
- Evaluation Coding focuses on how we can analyse data that judge the merit and worth of programs and policies.
4. Literary and Language Methods are a contemporary approach to the analysis of Oral communication. They include Dramaturgical Coding, Motif Coding, Narrative coding and Verbal Exchange Coding, and all explore underlying sociological, psychological and cultural constructs.
5. Exploratory Methods are preliminary assignment of codes to the data, after which the researcher might proceed to more specific First Cycle or Second Cycle coding methods.
- Holistic Coding applies a single code to each large unit of data in the corpus to capture a sense of the overall contents and the possible categories that may develop.
- Provisional Coding begins with a “start list” of researcher- generated codes based on what preparatory investigation suggest might appear in the data before they are analysed.
- Hypothesis Coding applies researcher-developed “hunches” of what might occur in the data before or after they have been initially analysed.
6. Procedural Methods consist of pre- established systems or very specific ways of analysing qualitative data. They include:
- Protocol Coding is coding data according to a pre-established, recommended, standardised or prescribed system.
- OCM (Outline of Cultural Materials) Coding is a systematic coding system for ethnographic studies.
- Domain and Taxonomic Coding is an ethnographic method for discovering the cultural knowledge people use to organise their behaviours and interpret their experiences.
- Causation coding is to locate, extract, and/or infer causal beliefs from qualitative data.
Code Mapping and Landscaping
Code Mapping is categorising and organising the codes, and code landscaping is presenting these codes in a visual manner, for example by using a Wordle graphic.
Operational Model Diagramming can be used to map or diagram the emergent sequences or networks of your codes and categories related to your study in a sophisticated way.
Second Cycle Coding
Second cycle coding is reorganising and condensing the vast array of initial analytic details into a “main dish”. They include:
1. Pattern coding is a way of grouping summaries into a smaller number of sets, themes, or constructs.
2. Focused coding searches for the most frequent or significant codes. It categorises coded data based on thematic or conceptual similarity
3. Axial coding describes a category’s properties and dimensions and explores how the categories and subcategories relate to each other.
4. Theoretical coding progresses towards discovering the central or core category that identifies the primary theme of the research
5. Elaborative coding builds on a previous study’s codes, categories, and themes while a current and related study is underway. This method employs additional qualitative data to support or modify the researcher’s observations developed in an earlier project.
6. Longitudinal coding is the attribution of selected change processes to qualitative data collected and compared across time.
After Second Cycle Coding
Code weaving is the actual integration of key code words and phrases into narrative form to see how the puzzle pieces for together. Codeweave the primary codes, categories, themes, and/or concepts of your analysis into as few sentences as possible. Try writing several variations to investigate how the items might interrelate, suggest causation, indicate a process, or work holistically to create a broader theme. Search for evidence in the data that supports your summary statements, and/or disconfirming evidence that suggests revision of your statements.
From Coding to Theorising
A social science theory has three main characteristics: it predicts and controls action through an if-then logic; explains how and/or why something happens by stating it’s cause(s); and provides insights and guidance for improving social life.
The stage at which I seem to find a theory emerging in my mind is when I create categories of categories.
Use categories and analytic memos as sources of theory.
If I cannot develop a theory, then I will be satisfied with my construction of a key assertion, a summative and data supported statement about the particulars of a research study, rather than generalisable and transferable meanings of my findings to other settings and contexts.
Findings at a glance can be presented as follows:
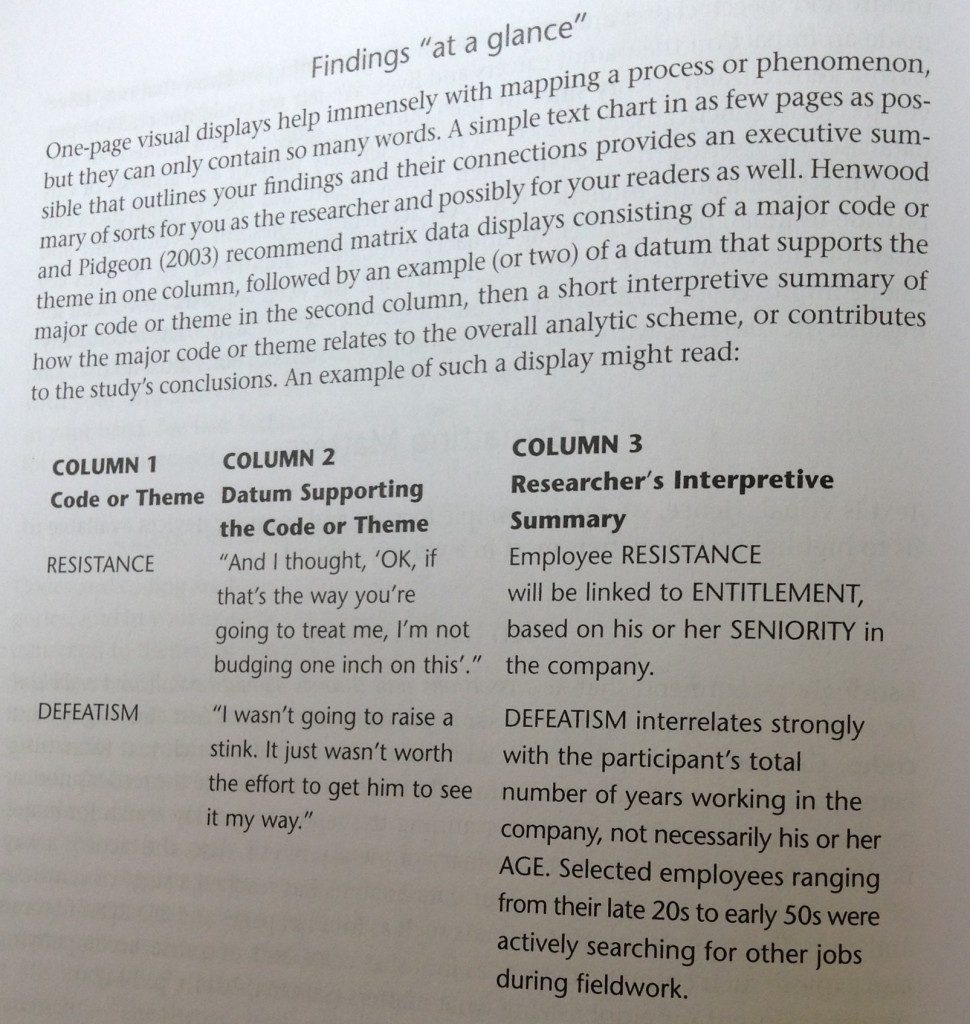
The coding journey should be noted in the analytical memos and discussed in your dissertation.
Related Posts:
- Thematic Analysis - how do you generate themes?
- Saturation in qualitative research samples
- Performance Analysis Workshop
- Notes from workshop (GDS): How to carry out basic…
- Forward Research Plan - Childminder service in public beta
Published in Headline Qualitative Research Research Methods
- coding data
- coding qualitative data
- qualitative research
- research design
10 Comments
Very helpful article. Can you please list the references you mentioned in the article? which book are you refering to explain the coding types?
Thanks. Which specific reference would you like? I can look it up in the book.
Same question. You show a number of books in the various images, none of which look familiar. Could you list/cite those resources? That would be most helpful
The reference is mentioned at the top of the article. It links to the book these images are all from. See here: https://www.amazon.co.uk/gp/product/1446247376 (Sadana, 2012)
Best wishes, Salma
I also got a a question regarding the second cycle coding. Is it possible to use multiple coding forms? For example, can I code my interviews by using pattern coding, focused coding and axial coding? Or would I have to decide on one?
Yes Lara, you can use multiple coding forms. Just keep a note of it for your write up.
Thank you so much, Salma Patel, for taking the time to lay this critical and complex process out with all the illustrations. It’s so helpful to me. May your work and life continue to flourish.
thank you so much Ms. Patel
great article. thanks a lot
Great article. Very helpful! Can you point us to any examples of how researchers have coded data using some of these techniques? It would be helpful to see this in action, especially in helping understand how these different aspects of coding sit side by side in the analytical process. Thanks again!
Leave a Reply Cancel reply
Your email address will not be published. Required fields are marked *
Save my name, email, and website in this browser for the next time I comment.
- Chapter 4: Home
- Qualtrics Survey Tool
- Statistics Help This link opens in a new window
- Statistics and APA Format This link opens in a new window
Analysis and Coding Example: Qualitative Data
- Trustworthiness of Qualitative Data
- Hypothesis Testing This link opens in a new window
Jump to DSE Guide
The following is an example of how to engage in a three step analytic process of coding, categorizing, and identifying themes within the data presented. Note that different researchers would come up with different results based on their specific research questions, literature review findings, and theoretical perspective.
There are many ways cited in the literature to analyze qualitative data. The specific analytic plan in this exercise involved a constant comparative (Glaser & Strauss, 1967) approach that included a three-step process of open coding, categorizing, and synthesizing themes. The constant comparative process involved thinking about how these comments were interrelated. Intertwined within this three step process, this example engages in content analysis techniques as described by Patton (1987) through which coherent and salient themes and patterns are identified throughout the data. This is reflected in the congruencies and incongruencies reflected in the memos and relational matrix.
Step 1: Open Coding
Codes for the qualitative data are created through a line by line analysis of the comments. Codes would be based on the research questions, literature review, and theoretical perspective articulated. Numbering the lines is helpful so that the researcher can make notes regarding which comments they might like to quote in their report.
It is also useful to include memos to remind yourself of what you were thinking and allow you to reflect on the initial interpretations as you engage in the next two analytic steps. In addition, memos will be a reminder of issues that need to be addressed if there is an opportunity for follow up data collection. This technique allows the researcher time to reflect on how his/her biases might affect the analysis. Using different colored text for memos makes it easy to differentiate thoughts from the data.
Many novice researchers forgo this step. Rather, they move right into arranging the entire statements into the various categories that have been pre-identified. There are two problems with the process. First, since the categories have been listed open coding, it is unclear from where the categories have been derived. Rather, when a researcher uses the open coding process, he/she look at each line of text individually and without consideration for the others. This process of breaking the pieces down and then putting them back together through analysis ensures that the researcher consider all for the data equally and limits the bias that might introduced. In addition, if a researcher is coding interviews or other significant amounts of qualitative data it will likely become overwhelming as the researcher tries to organize and remember from which context each piece of data came.
|
|
|
| Building | |
| Resources, Modernization, Resources | |
| Services, Building | |
| Instructional Quality | |
| Leadership Interaction, Support, Evaluation | |
| Uncertainty, Decision Making, Responsibilities | |
|
| |
| Responsibilities, Equity | |
| Conflict, Lack of Data | |
| Decision Making, Responsibilities | |
| Lack of Data, Responsibilities | |
| Focus on Students, Quality Instruction | |
| Conflict | |
| Uncertainty, Instructional Clarification. | |
| Decision Making | |
| Technology Resources | |
| Conflict, New versus Veteran | |
| Support | |
| Conflict | |
| Quality Instruction | |
| Support, Evaluation, New versus Veteran | |
| Quality Instruction, New versus Veteran | |
| Inequities | |
| Confict | |
| Respect | |
|
| |
| Equality | |
| Quality Instruction, Requirements | |
| Respect, Resources | |
| Requirements, Quality Instruction | |
| Inequities, Conflict |
Step 2: Categorizing
To categorize the codes developed in Step 1 , list the codes and group them by similarity. Then, identify an appropriate label for each group. The following table reflects the result of this activity.
|
|
|
|
|
|
|
|
|
|
|
|
|
|
|
|
|
|
Step 3: Identification of Themes
In this step, review the categories as well as the memos to determine the themes that emerge. In the discussion below, three themes emerged from the synthesis of the categories. Relevant quotes from the data are included that exemplify the essence of the themes.These can be used in the discussion of findings. The relational matrix demonstrates the pattern of thinking of the researcher as they engaged in this step in the analysis. This is similar to an axial coding strategy.
Note that this set of data is limited and leaves some questions in mind. In a well-developed study, this would just be a part of the data collected and there would be other data sets and/or opportunities to clarify/verify some of the interpretations made below. In addition, since there is no literature review or theoretical statement, there are no reference points from which to draw interferences in the data. Some assumptions were made for the purposes of this demonstration in these areas.
T h eme 1: Professional Standing
Individual participants have articulated issues related to their own professional position. They are concerned about what and when they will teach, their performance, and the respect/prestige that they have within the school. For example, they are concerned about both their physical environment and the steps that they have to take to ensure that they have the up to date tools that they need. They are also concerned that their efforts are being acknowledged, sometimes in relation to their peers and their beliefs that they are more effective.
Selected quotes:
- Some teachers are carrying the weight for other teachers. (demonstrates that they think that some of their peers are not qualified.)
- We need objective observations and feedback from the principal (demonstrates that they are looking for acknowledgement for their efforts. Or this could be interpreted as a belief that their peers who are less qualified should be acknowledged).
- There is a lack of support for individual teachers
Theme 2: Group Dynamics and Collegiality
Rationale: There are groups or clicks that have formed. This seems to be the basis for some of the conflict. This conflict is closely related to the status and professional standing themes. This theme however, has more to do with the group issues while the first theme is an individual perspective. Some teachers and/or subjects are seen as more prestigious than others. Some of this is related to longevity. This creates jealously and inhibits collegiality. This affects peer-interaction, instruction, and communication.
- Grade level teams work against each other rather than together.
- Each team of teachers has stereotypes about the other teams.
- There is a division between the old and new teachers
Theme 3: Leadership Issues
Rationale: There seems to be a lack of leadership and shared understanding of the general direction in which the school will go. This is also reflected in a lack of two way communications. There doesn’t seem to be information being offered by the leadership of the school, nor does there seem to be an opportunity for individuals to share their thoughts, let alone decision making. There seems to be a lack of intervention in the conflict from leadership.
- Decisions are made on inaccurate information.
- We need consistent decisions about school rules

Glaser, B.G., & Strauss, A. (1967). The discovery of grounded theory: Strategies for qualitative research . Chicago, IL: Aldine.
Patton, M. Q. (1987). How to use qualitative methods in evaluation . Newbury Park, CA: Sage Publications.
- << Previous: Statistics and APA Format
- Next: Trustworthiness of Qualitative Data >>
- Last Updated: Apr 19, 2024 3:09 PM
- URL: https://resources.nu.edu/c.php?g=1007180
© Copyright 2024 National University. All Rights Reserved.
Privacy Policy | Consumer Information
loading page
- Download ZIP
- Download LaTeX
- Download JATS XML
- Track citations
- Fork (make a copy)
Corresponding Author: [email protected]
Peer review timeline
Your Data, Expertly Coded
Get your data meticulously hand-coded by PhD-qualified research specialists, who understand exactly what markers want.
")
How It Works
Getting your qualitative data carefully coded is as easy as 1-2-3 .

What Exactly You Get
You’ll receive 3 core deliverables when you work with us:

We can code data for various types of qualitative analyses, including (but not limited to) content analysis, thematic analysis, narrative analysis and discourse analysis.
The Grad Coach Difference
Three things make Grad Coach the obvious choice for qualitative coding:

100% Manual Coding
Your data will be manually coded by PhD-qualified, seasoned qualitative researchers, that have a deep understanding of English language usage. No AI or automation here.

Context-Sensitive Coding
All your data will be coded against the backdrop of your research aims and objectives, as well as your intended analysis method, ensuring you have a highly relevant coding structure.

Text & Audio-Based Coding
If you’re working with audio recordings and haven’t yet transcribed them, our team of seasoned transcribers will carefully transcribe your data, completely manually.
Fast-track your coding, today
Get a quick, no-obligation quote to have your data coded by experts.
Or book a free, no-obligation consultation with a friendly Coding Specialist.

Frequently Asked Questions
Below are some of the most popular coding-related questions we get asked.
Qualitative Coding
Do you code manually or with software.
To ensure the highest quality of coding, we code all content completely manually (in other words, it's done by humans).
Coding is handled by our experienced, highly-qualified team of qualitative research specialists. All our coders have extensive academic experience, are native English speakers (from the US, UK and SA) and have worked on numerous research projects.
We do not use any automation or software-based coding tools, as these tools can never be as accurate and effective as human-based coding. Quality is our priority.
Can I see a sample/example of your coding?
Yes, certainly. You can download a sample coding project here .
What format do you provide the coded content in?
We code all content in Word , using the comments feature to label the respective words and phrases. We then export all coded content into an Excel spreadsheet for easy navigation, filtering and sorting. You can view a sample of this here .
Can your coding be imported into NVivo, ATLAS.ti, MaxQDA, etc.?
The summary Excel spreadsheet that we provide ( see example here ) can be imported into most qualitative analysis software packages. However, you should check the import capabilities of your chosen software beforehand, to ensure compatibility.
My interviews aren't transcribed yet. Can you code these?
We will need transcribed versions of your interviews. If you need us to transcribe, we do offer a transcription service in addition to coding. We will quote you separately for this service if needed.
What is the process if I work with you?
The typical engagement process is as follows:
First, we'll have an initial discussion (over email or Google Meet ) to understand your project and specific requirements. Once we have these details, we'll provide you with a firm quote and timeline.
2 - Project kickoff
You'll send us your data (e.g., interview transcripts), along with the details regarding your research aims and objectives, research questions and methodology, so that we can assess the best possible approach to coding your data.
3 - Approval and execution
We'll review all the information and propose a coding structure/approach. Once you've agreed to this, we'll get to work coding and send you the completed project as per the agreed timeline.
How long will it take to get my data coded?
This depends on a few factors, including the size and complexity of your dataset, as well as our capacity at your time of enquiring. We have completed coding projects in as little as 24 hours , but a typical project requires at least a few days .
Feel free to request a quotation, at which point we'll also confirm our availability/timelines.
How much does coding cost?
Our fee is based on the quantity and length of the interview transcripts (or any other text-based data set).
For a rough indication of typical costs, please visit the pricing page . For a firm quotation, please email us or book a free initial consultation .
What format do you require the data to be in?
We code in Microsoft Word , so please send us your data in this format (i.e., DOCX). If your documents are in another format, we can convert them to Word format, but this will impact the turnaround time.
Can you code my interviews one by one, as I complete them?
We can, but we don't recommend it. We recommend that you wait until you have your complete data set before starting with the coding process. Coding is an iterative process, and so we need to review the entire data set (e.g., all interviews) to ensure a comprehensive coding structure.
Should I include my interview questions in my transcripts?
Yes, we need these in order to understand the context of each response.
Can you assist with the qualitative analysis as well?
We can assist you in undertaking your analysis on a coaching basis , but this is separate from the coding service. If you would like guidance through the analysis phase, please book an initial consultation with one of our friendly coaches to discuss how we can help you.
Please keep in mind that the analysis itself needs to be your own work. We can coach you through the process step by step and provide detailed feedback regarding your writing, but we cannot write up your analysis for you, as that would constitute academic misconduct.
I still have questions…
No problem. Feel free to email us or book an initial consultation to discuss.
Still have a question? No problem – feel free to email us or book a consultation .
What our clients say
We've worked 1:1 with 3000+ students . Here's what some of them have to say:
David's depth of knowledge in research methodology was truly impressive. He demonstrated a profound understanding of the nuances and complexities of my research area, offering insights that I hadn't even considered. His ability to synthesize information, identify key research gaps, and suggest research topics was truly inspiring. I felt like I had a true expert by my side, guiding me through the complexities of the proposal.
Cyntia Sacani (US)
I had been struggling with the first 3 chapters of my dissertation for over a year. I finally decided to give GradCoach a try and it made a huge difference. Alexandra provided helpful suggestions along with edits that transformed my paper. My advisor was very impressed.
Tracy Shelton (US)
Working with Kerryn has been brilliant. She has guided me through that pesky academic language that makes us all scratch our heads. I can't recommend Grad Coach highly enough; they are very professional, humble, and fun to work with. If like me, you know your subject matter but you're getting lost in the academic language, look no further, give them a go.
Tony Fogarty (UK)
So helpful! Amy assisted me with an outline for my literature review and with organizing the results for my MBA applied research project. Having a road map helped enormously and saved a lot of time. Definitely worth it.
Jennifer Hagedorn (Canada)
Everything about my experience was great, from Dr. Shaeffer’s expertise, to her patience and flexibility. I reached out to GradCoach after receiving a 78 on a midterm paper. Not only did I get a 100 on my final paper in the same class, but I haven’t received a mark less than A+ since. I recommend GradCoach for everyone who needs help with academic research.
Antonia Singleton (Qatar)
I started using Grad Coach for my dissertation and I can honestly say that if it wasn’t for them, I would have really struggled. I would strongly recommend them – worth every penny!
Richard Egenreider (South Africa)
Kickstart Your Coding
Get a no-obligation quotation and timeline for your project.
Alternatively, book a free consultation with a friendly Coding Specialist.
Qualitative Research Design
Ai generator.

Qualitative Research Design is a method focused on understanding and interpreting the experiences of individuals or groups. Unlike quantitative research , which quantifies data and identifies patterns through statistical analysis, Qualitative Research Design explores phenomena in depth using interviews, focus groups, and observations. This approach gathers rich narratives that provide insights into thoughts, feelings, and behaviors, uncovering underlying reasons and motivations. Essential in fields like social sciences, education, and health, a strong Qualitative Research Proposal or Qualitative Research Plan must carefully consider the Research Design and relevant Research Terms for a comprehensive approach.
What is Qualitative Research Design?
Qualitative Research Design is a method that aims to understand and interpret the meaning and experiences of individuals or groups. It employs in-depth techniques like interviews, focus groups, and observations to gather detailed, rich narratives. Unlike quantitative research, which uses statistical analysis to identify patterns, qualitative research seeks to uncover the underlying reasons and motivations behind thoughts, feelings, and behaviors.
Types of Qualitative Research Design
1. ethnography.
Ethnography involves the detailed study of cultures or social groups through direct observation and participation. Researchers immerse themselves in the group’s daily life to understand their customs, behaviors, and social interactions. This method is often used to study communities, workplaces, or organizations. Example : Observing and interviewing members of a remote community to understand their social practices and traditions.
2. Grounded Theory
Grounded theory aims to generate a theory grounded in the data collected from participants. Researchers gather data through interviews, observations, and other methods, then use coding techniques to develop a theory. This approach is useful for studying processes, actions, and interactions, such as developing a theory on how people cope with job loss. Example : Analyzing interviews with employees to develop a theory about workplace motivation.
3. Focus Groups
Focus groups involve guided discussions with a small group of participants to explore their perceptions, opinions, and attitudes towards a particular topic. This method allows researchers to gather a wide range of insights and observe group dynamics. Focus groups are commonly used in market research, social science studies, and product development. Example : Conducting focus groups with parents to understand their views on remote learning during the COVID-19 pandemic.
4. Interviews
Interviews are one-on-one conversations between the researcher and the participant, designed to gather in-depth information on the participant’s experiences, thoughts, and feelings. Interviews can be structured, semi-structured, or unstructured, allowing flexibility in exploring the research topic. This method is widely used across various qualitative research studies. Example : Conducting semi-structured interviews with veterans to explore their reintegration experiences into civilian life.
5. Narrative Research
Narrative research focuses on the stories and personal accounts of individuals. Researchers collect narratives through interviews, journals, letters, or autobiographies and analyze them to understand how people make sense of their experiences. This type of research might explore life stories, personal journeys, or historical accounts. Example : Collecting and analyzing life stories of refugees to understand their migration experiences.
6. Action Research
Action research is a participatory approach that involves researchers and participants working together to address a problem or improve a situation. This method focuses on practical solutions and often includes cycles of planning, action, observation, and reflection. It is commonly used in educational settings to improve teaching practices, school policies, or community development projects. Example : Teachers working together to implement and assess a new curriculum in their school.
Qualitative Research Design Methods
| Method | Data Collection | Focus | Example |
|---|---|---|---|
| Case Study | Interviews, documents | Single case analysis | Impact of teaching method |
| Ethnography | Participant observation | Cultural understanding | Tribal community practices |
| Grounded Theory | Interviews, observations | Theory development | Coping with chronic illness |
| Phenomenology | In-depth interviews | Lived experiences | Parental grief |
| Narrative Research | Life stories, interviews | Personal narratives | Refugee resettlement stories |
| Focus Groups | Group discussions | Group perspectives | Teenagers’ views on social media |
| Content Analysis | Text, media analysis | Patterns and themes | Media portrayal of mental health |
Interviews are one-on-one conversations designed to gather in-depth information about a participant’s experiences, thoughts, and feelings. They can be structured, semi-structured, or unstructured, allowing flexibility in exploring topics. Example : Semi-structured interviews with veterans to explore their reintegration experiences into civilian life.
Focus Groups
Focus groups involve guided discussions with small groups to explore their perceptions, opinions, and attitudes on a topic. This method gathers diverse insights and observes group dynamics. Example : Focus groups with parents to understand their views on remote learning during the COVID-19 pandemic.
Observational Studies
Observational studies involve systematically watching and recording behaviors and interactions in natural settings without interference. Example : Observing children in a playground to study social development and peer relationships.
Discussion Boards
Discussion boards are online forums where participants post responses and engage in discussions. This method collects data from participants in different locations over time. Example : Analyzing posts on a discussion board for chronic illness patients to understand their coping strategies and support systems.
Difference between Qualitative Research vs. Quantitative Research
| Aspect | Qualitative Research | Quantitative Research |
|---|---|---|
| Explores phenomena through non-numerical data, focusing on understanding meanings, experiences, and concepts. | Investigates phenomena through numerical data, focusing on measuring and quantifying variables. | |
| Interviews, focus groups, observations, document analysis. | Surveys, experiments, questionnaires, existing statistical data. | |
| Non-numerical, descriptive data (words, images, objects). | Numerical data (numbers, statistics). | |
| Thematic analysis, content analysis, narrative analysis. | Statistical analysis, mathematical modeling. | |
| Gain in-depth insights and understand complexities of human behavior and social phenomena. | Test hypotheses, measure variables, and determine relationships or effects. | |
| Studying cultural practices, exploring personal experiences, understanding social interactions. | Examining the effectiveness of a new drug, analyzing survey results, studying demographic trends. | |
| – Provides detailed and rich data. – Captures participants’ perspectives and context. – Flexible and adaptive to new findings. | – Allows for hypothesis testing. – Results can be generalized to larger populations. – Can establish patterns and predict outcomes. |
Characteristics of Qualitative Research Design
- Naturalistic Inquiry: Conducted in natural settings where participants experience the issue or phenomenon under study.
- Contextual Understanding: Emphasizes understanding the cultural, social, and historical contexts of participants.
- Participant Perspectives: Prioritizes the views, feelings, and interpretations of participants.
- Flexibility and Adaptiveness: Designs are flexible and can be adjusted as new insights emerge.
- Rich, Descriptive Data: Collects detailed data in words, images, and objects for comprehensive understanding.
- Inductive Approach: Develops theories and patterns from the data collected rather than testing predefined theories.
- Emergent Design: Research design evolves during the study based on emerging themes and insights.
- Multiple Data Sources: Uses various data sources like interviews, focus groups, observations, and document analysis.
- Subjectivity and Reflexivity: Researchers acknowledge their influence on the research process and examine their biases and assumptions.
- Holistic Perspective: Considers the entire phenomenon and its complexity, looking at interrelated components.
- Iterative Process: Data collection and analysis occur simultaneously in an iterative manner.
- Ethical Considerations: Ensures informed consent, confidentiality, and sensitivity to participants’ needs and well-being.
- Detailed Reporting: Results are reported in a detailed narrative style, often using direct quotes from participants.
How to Find Qualitative Research Design
1. identify the research problem.
Define the specific problem or phenomenon you want to study. For example, you might explore the experiences of first-generation college students.
2. Conduct a Literature Review
Review existing research to understand what has been studied and identify gaps. This helps to build a foundation for your research.
3. Formulate Research Questions
Create open-ended questions to guide your study. Example: “What challenges do first-generation college students face?”
4. Choose a Qualitative Research Approach
Select a methodology that fits your research question, such as phenomenology, grounded theory, ethnography, case study, or narrative research.
5. Select the Research Setting
Decide where you will conduct your study, such as a university campus or online forums relevant to your topic.
6. Identify and Recruit Participants
Determine criteria for participant selection and recruit individuals who meet these criteria, such as first-generation college students.
7. Choose Data Collection Methods
Select methods like interviews, focus groups, observations, or document analysis to gather rich data.
8. Collect and Analyze Data
Gather your data and analyze it by identifying patterns and themes. Use coding and software tools if necessary.
9. Validate Findings
Ensure the credibility of your research through techniques like triangulation, member checking, and peer debriefing.
FAQ’s
How does qualitative research differ from quantitative research.
Qualitative research focuses on understanding meaning and experiences, while quantitative research measures variables and uses statistical analysis to test hypotheses.
What is the purpose of qualitative research?
The purpose is to gain in-depth insights into people’s behaviors, motivations, and social interactions to understand complex phenomena.
What methods are commonly used in qualitative research?
Common methods include interviews, focus groups, participant observation, and content analysis of texts and media.
What is a case study in qualitative research?
A case study is an in-depth exploration of a single case or multiple cases within a real-life context to uncover detailed insights.
What is narrative research in qualitative research?
Narrative research explores the stories and personal accounts of individuals to understand how they make sense of their experiences.
How is data analyzed in qualitative research?
Data analysis involves coding and categorizing data to identify patterns, themes, and meanings, often using software like NVivo or manual methods.
What is the role of the researcher in qualitative research?
The researcher acts as a primary instrument for data collection and analysis, often engaging closely with participants and their contexts.
What are the strengths of qualitative research?
Strengths include rich, detailed data, the ability to explore complex issues, and flexibility in data collection and analysis.
What are the limitations of qualitative research?
Limitations include potential researcher bias, time-consuming data collection, and challenges in generalizing findings to larger populations.
How is validity ensured in qualitative research?
Validity is ensured through strategies like triangulation, member checking, prolonged engagement, and reflexivity to enhance credibility and trustworthiness.
Text prompt
- Instructive
- Professional
10 Examples of Public speaking
20 Examples of Gas lighting
Search Google Appliance
- Blackboard Learn
- People Finder
Institute for Social Science Research
Registration closed: online issr summer methodology workshop | introduction to nvivo 14 for mac and windows: uploading, coding, and analyzing qualitative data | eric griffith & erica kowsz (workshop 2).
REGISTRATION CLOSED.
Description: This three day (12-hour) workshop will get you up and running with coding and analyzing your qualitative data in NVivo 14 for Mac and Windows.
The first day will focus on the basics: importing, organizing, and beginning to code your data (text documents, surveys, web pages, videos and audio). The second day, we'll discuss linking categorical data (e.g. demographic information) and how to effectively integrate it into your project/analyses. The third day will focus on analysis -- we will discuss the various types of queries and when to implement them.
Instructors: Eric Griffith and Erica Kowsz
Dr. Erica Kowsz is a teacher and researcher, who loves mentoring students and faculty in research design and data analysis methods. After defending her dissertation in the Department of Anthropology at UMass Amherst in December 2021, she has taken on a new role as Assistant Director for Fellowships at Wesleyan University’s Fries Center for Global Studies, where she also teaches senior undergraduates pursuing the Center's Global Engagement Minor. Her own research combines ethnography, policy and legal analysis, and archival work, so she has extensive experience working with multiple data types within qualitative data analysis software.
Dr. Eric Griffith received his Ph.D. in anthropology from the University of Massachusetts Amherst, as well as an MA in psychology from Boston University. He completed his dissertation fieldwork in central Mexico, focusing on the experiences of familial caregivers for people living with Alzheimer’s disease. Eric’s research interests include biocultural anthropology, dementia, cognitive aging, health disparities, and mixed methods research. As a postdoctoral fellow with the Samuel DuBois Cook Center on Social Equity at Duke University, Eric is working on the NIH-funded project “The influence of religion/spirituality on Alzheimer’s Disease and its related dementias (ADRD) for African Americans."
Questions? For more information about this or any of the ISSR Summer Methodology Workshops, please contact ISSR Director of Research Methods Programs Jessica Pearlman ( [email protected] ).
REGISTRATION INFORMATION | 12-HOUR WORKSHOP
Important: If you are registering for more than one workshop, please verify that all workshops are in your cart with the correct institutional and career status selected, for accurate pricing .
Five College Students and Faculty
- Five College Undergraduate and Graduate Students and Postdocs: $150/person
- Five College Faculty & Staff: $270/person
Non-Five College Students and Faculty
- Non-Five College Undergraduate and Graduate Students and Postdocs: $300/person
- Non-Five College Faculty, Staff & Other Professionals: $420/person
Registration note: The Five Colleges include: UMass Amherst, Amherst College, Hampshire College, Mount Holyoke College, and Smith College. Faculty, students and staff from University of Massachusetts Boston, Dartmouth and Lowell campuses and UMass Chan Medical School pay the five college rates. Registration closes for each workshop 2 full business days prior to the start date. If paying with departmental funds, contact Sue Falcetti ( [email protected] ).
Cancellation note: In cases where enrollment is 5 or less, we reserve the right to cancel the workshop. In cases where the registrant cancels prior to the workshop, a full refund will be given with two weeks notice, and 50% refund will be given with one week notice. We will not be able to refund in cases where registrant does not notify us of cancellation at least one week prior to the beginning date of the workshop.
- Research Methodology
- Data & Software
- Events - Other ISSR Workshops
©2024 University of Massachusetts Amherst · Site Policies · Site Contact
The value of Generative AI for Qualitative Research: A Pilot Study
This mixed methods approach study investigates the potential of introducing Generative AI (ChatGPT 4 and Bard) as part of a deductive qualitative research design that requires coding, focusing on possible gains in cost-effectiveness, coding throughput time and inter-coder reliability (Cohen’s Kappa). This study involved semi-structured interviews with five domain experts and analyzed a dataset of 122 respondents that required categorization into six pre-defined categories. The results from using Generative AI coders were compared with those from a previous study where human coders carried out the same task. In this comparison, we evaluated the performance of AI-based coders against two groups of human coders, comprising three experts and three non-experts. Our findings support the replacement of human coders with Generative AI ones, specifically ChatGPT for deductive qualitative research methods of limited scope. The experimental group, consisting of three independent Generative AI coders, outperformed both control groups in coding effort, with a fourfold (4x) efficiency and throughput time (15x) advantage. The latter could be explained by leveraging parallel processing. Concerning expert vs. non-expert coders, minimal evidence suggests a preference for experts. Although experts code slightly faster (17%), their inter-coder reliability showed no substantial advantage. A hybrid approach, combing ChatGPT and domain experts shows the most promise. This approach reduces costs, shortens project timelines, and enhances inter-coder reliability, as indicated by higher Cohen's Kappa values. In conclusion, Generative AI, exemplified by ChatGPT, offers a viable alternative to human coders, in combination with human research involvement, delivering cost savings and faster research completion without sacrificing notably reliability. These insights, while limited in scope, show potential for further studies with lager datasets, more inductive qualitative research designs and other research domains.
Received: 30 March 2024 | Revised: 17 May 2024 | Accepted: 18 June 2024
Conflicts of Interest
The author declares that he has no conflicts of interest to this work.
Data Availability Statement
The data that support the findings of this study are not publicly available due to privacy concerns. However, anonymous data are available on reasonable request. Requests should be made to Frédéric Pattyn([email protected]) and should include a brief description of the intended use of the data.

How to Cite
- Endnote/Zotero/Mendeley (RIS)
Copyright (c) 2024 Author

This work is licensed under a Creative Commons Attribution 4.0 International License .
Journal Information
© 2024 Bon View Publishing Pte Ltd.
Make a Submission
Announcements, stm membership announcement.
Bon View Publishing Pte. Ltd. proudly announces its membership in the esteemed International Association of Scientific, Technical and Medical Publishers(STM) , effective 2024. This collaboration marks a significant milestone in advancing global knowledge exchange and promoting cutting-edge research.
Bon View Publishing Formally Joined Open Access Scholarly Publishing Association (OASPA)
Bon View Publishing Pte. Ltd. has recently become a member of Open Access Scholarly Publishing Association(OASPA) . As the member of OASPA, Bon View Publishing is intrinsic to fulfilling the mission of encouraging and enabling open access as the predominant model of communication for scholarly outputs.
- Fuzzy Logic and Neural Network-based Risk Assessment Model for Import and Export Enterprises: A Review 1351
- Applications of Quantum Computing in Health Sector 966
- Analytic Network Process (ANP) Method: A Comprehensive Review of Applications, Advantages, and Limitations 906
- 3D-STCNN: Spatiotemporal Convolutional Neural Network Based on EEG 3D Features for Detecting Driving Fatigue 842
- Models and Techniques for Domain Relation Extraction: A Survey 622
eISSN: 2972-3841 | Published by Bon View Publishing Pte Ltd.
COMMENTS
Step 1 - Initial coding. The first step of the coding process is to identify the essence of the text and code it accordingly. While there are various qualitative analysis software packages available, you can just as easily code textual data using Microsoft Word's "comments" feature.
Qualitative research is often evaluated on the strength of its presentation. Some traditions of qualitative inquiry, such as deep ethnography, depend on written thick descriptions, without which the research is wholly incomplete, even nonexistent. ... As with qualitative data analysis generally, coding is often done recursively, meaning that ...
Coding is a qualitative data analysis strategy in which some aspect of the data is assigned a descriptive label that allows the researcher to identify related content across the data. How you decide to code - or whether to code- your data should be driven by your methodology. But there are rarely step-by-step descriptions, and you'll have to ...
The primary goal of coding qualitative data is to change data into a consistent format in support of research and reporting. A code can be a phrase or a word that depicts an idea or recurring theme in the data. The code's label must be intuitive and encapsulate the essence of the researcher's observations or participants' responses.
Qualitative content analysis is a research method for systematically identifying, coding, and analyzing patterns of meaning in qualitative data. Qualitative data can be collected from a variety of sources, such as interviews, focus groups, documents, and social media posts.
that can help pave the way to the researcher's interpretive judgements and improve the ir quality. By using this paper, novice researchers will be able to reflect more carefully on the ...
Qualitative data coding is the process of assigning quantitative tags to the pieces of data. This is necessary for any type of large-scale analysis because you 1) need to have a consistent way to compare and contrast each piece of qualitative data, and 2) will be able to use tools like Excel and Google Sheets to manipulate quantitative data.
Coding is the process of labeling and organizing your qualitative data to identify different themes and the relationships between them. When coding customer feedback, you assign labels to words or phrases that represent important (and recurring) themes in each response. These labels can be words, phrases, or numbers; we recommend using words or ...
This chapter provides an overview of selected qualitative data analytic strategies with a particular focus on codes and coding. Preparatory strategies for a qualitative research study and data management are first outlined. Six coding methods are then profiled using comparable interview data: process coding, in vivo coding, descriptive coding ...
Simply put, coding is qualitative analysis. Coding is the analytical phase where researchers become immersed in their data, take the time to fully get to know it (Basit, 2003; Elliott, 2018), and allow its sense to be discerned.A code is "…a word or short phrase that symbolically assigns a summative, salient, essence-capturing, and/or evocative attribute for a portion of language-based or ...
Organization of Coding Scheme Whether deductive or inductive, codes are organized into a coding scheme that you then use to systematically identify relevant segments of data within your entire data set. Flat Coding Codes are organized at the same conceptual level. Hierarchical Coding Codes are organized into groups and subgroups
Qualitative data coding (analysis) is the process of systematically transforming qualitative data into meaningful outcomes that represent the data and answer the research question(s ; Adu, 2019a).
What is [Qualitative] Coding? •Coding •Process to assess and assign interpretation of data •"Coding is not a precise science; it is primarily an interpretive act" (Saldaña, 2016, p. 5) •Codes •Words or phrases that are a summative attribute for data (Tracy, 2013) •Researcher-generated translation of data •Interpreted meaning
In open coding, the researcher is focused primarily on the text from the interviews to define concepts and categories. In axial coding, the researcher is using the concepts and categories developed in the open coding process, while re-reading the text from the interviews.
We shift the transparency debate from ethnography and interviews to how transparency operates in the content analysis, or coding, of documents and argue that scholars should create a living codebook to analyze their data. The living codebook is a set of tools that makes the analysis of documents more transparent among team members and, if researchers decide to make it public, to the scholarly ...
Learn how to code qualitative data the right way. We explain the qualitative coding process in simple, easy to understand terms. Learn about the different co...
The more specific your qualitative data coding is, the more detail you'll uncover. Here are some common qualitative research coding frameworks: Deductive coding. A deductive approach to coding qualitative data works best when you have sound foundational tags and categories in place.
The Coding Manual for Qualitative Researchers addresses an important aspect of many qualitative research traditions, the process of attaching meaningful attributes (codes) to qualitative data that allows researchers to engage in a range of analytic processes (e.g. pattern detection, categorization and theory building). It is a book intended to "supplement introductory works in the subject ...
Subscribe. Coding and analysis are central to qualitative research, moving the researcher from study design and data collection to discovery, theorizing, and writing up the findings in some form (e.g., a journal article, report, book chapter or book). Analysis is a systematic way of approaching data for the purpose of better understanding it.
Coding qualitative data can be a daunting task, especially for the first timer. Below are my notes, which is a useful summary on coding qualitative data (please note, most of the text has been taken directly from The Coding Manual for Qualitative Researchers by Johnny Saldana). Background to Coding. A coding pattern can be characterised by: ...
Tracy (2018) uses a phronetic iterative approach to data analysis in qualitative research, which is an iterative process of organizing, coding, and synthesizing qualitative data. She mentions key steps of the approach, including crafting a codebook, and provides an excerpt of the codebook used to analyze communicative behaviors in leadership ...
Step 1: Open Coding. Codes for the qualitative data are created through a line by line analysis of the comments. Codes would be based on the research questions, literature review, and theoretical perspective articulated. Numbering the lines is helpful so that the researcher can make notes regarding which comments they might like to quote in ...
Qualitative data analysis is a critical phase in qualitative research. One of its cornerstones is the coding process. Deductive and inductive codes are generated for breadth and depth exploration of the research topics, respectively. Deductive coding bases on 'a priori' of codes to which segments of texts and transcripts are assigned.
To ensure the highest quality of coding, we code all content completely manually (in other words, it's done by humans).. Coding is handled by our experienced, highly-qualified team of qualitative research specialists. All our coders have extensive academic experience, are native English speakers (from the US, UK and SA) and have worked on numerous research projects.
Transcribed data in English will be coded with one or more short descriptors [keywords] of the content of a sentence or paragraph to sort data into specific "theoretical" terms using qualitative data management software. These codes will be grouped, summarised, and classified (coding frame) to achieve data abstraction and synthesis.
Qualitative Research Design is a method focused on understanding and interpreting the experiences of individuals or groups. Unlike quantitative research, which quantifies data and identifies patterns through statistical analysis, Qualitative Research Design explores phenomena in depth using interviews, focus groups, and observations.This approach gathers rich narratives that provide insights ...
REGISTRATION CLOSED. Description: This three day (12-hour) workshop will get you up and running with coding and analyzing your qualitative data in NVivo 14 for Mac and Windows. The first day will focus on the basics: importing, organizing, and beginning to code your data (text documents, surveys, web pages, videos and audio).
This mixed methods approach study investigates the potential of introducing Generative AI (ChatGPT 4 and Bard) as part of a deductive qualitative research design that requires coding, focusing on possible gains in cost-effectiveness, coding throughput time and inter-coder reliability (Cohen's Kappa). This study involved semi-structured interviews with five domain experts and analyzed a ...
Qualitative research is used to understand users' thoughts, feelings, and experiences. This type of research is often conducted through interviews, focus groups, and diary studies. ... While some researchers may use coding skills to analyze qualitative data or work with specific tools, coding is not mandatory for UX research. Many UX ...