Educational resources and simple solutions for your research journey


What Are Research Objectives and How to Write Them (with Examples)
Table of Contents
Introduction
Research is at the center of everything researchers do, and setting clear, well-defined research objectives plays a pivotal role in guiding scholars toward their desired outcomes. Research papers are essential instruments for researchers to effectively communicate their work. Among the many sections that constitute a research paper, the introduction plays a key role in providing a background and setting the context. 1 Research objectives, which define the aims of the study, are usually stated in the introduction. Every study has a research question that the authors are trying to answer, and the objective is an active statement about how the study will answer this research question. These objectives help guide the development and design of the study and steer the research in the appropriate direction; if this is not clearly defined, a project can fail!
Research studies have a research question, research hypothesis, and one or more research objectives. A research question is what a study aims to answer, and a research hypothesis is a predictive statement about the relationship between two or more variables, which the study sets out to prove or disprove. Objectives are specific, measurable goals that the study aims to achieve. The difference between these three is illustrated by the following example:
- Research question : How does low-intensity pulsed ultrasound (LIPUS) compare with a placebo device in managing the symptoms of skeletally mature patients with patellar tendinopathy?
- Research hypothesis : Pain levels are reduced in patients who receive daily active-LIPUS (treatment) for 12 weeks compared with individuals who receive inactive-LIPUS (placebo).
- Research objective : To investigate the clinical efficacy of LIPUS in the management of patellar tendinopathy symptoms.
This article discusses the importance of clear, well-thought out objectives and suggests methods to write them clearly.
What is the introduction in research papers?
Research objectives are usually included in the introduction section. This section is the first that the readers will read so it is essential that it conveys the subject matter appropriately and is well written to create a good first impression. A good introduction sets the tone of the paper and clearly outlines the contents so that the readers get a quick snapshot of what to expect.
A good introduction should aim to: 2,3
- Indicate the main subject area, its importance, and cite previous literature on the subject
- Define the gap(s) in existing research, ask a research question, and state the objectives
- Announce the present research and outline its novelty and significance
- Avoid repeating the Abstract, providing unnecessary information, and claiming novelty without accurate supporting information.
Why are research objectives important?
Objectives can help you stay focused and steer your research in the required direction. They help define and limit the scope of your research, which is important to efficiently manage your resources and time. The objectives help to create and maintain the overall structure, and specify two main things—the variables and the methods of quantifying the variables.
A good research objective:
- defines the scope of the study
- gives direction to the research
- helps maintain focus and avoid diversions from the topic
- minimizes wastage of resources like time, money, and energy
Types of research objectives
Research objectives can be broadly classified into general and specific objectives . 4 General objectives state what the research expects to achieve overall while specific objectives break this down into smaller, logically connected parts, each of which addresses various parts of the research problem. General objectives are the main goals of the study and are usually fewer in number while specific objectives are more in number because they address several aspects of the research problem.
Example (general objective): To investigate the factors influencing the financial performance of firms listed in the New York Stock Exchange market.
Example (specific objective): To assess the influence of firm size on the financial performance of firms listed in the New York Stock Exchange market.
In addition to this broad classification, research objectives can be grouped into several categories depending on the research problem, as given in Table 1.
Table 1: Types of research objectives
| Exploratory | Explores a previously unstudied topic, issue, or phenomenon; aims to generate ideas or hypotheses |
| Descriptive | Describes the characteristics and features of a particular population or group |
| Explanatory | Explains the relationships between variables; seeks to identify cause-and-effect relationships |
| Predictive | Predicts future outcomes or events based on existing data samples or trends |
| Diagnostic | Identifies factors contributing to a particular problem |
| Comparative | Compares two or more groups or phenomena to identify similarities and differences |
| Historical | Examines past events and trends to understand their significance and impact |
| Methodological | Develops and improves research methods and techniques |
| Theoretical | Tests and refines existing theories or helps develop new theoretical perspectives |
Characteristics of research objectives
Research objectives must start with the word “To” because this helps readers identify the objective in the absence of headings and appropriate sectioning in research papers. 5,6
- A good objective is SMART (mostly applicable to specific objectives):
- Specific—clear about the what, why, when, and how
- Measurable—identifies the main variables of the study and quantifies the targets
- Achievable—attainable using the available time and resources
- Realistic—accurately addresses the scope of the problem
- Time-bound—identifies the time in which each step will be completed
- Research objectives clarify the purpose of research.
- They help understand the relationship and dissimilarities between variables.
- They provide a direction that helps the research to reach a definite conclusion.
How to write research objectives?
Research objectives can be written using the following steps: 7
- State your main research question clearly and concisely.
- Describe the ultimate goal of your study, which is similar to the research question but states the intended outcomes more definitively.
- Divide this main goal into subcategories to develop your objectives.
- Limit the number of objectives (1-2 general; 3-4 specific)
- Assess each objective using the SMART
- Start each objective with an action verb like assess, compare, determine, evaluate, etc., which makes the research appear more actionable.
- Use specific language without making the sentence data heavy.
- The most common section to add the objectives is the introduction and after the problem statement.
- Add the objectives to the abstract (if there is one).
- State the general objective first, followed by the specific objectives.
Formulating research objectives
Formulating research objectives has the following five steps, which could help researchers develop a clear objective: 8
- Identify the research problem.
- Review past studies on subjects similar to your problem statement, that is, studies that use similar methods, variables, etc.
- Identify the research gaps the current study should cover based on your literature review. These gaps could be theoretical, methodological, or conceptual.
- Define the research question(s) based on the gaps identified.
- Revise/relate the research problem based on the defined research question and the gaps identified. This is to confirm that there is an actual need for a study on the subject based on the gaps in literature.
- Identify and write the general and specific objectives.
- Incorporate the objectives into the study.
Advantages of research objectives
Adding clear research objectives has the following advantages: 4,8
- Maintains the focus and direction of the research
- Optimizes allocation of resources with minimal wastage
- Acts as a foundation for defining appropriate research questions and hypotheses
- Provides measurable outcomes that can help evaluate the success of the research
- Determines the feasibility of the research by helping to assess the availability of required resources
- Ensures relevance of the study to the subject and its contribution to existing literature
Disadvantages of research objectives
Research objectives also have few disadvantages, as listed below: 8
- Absence of clearly defined objectives can lead to ambiguity in the research process
- Unintentional bias could affect the validity and accuracy of the research findings
Key takeaways
- Research objectives are concise statements that describe what the research is aiming to achieve.
- They define the scope and direction of the research and maintain focus.
- The objectives should be SMART—specific, measurable, achievable, realistic, and time-bound.
- Clear research objectives help avoid collection of data or resources not required for the study.
- Well-formulated specific objectives help develop the overall research methodology, including data collection, analysis, interpretation, and utilization.
- Research objectives should cover all aspects of the problem statement in a coherent way.
- They should be clearly stated using action verbs.
Frequently asked questions on research objectives
Q: what’s the difference between research objectives and aims 9.
A: Research aims are statements that reflect the broad goal(s) of the study and outline the general direction of the research. They are not specific but clearly define the focus of the study.
Example: This research aims to explore employee experiences of digital transformation in retail HR.
Research objectives focus on the action to be taken to achieve the aims. They make the aims more practical and should be specific and actionable.
Example: To observe the retail HR employees throughout the digital transformation.
Q: What are the examples of research objectives, both general and specific?
A: Here are a few examples of research objectives:
- To identify the antiviral chemical constituents in Mumbukura gitoniensis (general)
- To carry out solvent extraction of dried flowers of Mumbukura gitoniensis and isolate the constituents. (specific)
- To determine the antiviral activity of each of the isolated compounds. (specific)
- To examine the extent, range, and method of coral reef rehabilitation projects in five shallow reef areas adjacent to popular tourist destinations in the Philippines.
- To investigate species richness of mammal communities in five protected areas over the past 20 years.
- To evaluate the potential application of AI techniques for estimating best-corrected visual acuity from fundus photographs with and without ancillary information.
- To investigate whether sport influences psychological parameters in the personality of asthmatic children.
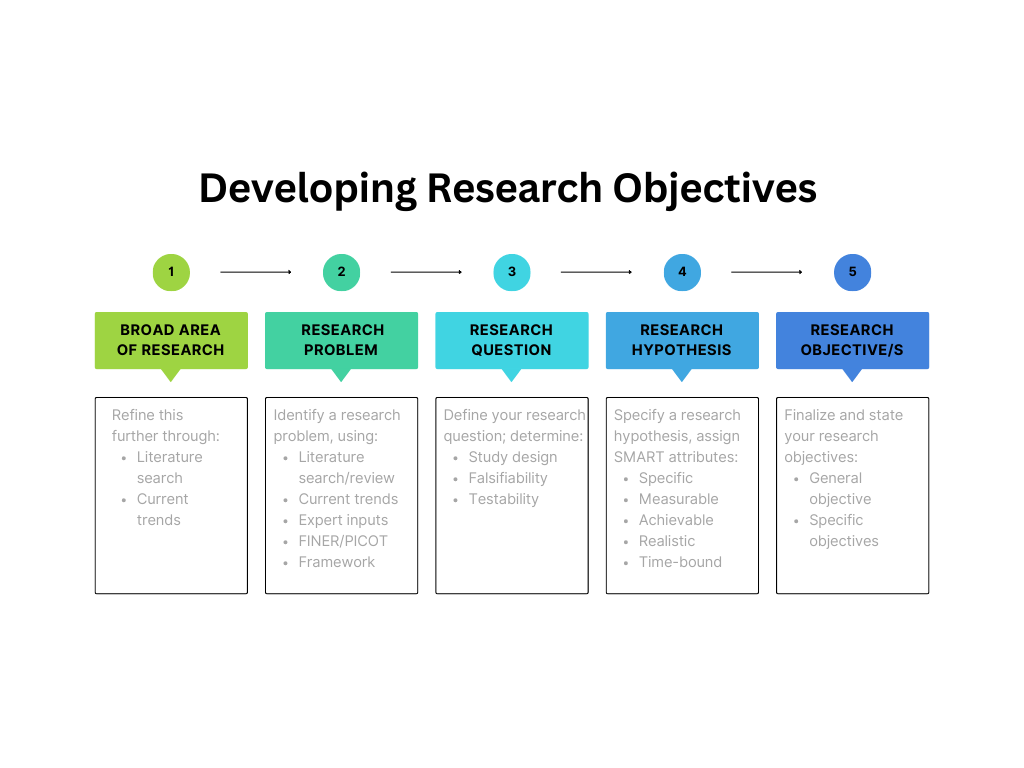
Q: How do I develop research objectives?
A: Developing research objectives begins with defining the problem statement clearly, as illustrated by Figure 1. Objectives specify how the research question will be answered and they determine what is to be measured to test the hypothesis.
Q: Are research objectives measurable?
A: The word “measurable” implies that something is quantifiable. In terms of research objectives, this means that the source and method of collecting data are identified and that all these aspects are feasible for the research. Some metrics can be created to measure your progress toward achieving your objectives.
Q: Can research objectives change during the study?
A: Revising research objectives during the study is acceptable in situations when the selected methodology is not progressing toward achieving the objective, or if there are challenges pertaining to resources, etc. One thing to keep in mind is the time and resources you would have to complete your research after revising the objectives. Thus, as long as your problem statement and hypotheses are unchanged, minor revisions to the research objectives are acceptable.
Q: What is the difference between research questions and research objectives? 10
| Broad statement; guide the overall direction of the research | Specific, measurable goals that the research aims to achieve |
| Identify the main problem | Define the specific outcomes the study aims to achieve |
| Used to generate hypotheses or identify gaps in existing knowledge | Used to establish clear and achievable targets for the research |
| Not mutually exclusive with research objectives | Should be directly related to the research question |
| Example: | Example: |
Q: Are research objectives the same as hypotheses?
A: No, hypotheses are predictive theories that are expressed in general terms. Research objectives, which are more specific, are developed from hypotheses and aim to test them. A hypothesis can be tested using several methods and each method will have different objectives because the methodology to be used could be different. A hypothesis is developed based on observation and reasoning; it is a calculated prediction about why a particular phenomenon is occurring. To test this prediction, different research objectives are formulated. Here’s a simple example of both a research hypothesis and research objective.
Research hypothesis : Employees who arrive at work earlier are more productive.
Research objective : To assess whether employees who arrive at work earlier are more productive.
To summarize, research objectives are an important part of research studies and should be written clearly to effectively communicate your research. We hope this article has given you a brief insight into the importance of using clearly defined research objectives and how to formulate them.
- Farrugia P, Petrisor BA, Farrokhyar F, Bhandari M. Practical tips for surgical research: Research questions, hypotheses and objectives. Can J Surg. 2010 Aug;53(4):278-81.
- Abbadia J. How to write an introduction for a research paper. Mind the Graph website. Accessed June 14, 2023. https://mindthegraph.com/blog/how-to-write-an-introduction-for-a-research-paper/
- Writing a scientific paper: Introduction. UCI libraries website. Accessed June 15, 2023. https://guides.lib.uci.edu/c.php?g=334338&p=2249903
- Research objectives—Types, examples and writing guide. Researchmethod.net website. Accessed June 17, 2023. https://researchmethod.net/research-objectives/#:~:text=They%20provide%20a%20clear%20direction,track%20and%20achieve%20their%20goals .
- Bartle P. SMART Characteristics of good objectives. Community empowerment collective website. Accessed June 16, 2023. https://cec.vcn.bc.ca/cmp/modules/pd-smar.htm
- Research objectives. Studyprobe website. Accessed June 18, 2023. https://www.studyprobe.in/2022/08/research-objectives.html
- Corredor F. How to write objectives in a research paper. wikiHow website. Accessed June 18, 2023. https://www.wikihow.com/Write-Objectives-in-a-Research-Proposal
- Research objectives: Definition, types, characteristics, advantages. AccountingNest website. Accessed June 15, 2023. https://www.accountingnest.com/articles/research/research-objectives
- Phair D., Shaeffer A. Research aims, objectives & questions. GradCoach website. Accessed June 20, 2023. https://gradcoach.com/research-aims-objectives-questions/
- Understanding the difference between research questions and objectives. Accessed June 21, 2023. https://board.researchersjob.com/blog/research-questions-and-objectives
R Discovery is a literature search and research reading platform that accelerates your research discovery journey by keeping you updated on the latest, most relevant scholarly content. With 250M+ research articles sourced from trusted aggregators like CrossRef, Unpaywall, PubMed, PubMed Central, Open Alex and top publishing houses like Springer Nature, JAMA, IOP, Taylor & Francis, NEJM, BMJ, Karger, SAGE, Emerald Publishing and more, R Discovery puts a world of research at your fingertips.
Try R Discovery Prime FREE for 1 week or upgrade at just US$72 a year to access premium features that let you listen to research on the go, read in your language, collaborate with peers, auto sync with reference managers, and much more. Choose a simpler, smarter way to find and read research – Download the app and start your free 7-day trial today !
Related Posts

What is Independent Publishing in Academia?

Article Processing Charges: Impact on Open Access Publishing
21 Research Objectives Examples (Copy and Paste)

Chris Drew (PhD)
Dr. Chris Drew is the founder of the Helpful Professor. He holds a PhD in education and has published over 20 articles in scholarly journals. He is the former editor of the Journal of Learning Development in Higher Education. [Image Descriptor: Photo of Chris]
Learn about our Editorial Process

Research objectives refer to the definitive statements made by researchers at the beginning of a research project detailing exactly what a research project aims to achieve.
These objectives are explicit goals clearly and concisely projected by the researcher to present a clear intention or course of action for his or her qualitative or quantitative study.
Research objectives are typically nested under one overarching research aim. The objectives are the steps you’ll need to take in order to achieve the aim (see the examples below, for example, which demonstrate an aim followed by 3 objectives, which is what I recommend to my research students).
Research Objectives vs Research Aims
Research aim and research objectives are fundamental constituents of any study, fitting together like two pieces of the same puzzle.
The ‘research aim’ describes the overarching goal or purpose of the study (Kumar, 2019). This is usually a broad, high-level purpose statement, summing up the central question that the research intends to answer.
Example of an Overarching Research Aim:
“The aim of this study is to explore the impact of climate change on crop productivity.”
Comparatively, ‘research objectives’ are concrete goals that underpin the research aim, providing stepwise actions to achieve the aim.
Objectives break the primary aim into manageable, focused pieces, and are usually characterized as being more specific, measurable, achievable, relevant, and time-bound (SMART).
Examples of Specific Research Objectives:
1. “To examine the effects of rising temperatures on the yield of rice crops during the upcoming growth season.” 2. “To assess changes in rainfall patterns in major agricultural regions over the first decade of the twenty-first century (2000-2010).” 3. “To analyze the impact of changing weather patterns on crop diseases within the same timeframe.”
The distinction between these two terms, though subtle, is significant for successfully conducting a study. The research aim provides the study with direction, while the research objectives set the path to achieving this aim, thereby ensuring the study’s efficiency and effectiveness.
How to Write Research Objectives
I usually recommend to my students that they use the SMART framework to create their research objectives.
SMART is an acronym standing for Specific, Measurable, Achievable, Relevant, and Time-bound. It provides a clear method of defining solid research objectives and helps students know where to start in writing their objectives (Locke & Latham, 2013).
Each element of this acronym adds a distinct dimension to the framework, aiding in the creation of comprehensive, well-delineated objectives.
Here is each step:
- Specific : We need to avoid ambiguity in our objectives. They need to be clear and precise (Doran, 1981). For instance, rather than stating the objective as “to study the effects of social media,” a more focused detail would be “to examine the effects of social media use (Facebook, Instagram, and Twitter) on the academic performance of college students.”
- Measurable: The measurable attribute provides a clear criterion to determine if the objective has been met (Locke & Latham, 2013). A quantifiable element, such as a percentage or a number, adds a measurable quality. For example, “to increase response rate to the annual customer survey by 10%,” makes it easier to ascertain achievement.
- Achievable: The achievable aspect encourages researchers to craft realistic objectives, resembling a self-check mechanism to ensure the objectives align with the scope and resources at disposal (Doran, 1981). For example, “to interview 25 participants selected randomly from a population of 100” is an attainable objective as long as the researcher has access to these participants.
- Relevance : Relevance, the fourth element, compels the researcher to tailor the objectives in alignment with overarching goals of the study (Locke & Latham, 2013). This is extremely important – each objective must help you meet your overall one-sentence ‘aim’ in your study.
- Time-Bound: Lastly, the time-bound element fosters a sense of urgency and prioritization, preventing procrastination and enhancing productivity (Doran, 1981). “To analyze the effect of laptop use in lectures on student engagement over the course of two semesters this year” expresses a clear deadline, thus serving as a motivator for timely completion.
You’re not expected to fit every single element of the SMART framework in one objective, but across your objectives, try to touch on each of the five components.
Research Objectives Examples
1. Field: Psychology
Aim: To explore the impact of sleep deprivation on cognitive performance in college students.
- Objective 1: To compare cognitive test scores of students with less than six hours of sleep and those with 8 or more hours of sleep.
- Objective 2: To investigate the relationship between class grades and reported sleep duration.
- Objective 3: To survey student perceptions and experiences on how sleep deprivation affects their cognitive capabilities.
2. Field: Environmental Science
Aim: To understand the effects of urban green spaces on human well-being in a metropolitan city.
- Objective 1: To assess the physical and mental health benefits of regular exposure to urban green spaces.
- Objective 2: To evaluate the social impacts of urban green spaces on community interactions.
- Objective 3: To examine patterns of use for different types of urban green spaces.
3. Field: Technology
Aim: To investigate the influence of using social media on productivity in the workplace.
- Objective 1: To measure the amount of time spent on social media during work hours.
- Objective 2: To evaluate the perceived impact of social media use on task completion and work efficiency.
- Objective 3: To explore whether company policies on social media usage correlate with different patterns of productivity.
4. Field: Education
Aim: To examine the effectiveness of online vs traditional face-to-face learning on student engagement and achievement.
- Objective 1: To compare student grades between the groups exposed to online and traditional face-to-face learning.
- Objective 2: To assess student engagement levels in both learning environments.
- Objective 3: To collate student perceptions and preferences regarding both learning methods.
5. Field: Health
Aim: To determine the impact of a Mediterranean diet on cardiac health among adults over 50.
- Objective 1: To assess changes in cardiovascular health metrics after following a Mediterranean diet for six months.
- Objective 2: To compare these health metrics with a similar group who follow their regular diet.
- Objective 3: To document participants’ experiences and adherence to the Mediterranean diet.
6. Field: Environmental Science
Aim: To analyze the impact of urban farming on community sustainability.
- Objective 1: To document the types and quantity of food produced through urban farming initiatives.
- Objective 2: To assess the effect of urban farming on local communities’ access to fresh produce.
- Objective 3: To examine the social dynamics and cooperative relationships in the creating and maintaining of urban farms.
7. Field: Sociology
Aim: To investigate the influence of home offices on work-life balance during remote work.
- Objective 1: To survey remote workers on their perceptions of work-life balance since setting up home offices.
- Objective 2: To conduct an observational study of daily work routines and family interactions in a home office setting.
- Objective 3: To assess the correlation, if any, between physical boundaries of workspaces and mental boundaries for work in the home setting.
8. Field: Economics
Aim: To evaluate the effects of minimum wage increases on small businesses.
- Objective 1: To analyze cost structures, pricing changes, and profitability of small businesses before and after minimum wage increases.
- Objective 2: To survey small business owners on the strategies they employ to navigate minimum wage increases.
- Objective 3: To examine employment trends in small businesses in response to wage increase legislation.
9. Field: Education
Aim: To explore the role of extracurricular activities in promoting soft skills among high school students.
- Objective 1: To assess the variety of soft skills developed through different types of extracurricular activities.
- Objective 2: To compare self-reported soft skills between students who participate in extracurricular activities and those who do not.
- Objective 3: To investigate the teachers’ perspectives on the contribution of extracurricular activities to students’ skill development.
10. Field: Technology
Aim: To assess the impact of virtual reality (VR) technology on the tourism industry.
- Objective 1: To document the types and popularity of VR experiences available in the tourism market.
- Objective 2: To survey tourists on their interest levels and satisfaction rates with VR tourism experiences.
- Objective 3: To determine whether VR tourism experiences correlate with increased interest in real-life travel to the simulated destinations.
11. Field: Biochemistry
Aim: To examine the role of antioxidants in preventing cellular damage.
- Objective 1: To identify the types and quantities of antioxidants in common fruits and vegetables.
- Objective 2: To determine the effects of various antioxidants on free radical neutralization in controlled lab tests.
- Objective 3: To investigate potential beneficial impacts of antioxidant-rich diets on long-term cellular health.
12. Field: Linguistics
Aim: To determine the influence of early exposure to multiple languages on cognitive development in children.
- Objective 1: To assess cognitive development milestones in monolingual and multilingual children.
- Objective 2: To document the number and intensity of language exposures for each group in the study.
- Objective 3: To investigate the specific cognitive advantages, if any, enjoyed by multilingual children.
13. Field: Art History
Aim: To explore the impact of the Renaissance period on modern-day art trends.
- Objective 1: To identify key characteristics and styles of Renaissance art.
- Objective 2: To analyze modern art pieces for the influence of the Renaissance style.
- Objective 3: To survey modern-day artists for their inspirations and the influence of historical art movements on their work.
14. Field: Cybersecurity
Aim: To assess the effectiveness of two-factor authentication (2FA) in preventing unauthorized system access.
- Objective 1: To measure the frequency of unauthorized access attempts before and after the introduction of 2FA.
- Objective 2: To survey users about their experiences and challenges with 2FA implementation.
- Objective 3: To evaluate the efficacy of different types of 2FA (SMS-based, authenticator apps, biometrics, etc.).
15. Field: Cultural Studies
Aim: To analyze the role of music in cultural identity formation among ethnic minorities.
- Objective 1: To document the types and frequency of traditional music practices within selected ethnic minority communities.
- Objective 2: To survey community members on the role of music in their personal and communal identity.
- Objective 3: To explore the resilience and transmission of traditional music practices in contemporary society.
16. Field: Astronomy
Aim: To explore the impact of solar activity on satellite communication.
- Objective 1: To categorize different types of solar activities and their frequencies of occurrence.
- Objective 2: To ascertain how variations in solar activity may influence satellite communication.
- Objective 3: To investigate preventative and damage-control measures currently in place during periods of high solar activity.
17. Field: Literature
Aim: To examine narrative techniques in contemporary graphic novels.
- Objective 1: To identify a range of narrative techniques employed in this genre.
- Objective 2: To analyze the ways in which these narrative techniques engage readers and affect story interpretation.
- Objective 3: To compare narrative techniques in graphic novels to those found in traditional printed novels.
18. Field: Renewable Energy
Aim: To investigate the feasibility of solar energy as a primary renewable resource within urban areas.
- Objective 1: To quantify the average sunlight hours across urban areas in different climatic zones.
- Objective 2: To calculate the potential solar energy that could be harnessed within these areas.
- Objective 3: To identify barriers or challenges to widespread solar energy implementation in urban settings and potential solutions.
19. Field: Sports Science
Aim: To evaluate the role of pre-game rituals in athlete performance.
- Objective 1: To identify the variety and frequency of pre-game rituals among professional athletes in several sports.
- Objective 2: To measure the impact of pre-game rituals on individual athletes’ performance metrics.
- Objective 3: To examine the psychological mechanisms that might explain the effects (if any) of pre-game ritual on performance.
20. Field: Ecology
Aim: To investigate the effects of urban noise pollution on bird populations.
- Objective 1: To record and quantify urban noise levels in various bird habitats.
- Objective 2: To measure bird population densities in relation to noise levels.
- Objective 3: To determine any changes in bird behavior or vocalization linked to noise levels.
21. Field: Food Science
Aim: To examine the influence of cooking methods on the nutritional value of vegetables.
- Objective 1: To identify the nutrient content of various vegetables both raw and after different cooking processes.
- Objective 2: To compare the effect of various cooking methods on the nutrient retention of these vegetables.
- Objective 3: To propose cooking strategies that optimize nutrient retention.
The Importance of Research Objectives
The importance of research objectives cannot be overstated. In essence, these guideposts articulate what the researcher aims to discover, understand, or examine (Kothari, 2014).
When drafting research objectives, it’s essential to make them simple and comprehensible, specific to the point of being quantifiable where possible, achievable in a practical sense, relevant to the chosen research question, and time-constrained to ensure efficient progress (Kumar, 2019).
Remember that a good research objective is integral to the success of your project, offering a clear path forward for setting out a research design , and serving as the bedrock of your study plan. Each objective must distinctly address a different dimension of your research question or problem (Kothari, 2014). Always bear in mind that the ultimate purpose of your research objectives is to succinctly encapsulate your aims in the clearest way possible, facilitating a coherent, comprehensive and rational approach to your planned study, and furnishing a scientific roadmap for your journey into the depths of knowledge and research (Kumar, 2019).
Kothari, C.R (2014). Research Methodology: Methods and Techniques . New Delhi: New Age International.
Kumar, R. (2019). Research Methodology: A Step-by-Step Guide for Beginners .New York: SAGE Publications.
Doran, G. T. (1981). There’s a S.M.A.R.T. way to write management’s goals and objectives. Management review, 70 (11), 35-36.
Locke, E. A., & Latham, G. P. (2013). New Developments in Goal Setting and Task Performance . New York: Routledge.

- Chris Drew (PhD) https://helpfulprofessor.com/author/chris-drew-phd/ 19 Top Cognitive Psychology Theories (Explained)
- Chris Drew (PhD) https://helpfulprofessor.com/author/chris-drew-phd/ 119 Bloom’s Taxonomy Examples
- Chris Drew (PhD) https://helpfulprofessor.com/author/chris-drew-phd/ All 6 Levels of Understanding (on Bloom’s Taxonomy)
- Chris Drew (PhD) https://helpfulprofessor.com/author/chris-drew-phd/ 15 Self-Actualization Examples (Maslow's Hierarchy)
Leave a Comment Cancel Reply
Your email address will not be published. Required fields are marked *
Research Aims, Objectives & Questions
The “Golden Thread” Explained Simply (+ Examples)
By: David Phair (PhD) and Alexandra Shaeffer (PhD) | June 2022
The research aims , objectives and research questions (collectively called the “golden thread”) are arguably the most important thing you need to get right when you’re crafting a research proposal , dissertation or thesis . We receive questions almost every day about this “holy trinity” of research and there’s certainly a lot of confusion out there, so we’ve crafted this post to help you navigate your way through the fog.
Overview: The Golden Thread
- What is the golden thread
- What are research aims ( examples )
- What are research objectives ( examples )
- What are research questions ( examples )
- The importance of alignment in the golden thread
What is the “golden thread”?
The golden thread simply refers to the collective research aims , research objectives , and research questions for any given project (i.e., a dissertation, thesis, or research paper ). These three elements are bundled together because it’s extremely important that they align with each other, and that the entire research project aligns with them.
Importantly, the golden thread needs to weave its way through the entirety of any research project , from start to end. In other words, it needs to be very clearly defined right at the beginning of the project (the topic ideation and proposal stage) and it needs to inform almost every decision throughout the rest of the project. For example, your research design and methodology will be heavily influenced by the golden thread (we’ll explain this in more detail later), as well as your literature review.
The research aims, objectives and research questions (the golden thread) define the focus and scope ( the delimitations ) of your research project. In other words, they help ringfence your dissertation or thesis to a relatively narrow domain, so that you can “go deep” and really dig into a specific problem or opportunity. They also help keep you on track , as they act as a litmus test for relevance. In other words, if you’re ever unsure whether to include something in your document, simply ask yourself the question, “does this contribute toward my research aims, objectives or questions?”. If it doesn’t, chances are you can drop it.
Alright, enough of the fluffy, conceptual stuff. Let’s get down to business and look at what exactly the research aims, objectives and questions are and outline a few examples to bring these concepts to life.

Research Aims: What are they?
Simply put, the research aim(s) is a statement that reflects the broad overarching goal (s) of the research project. Research aims are fairly high-level (low resolution) as they outline the general direction of the research and what it’s trying to achieve .
Research Aims: Examples
True to the name, research aims usually start with the wording “this research aims to…”, “this research seeks to…”, and so on. For example:
“This research aims to explore employee experiences of digital transformation in retail HR.” “This study sets out to assess the interaction between student support and self-care on well-being in engineering graduate students”
As you can see, these research aims provide a high-level description of what the study is about and what it seeks to achieve. They’re not hyper-specific or action-oriented, but they’re clear about what the study’s focus is and what is being investigated.
Need a helping hand?
Research Objectives: What are they?
The research objectives take the research aims and make them more practical and actionable . In other words, the research objectives showcase the steps that the researcher will take to achieve the research aims.
The research objectives need to be far more specific (higher resolution) and actionable than the research aims. In fact, it’s always a good idea to craft your research objectives using the “SMART” criteria. In other words, they should be specific, measurable, achievable, relevant and time-bound”.
Research Objectives: Examples
Let’s look at two examples of research objectives. We’ll stick with the topic and research aims we mentioned previously.
For the digital transformation topic:
To observe the retail HR employees throughout the digital transformation. To assess employee perceptions of digital transformation in retail HR. To identify the barriers and facilitators of digital transformation in retail HR.
And for the student wellness topic:
To determine whether student self-care predicts the well-being score of engineering graduate students. To determine whether student support predicts the well-being score of engineering students. To assess the interaction between student self-care and student support when predicting well-being in engineering graduate students.
As you can see, these research objectives clearly align with the previously mentioned research aims and effectively translate the low-resolution aims into (comparatively) higher-resolution objectives and action points . They give the research project a clear focus and present something that resembles a research-based “to-do” list.

Research Questions: What are they?
Finally, we arrive at the all-important research questions. The research questions are, as the name suggests, the key questions that your study will seek to answer . Simply put, they are the core purpose of your dissertation, thesis, or research project. You’ll present them at the beginning of your document (either in the introduction chapter or literature review chapter) and you’ll answer them at the end of your document (typically in the discussion and conclusion chapters).
The research questions will be the driving force throughout the research process. For example, in the literature review chapter, you’ll assess the relevance of any given resource based on whether it helps you move towards answering your research questions. Similarly, your methodology and research design will be heavily influenced by the nature of your research questions. For instance, research questions that are exploratory in nature will usually make use of a qualitative approach, whereas questions that relate to measurement or relationship testing will make use of a quantitative approach.
Let’s look at some examples of research questions to make this more tangible.
Research Questions: Examples
Again, we’ll stick with the research aims and research objectives we mentioned previously.
For the digital transformation topic (which would be qualitative in nature):
How do employees perceive digital transformation in retail HR? What are the barriers and facilitators of digital transformation in retail HR?
And for the student wellness topic (which would be quantitative in nature):
Does student self-care predict the well-being scores of engineering graduate students? Does student support predict the well-being scores of engineering students? Do student self-care and student support interact when predicting well-being in engineering graduate students?
You’ll probably notice that there’s quite a formulaic approach to this. In other words, the research questions are basically the research objectives “converted” into question format. While that is true most of the time, it’s not always the case. For example, the first research objective for the digital transformation topic was more or less a step on the path toward the other objectives, and as such, it didn’t warrant its own research question.
So, don’t rush your research questions and sloppily reword your objectives as questions. Carefully think about what exactly you’re trying to achieve (i.e. your research aim) and the objectives you’ve set out, then craft a set of well-aligned research questions . Also, keep in mind that this can be a somewhat iterative process , where you go back and tweak research objectives and aims to ensure tight alignment throughout the golden thread.
The importance of strong alignment
Alignment is the keyword here and we have to stress its importance . Simply put, you need to make sure that there is a very tight alignment between all three pieces of the golden thread. If your research aims and research questions don’t align, for example, your project will be pulling in different directions and will lack focus . This is a common problem students face and can cause many headaches (and tears), so be warned.
Take the time to carefully craft your research aims, objectives and research questions before you run off down the research path. Ideally, get your research supervisor/advisor to review and comment on your golden thread before you invest significant time into your project, and certainly before you start collecting data .
Recap: The golden thread
In this post, we unpacked the golden thread of research, consisting of the research aims , research objectives and research questions . You can jump back to any section using the links below.
As always, feel free to leave a comment below – we always love to hear from you. Also, if you’re interested in 1-on-1 support, take a look at our private coaching service here.

Psst... there’s more!
This post was based on one of our popular Research Bootcamps . If you're working on a research project, you'll definitely want to check this out ...
You Might Also Like:
")
39 Comments

Thank you very much for your great effort put. As an Undergraduate taking Demographic Research & Methodology, I’ve been trying so hard to understand clearly what is a Research Question, Research Aim and the Objectives in a research and the relationship between them etc. But as for now I’m thankful that you’ve solved my problem.

Well appreciated. This has helped me greatly in doing my dissertation.

An so delighted with this wonderful information thank you a lot.
so impressive i have benefited a lot looking forward to learn more on research.

I am very happy to have carefully gone through this well researched article.
Infact,I used to be phobia about anything research, because of my poor understanding of the concepts.
Now,I get to know that my research question is the same as my research objective(s) rephrased in question format.
I please I would need a follow up on the subject,as I intends to join the team of researchers. Thanks once again.

Thanks so much. This was really helpful.

I know you pepole have tried to break things into more understandable and easy format. And God bless you. Keep it up

i found this document so useful towards my study in research methods. thanks so much.

This is my 2nd read topic in your course and I should commend the simplified explanations of each part. I’m beginning to understand and absorb the use of each part of a dissertation/thesis. I’ll keep on reading your free course and might be able to avail the training course! Kudos!

Thank you! Better put that my lecture and helped to easily understand the basics which I feel often get brushed over when beginning dissertation work.

This is quite helpful. I like how the Golden thread has been explained and the needed alignment.

This is quite helpful. I really appreciate!

The article made it simple for researcher students to differentiate between three concepts.

Very innovative and educational in approach to conducting research.

I am very impressed with all these terminology, as I am a fresh student for post graduate, I am highly guided and I promised to continue making consultation when the need arise. Thanks a lot.

A very helpful piece. thanks, I really appreciate it .

Very well explained, and it might be helpful to many people like me.

Wish i had found this (and other) resource(s) at the beginning of my PhD journey… not in my writing up year… 😩 Anyways… just a quick question as i’m having some issues ordering my “golden thread”…. does it matter in what order you mention them? i.e., is it always first aims, then objectives, and finally the questions? or can you first mention the research questions and then the aims and objectives?

Thank you for a very simple explanation that builds upon the concepts in a very logical manner. Just prior to this, I read the research hypothesis article, which was equally very good. This met my primary objective.
My secondary objective was to understand the difference between research questions and research hypothesis, and in which context to use which one. However, I am still not clear on this. Can you kindly please guide?

In research, a research question is a clear and specific inquiry that the researcher wants to answer, while a research hypothesis is a tentative statement or prediction about the relationship between variables or the expected outcome of the study. Research questions are broader and guide the overall study, while hypotheses are specific and testable statements used in quantitative research. Research questions identify the problem, while hypotheses provide a focus for testing in the study.

Exactly what I need in this research journey, I look forward to more of your coaching videos.

This helped a lot. Thanks so much for the effort put into explaining it.

What data source in writing dissertation/Thesis requires?
What is data source covers when writing dessertation/thesis

This is quite useful thanks

I’m excited and thankful. I got so much value which will help me progress in my thesis.

where are the locations of the reserch statement, research objective and research question in a reserach paper? Can you write an ouline that defines their places in the researh paper?

Very helpful and important tips on Aims, Objectives and Questions.

Thank you so much for making research aim, research objectives and research question so clear. This will be helpful to me as i continue with my thesis.

Thanks much for this content. I learned a lot. And I am inspired to learn more. I am still struggling with my preparation for dissertation outline/proposal. But I consistently follow contents and tutorials and the new FB of GRAD Coach. Hope to really become confident in writing my dissertation and successfully defend it.

As a researcher and lecturer, I find splitting research goals into research aims, objectives, and questions is unnecessarily bureaucratic and confusing for students. For most biomedical research projects, including ‘real research’, 1-3 research questions will suffice (numbers may differ by discipline).

Awesome! Very important resources and presented in an informative way to easily understand the golden thread. Indeed, thank you so much.

Well explained

The blog article on research aims, objectives, and questions by Grad Coach is a clear and insightful guide that aligns with my experiences in academic research. The article effectively breaks down the often complex concepts of research aims and objectives, providing a straightforward and accessible explanation. Drawing from my own research endeavors, I appreciate the practical tips offered, such as the need for specificity and clarity when formulating research questions. The article serves as a valuable resource for students and researchers, offering a concise roadmap for crafting well-defined research goals and objectives. Whether you’re a novice or an experienced researcher, this article provides practical insights that contribute to the foundational aspects of a successful research endeavor.

A great thanks for you. it is really amazing explanation. I grasp a lot and one step up to research knowledge.

I really found these tips helpful. Thank you very much Grad Coach.

I found this article helpful. Thanks for sharing this.

thank you so much, the explanation and examples are really helpful
Submit a Comment Cancel reply
Your email address will not be published. Required fields are marked *
Save my name, email, and website in this browser for the next time I comment.
- Print Friendly

Handy Tips To Write A Clear Research Objectives With Examples
Introduction.
Research objectives play a crucial role in any research study. They provide a clear direction and purpose for the research, guiding the researcher in their investigation. Understanding research objectives is essential for conducting a successful study and achieving meaningful results.
In this comprehensive review, we will delve into the definition of research objectives, exploring their characteristics, types, and examples. We will also discuss the relationship between research objectives and research questions, as well as provide insights into how to write effective research objectives. Additionally, we will examine the role of research objectives in research methodology and highlight the importance of them in a study. By the end of this review, you will have a comprehensive understanding of research objectives and their significance in the research process.
Definition of Research Objectives: What Are They?

A research objective is defined as a clear and concise statement that outlines the specific goals and aims of a research study. These objectives are designed to be specific, measurable, achievable, relevant, and time-bound (SMART), ensuring they provide a structured pathway to accomplishing the intended outcomes of the project. Each objective serves as a foundational element that summarizes the purpose of your study, guiding the research activities and helping to measure progress toward the study’s goals. Additionally, research objectives are integral components of the research framework , establishing a clear direction that aligns with the overall research questions and hypotheses. This alignment helps to ensure that the study remains focused and relevant, facilitating the systematic collection, analysis, and interpretation of data.
Characteristics of Effective Research Objectives
Characteristics of research objectives include:
- Specific: Research objectives should be clear about the what, why, when, and how of the study.
- Measurable: Research objectives should identify the main variables of the study that can be measured or observed.
- Relevant: Research objectives should be relevant to the research topic and contribute to the overall understanding of the subject.
- Feasible: Research objectives should be achievable within the constraints of time, resources, and expertise available.
- Logical: Research objectives should follow a logical sequence and build upon each other to achieve the overall research goal.
- Observable: Research objectives should be observable or measurable in order to assess the progress and success of the research project.
- Unambiguous: Research objectives should be clear and unambiguous, leaving no room for interpretation or confusion.
- Measurable: Research objectives should be measurable, allowing for the collection of data and analysis of results.
By incorporating these characteristics into research objectives, researchers can ensure that their study is focused, achievable, and contributes to the body of knowledge in their field.
Types of Research Objectives
Research objective can be broadly classified into general and specific objectives. General objectives are broad statements that define the overall purpose of the research. They provide a broad direction for the study and help in setting the context. Specific objectives, on the other hand, are detailed objectives that describe what will be researched during the study. They are more focused and provide specific outcomes that the researcher aims to achieve. Specific objectives are derived from the general objectives and help in breaking down the research into smaller, manageable parts. The specific objectives should be clear, measurable, and achievable. They should be designed in a way that allows the researcher to answer the research questions and address the research problem.
In addition to general and specific objectives, research objective can also be categorized as descriptive or analytical objectives. Descriptive objectives focus on describing the characteristics or phenomena of a particular subject or population. They involve surveys, observations, and data collection to provide a detailed understanding of the subject. Analytical objectives, on the other hand, aim to analyze the relationships between variables or factors. They involve data analysis and interpretation to gain insights and draw conclusions.
Both descriptive and analytical objectives are important in research as they serve different purposes and contribute to a comprehensive understanding of the research topic.
Examples of Research Objectives
Here are some examples of research objectives in different fields:
1. Objective: To identify key characteristics and styles of Renaissance art.
This objective focuses on exploring the characteristics and styles of art during the Renaissance period. The research may involve analyzing various artworks, studying historical documents, and interviewing experts in the field.
2. Objective: To analyze modern art trends and their impact on society.
This objective aims to examine the current trends in modern art and understand how they influence society. The research may involve analyzing artworks, conducting surveys or interviews with artists and art enthusiasts, and studying the social and cultural implications of modern art.
3. Objective: To investigate the effects of exercise on mental health.
This objective focuses on studying the relationship between exercise and mental health. The research may involve conducting experiments or surveys to assess the impact of exercise on factors such as stress, anxiety, and depression.
4. Objective: To explore the factors influencing consumer purchasing decisions in the fashion industry.
This objective aims to understand the various factors that influence consumers’ purchasing decisions in the fashion industry. The research may involve conducting surveys, analyzing consumer behavior data, and studying the impact of marketing strategies on consumer choices.
5. Objective: To examine the effectiveness of a new drug in treating a specific medical condition.
This objective focuses on evaluating the effectiveness of a newly developed drug in treating a particular medical condition. The research may involve conducting clinical trials, analyzing patient data, and comparing the outcomes of the new drug with existing treatment options.
These examples demonstrate the diversity of research objectives across different disciplines. Each objective is specific, measurable, and achievable, providing a clear direction for the research study.
Aligning Research Objectives with Research Questions
Research objectives and research questions are essential components of a research project. Research objective describe what you intend your research project to accomplish. They summarize the approach and purpose of the project and provide a clear direction for the research. Research questions, on the other hand, are the starting point of any good research. They guide the overall direction of the research and help identify and focus on the research gaps .
The main difference between research questions and objectives is their form. Research questions are stated in a question form, while objectives are specific, measurable, and achievable goals that you aim to accomplish within a specified timeframe. Research questions are broad statements that provide a roadmap for the research, while objectives break down the research aim into smaller, actionable steps.
Research objectives and research questions work together to form the ‘golden thread’ of a research project. The research aim specifies what the study will answer, while the objectives and questions specify how the study will answer it. They provide a clear focus and scope for the research project, helping researchers stay on track and ensure that their study is meaningful and relevant.
When writing research objectives and questions, it is important to be clear, concise, and specific. Each objective or question should address a specific aspect of the research and contribute to the overall goal of the study. They should also be measurable, meaning that their achievement can be assessed and evaluated. Additionally, research objectives and questions should be achievable within the given timeframe and resources of the research project. By clearly defining the objectives and questions, researchers can effectively plan and execute their research, leading to valuable insights and contributions to the field.
Guidelines for Writing Clear Research Objectives
Writing research objective is a crucial step in any research project. The objectives provide a clear direction and purpose for the study, guiding the researcher in their data collection and analysis. Here are some tips on how to write effective research objective:
1. Be clear and specific
Research objective should be written in a clear and specific manner. Avoid vague or ambiguous language that can lead to confusion. Clearly state what you intend to achieve through your research.
2. Use action verbs
Start your research objective with action verbs that describe the desired outcome. Action verbs such as ‘investigate’, ‘analyze’, ‘compare’, ‘evaluate’, or ‘identify’ help to convey the purpose of the study.
3. Align with research questions or hypotheses
Ensure that your research objectives are aligned with your research questions or hypotheses. The objectives should address the main goals of your study and provide a framework for answering your research questions or testing your hypotheses.
4. Be realistic and achievable
Set research objectives that are realistic and achievable within the scope of your study. Consider the available resources, time constraints, and feasibility of your objectives. Unrealistic objectives can lead to frustration and hinder the progress of your research.
5. Consider the significance and relevance
Reflect on the significance and relevance of your research objectives. How will achieving these objectives contribute to the existing knowledge or address a gap in the literature? Ensure that your objectives have a clear purpose and value.
6. Seek feedback
It is beneficial to seek feedback on your research objectives from colleagues, mentors, or experts in your field. They can provide valuable insights and suggestions for improving the clarity and effectiveness of your objectives.
7. Revise and refine
Research objectives are not set in stone. As you progress in your research, you may need to revise and refine your objectives to align with new findings or changes in the research context. Regularly review and update your objectives to ensure they remain relevant and focused.
By following these tips, you can write research objectives that are clear, focused, and aligned with your research goals. Well-defined objectives will guide your research process and help you achieve meaningful outcomes.
The Role of Research Objectives in Research Methodology
Research objectives play a crucial role in the research methodology . In research methodology, research objectives are formulated based on the research questions or problem statement. These objectives help in defining the scope and focus of the study, ensuring that the research is conducted in a systematic and organized manner.
The research objectives in research methodology act as a roadmap for the research project. They help in identifying the key variables to be studied, determining the research design and methodology, and selecting the appropriate data collection methods .
Furthermore, research objectives in research methodology assist in evaluating the success of the study. By setting clear objectives, researchers can assess whether the desired outcomes have been achieved and determine the effectiveness of the research methods employed. It is important to note that research objectives in research methodology should be aligned with the overall research aim. They should address the specific aspects or components of the research aim and provide a framework for achieving the desired outcomes.
Understanding The Dynamic of Research Objectives in Your Study
The research objectives of a study play a crucial role in guiding the research process, ensuring that the study is focused, purposeful, and contributes to the advancement of knowledge in the field. It is important to note that the research objectives may evolve or change as the study progresses. As new information is gathered and analyzed, the researcher may need to revise the objectives to ensure that they remain relevant and achievable.
In summary, research objectives are essential components in writing an effective research paper . They provide a roadmap for the research process, guiding the researcher in their investigation and helping to ensure that the study is purposeful and meaningful. By understanding and effectively utilizing research objectives, researchers can enhance the quality and impact of their research endeavors.
Leave a Comment Cancel reply
Save my name, email, and website in this browser for the next time I comment.
Related articles

Writing An Accurate Conclusion In A Research Study: 5 Step-By-Step Guide

Writing An Abstract for Research Paper: Best Practices!

Wondering How To Write a Robust and Effective Problem Statement In Research Study? This Article Has It All!

Ultimate Guide to Boosting Your Creativity To Generate Great Research Ideas!

The Intricate Differences Between Research Papers, Theses, And Dissertations

Drafting Exceptional Research Abstracts: 7 Know-How!

Mastering Reference Management Tools for Effective Research Writing

Academic Integrity : Best Practice Of Upholding Honor in Research And Education
- Link to facebook
- Link to linkedin
- Link to twitter
- Link to youtube
- Writing Tips
How to Write Research Objectives

3-minute read
- 22nd November 2021
Writing a research paper, thesis, or dissertation ? If so, you’ll want to state your research objectives in the introduction of your paper to make it clear to your readers what you’re trying to accomplish. But how do you write effective research objectives? In this post, we’ll look at two key topics to help you do this:
- How to use your research aims as a basis for developing objectives.
- How to use SMART criteria to refine your research objectives.
For more advice on how to write strong research objectives, see below.
Research Aims and Objectives
There is an important difference between research aims and research objectives:
- A research aim defines the main purpose of your research. As such, you can think of your research aim as answering the question “What are you doing?”
- Research objectives (as most studies will have more than one) are the steps you will take to fulfil your aims. As such, your objectives should answer the question “How are you conducting your research?”
For instance, an example research aim could be:
This study will investigate the link between dehydration and the incidence of urinary tract infections (UTIs) in intensive care patients in Australia.
To develop a set of research objectives, you would then break down the various steps involved in meeting said aim. For example:
This study will investigate the link between dehydration and the incidence of urinary tract infections (UTIs) in intensive care patients in Australia. To achieve this, the study objectives w ill include:
- Replicat ing a small Singaporean study into the role of dehydration in UTIs in hospital patients (Sepe, 2018) in a larger Australian cohort.
- Trialing the use of intravenous fluids for intensive care patients to prevent dehydration.
- Assessing the relationship between the age of patients and quantities of intravenous fluids needed to counter dehydration.
Find this useful?
Subscribe to our newsletter and get writing tips from our editors straight to your inbox.
Note that the objectives don’t go into any great detail here. The key is to briefly summarize each component of your study. You can save details for how you will conduct the research for the methodology section of your paper.
Make Your Research Objectives SMART
A great way to refine your research objectives is to use SMART criteria . Borrowed from the world of project management, there are many versions of this system. However, we’re going to focus on developing specific, measurable, achievable, relevant, and timebound objectives.
In other words, a good research objective should be all of the following:
- S pecific – Is the objective clear and well-defined?
- M easurable – How will you know when the objective has been achieved? Is there a way to measure the thing you’re seeking to do?
- A chievable – Do you have the support and resources necessary to undertake this action? Are you being overly ambitious with this objective?
- R elevant – Is this objective vital for fulfilling your research aim?
- T imebound – Can this action be realistically undertaken in the time you have?
If you follow this system, your research objectives will be much stronger.
Expert Research Proofreading
Whatever your research aims and objectives, make sure to have your academic writing proofread by the experts!
Our academic editors can help you with research papers and proposals , as well as any other scholarly document you need checking. And this will help to ensure that your academic writing is always clear, concise, and precise.
Submit a free sample document today to trial our services and find out more.
Share this article:
Post A New Comment
Got content that needs a quick turnaround? Let us polish your work. Explore our editorial business services.
9-minute read
How to Use Infographics to Boost Your Presentation
Is your content getting noticed? Capturing and maintaining an audience’s attention is a challenge when...
8-minute read
Why Interactive PDFs Are Better for Engagement
Are you looking to enhance engagement and captivate your audience through your professional documents? Interactive...
7-minute read
Seven Key Strategies for Voice Search Optimization
Voice search optimization is rapidly shaping the digital landscape, requiring content professionals to adapt their...
4-minute read
Five Creative Ways to Showcase Your Digital Portfolio
Are you a creative freelancer looking to make a lasting impression on potential clients or...
How to Ace Slack Messaging for Contractors and Freelancers
Effective professional communication is an important skill for contractors and freelancers navigating remote work environments....
How to Insert a Text Box in a Google Doc
Google Docs is a powerful collaborative tool, and mastering its features can significantly enhance your...
Make sure your writing is the best it can be with our expert English proofreading and editing.
Frequently asked questions
How do i write a research objective.
Once you’ve decided on your research objectives , you need to explain them in your paper, at the end of your problem statement .
Keep your research objectives clear and concise, and use appropriate verbs to accurately convey the work that you will carry out for each one.
I will compare …
Frequently asked questions: Writing a research paper
A research project is an academic, scientific, or professional undertaking to answer a research question . Research projects can take many forms, such as qualitative or quantitative , descriptive , longitudinal , experimental , or correlational . What kind of research approach you choose will depend on your topic.
The best way to remember the difference between a research plan and a research proposal is that they have fundamentally different audiences. A research plan helps you, the researcher, organize your thoughts. On the other hand, a dissertation proposal or research proposal aims to convince others (e.g., a supervisor, a funding body, or a dissertation committee) that your research topic is relevant and worthy of being conducted.
Formulating a main research question can be a difficult task. Overall, your question should contribute to solving the problem that you have defined in your problem statement .
However, it should also fulfill criteria in three main areas:
- Researchability
- Feasibility and specificity
- Relevance and originality
Research questions anchor your whole project, so it’s important to spend some time refining them.
In general, they should be:
- Focused and researchable
- Answerable using credible sources
- Complex and arguable
- Feasible and specific
- Relevant and original
All research questions should be:
- Focused on a single problem or issue
- Researchable using primary and/or secondary sources
- Feasible to answer within the timeframe and practical constraints
- Specific enough to answer thoroughly
- Complex enough to develop the answer over the space of a paper or thesis
- Relevant to your field of study and/or society more broadly

A research aim is a broad statement indicating the general purpose of your research project. It should appear in your introduction at the end of your problem statement , before your research objectives.
Research objectives are more specific than your research aim. They indicate the specific ways you’ll address the overarching aim.
Your research objectives indicate how you’ll try to address your research problem and should be specific:
Research objectives describe what you intend your research project to accomplish.
They summarize the approach and purpose of the project and help to focus your research.
Your objectives should appear in the introduction of your research paper , at the end of your problem statement .
The main guidelines for formatting a paper in Chicago style are to:
- Use a standard font like 12 pt Times New Roman
- Use 1 inch margins or larger
- Apply double line spacing
- Indent every new paragraph ½ inch
- Include a title page
- Place page numbers in the top right or bottom center
- Cite your sources with author-date citations or Chicago footnotes
- Include a bibliography or reference list
To automatically generate accurate Chicago references, you can use Scribbr’s free Chicago reference generator .
The main guidelines for formatting a paper in MLA style are as follows:
- Use an easily readable font like 12 pt Times New Roman
- Set 1 inch page margins
- Include a four-line MLA heading on the first page
- Center the paper’s title
- Use title case capitalization for headings
- Cite your sources with MLA in-text citations
- List all sources cited on a Works Cited page at the end
To format a paper in APA Style , follow these guidelines:
- Use a standard font like 12 pt Times New Roman or 11 pt Arial
- If submitting for publication, insert a running head on every page
- Apply APA heading styles
- Cite your sources with APA in-text citations
- List all sources cited on a reference page at the end
No, it’s not appropriate to present new arguments or evidence in the conclusion . While you might be tempted to save a striking argument for last, research papers follow a more formal structure than this.
All your findings and arguments should be presented in the body of the text (more specifically in the results and discussion sections if you are following a scientific structure). The conclusion is meant to summarize and reflect on the evidence and arguments you have already presented, not introduce new ones.
The conclusion of a research paper has several key elements you should make sure to include:
- A restatement of the research problem
- A summary of your key arguments and/or findings
- A short discussion of the implications of your research
Don’t feel that you have to write the introduction first. The introduction is often one of the last parts of the research paper you’ll write, along with the conclusion.
This is because it can be easier to introduce your paper once you’ve already written the body ; you may not have the clearest idea of your arguments until you’ve written them, and things can change during the writing process .
The way you present your research problem in your introduction varies depending on the nature of your research paper . A research paper that presents a sustained argument will usually encapsulate this argument in a thesis statement .
A research paper designed to present the results of empirical research tends to present a research question that it seeks to answer. It may also include a hypothesis —a prediction that will be confirmed or disproved by your research.
The introduction of a research paper includes several key elements:
- A hook to catch the reader’s interest
- Relevant background on the topic
- Details of your research problem
and your problem statement
- A thesis statement or research question
- Sometimes an overview of the paper
Ask our team
Want to contact us directly? No problem. We are always here for you.
- Email [email protected]
- Start live chat
- Call +1 (510) 822-8066
- WhatsApp +31 20 261 6040

Our team helps students graduate by offering:
- A world-class citation generator
- Plagiarism Checker software powered by Turnitin
- Innovative Citation Checker software
- Professional proofreading services
- Over 300 helpful articles about academic writing, citing sources, plagiarism, and more
Scribbr specializes in editing study-related documents . We proofread:
- PhD dissertations
- Research proposals
- Personal statements
- Admission essays
- Motivation letters
- Reflection papers
- Journal articles
- Capstone projects
Scribbr’s Plagiarism Checker is powered by elements of Turnitin’s Similarity Checker , namely the plagiarism detection software and the Internet Archive and Premium Scholarly Publications content databases .
The add-on AI detector is powered by Scribbr’s proprietary software.
The Scribbr Citation Generator is developed using the open-source Citation Style Language (CSL) project and Frank Bennett’s citeproc-js . It’s the same technology used by dozens of other popular citation tools, including Mendeley and Zotero.
You can find all the citation styles and locales used in the Scribbr Citation Generator in our publicly accessible repository on Github .
Crafting Clear Pathways: Writing Objectives in Research Papers
Struggling to write research objectives? Follow our easy steps to learn how to craft effective and compelling objectives in research papers.

Are you struggling to define the goals and direction of your research? Are you losing yourself while doing research and tend to go astray from the intended research topic? Fear not, as many face the same problem and it is quite understandable to overcome this, a concept called research objective comes into play here.
In this article, we’ll delve into the world of the objectives in research papers and why they are essential for a successful study. We will be studying what they are and how they are used in research.
What is a Research Objective?
A research objective is a clear and specific goal that a researcher aims to achieve through a research study. It serves as a roadmap for the research, providing direction and focus. Research objectives are formulated based on the research questions or hypotheses, and they help in defining the scope of the study and guiding the research design and methodology. They also assist in evaluating the success and outcomes of the research.
Types of Research Objectives
There are typically three main types of objectives in a research paper:
- Exploratory Objectives: These objectives are focused on gaining a deeper understanding of a particular phenomenon, topic, or issue. Exploratory research objectives aim to explore and identify new ideas, insights, or patterns that were previously unknown or poorly understood. This type of objective is commonly used in preliminary or qualitative studies.
- Descriptive Objectives: Descriptive objectives seek to describe and document the characteristics, behaviors, or attributes of a specific population, event, or phenomenon. The purpose is to provide a comprehensive and accurate account of the subject of study. Descriptive research objectives often involve collecting and analyzing data through surveys, observations, or archival research.
- Explanatory or Causal Objectives: Explanatory objectives aim to establish a cause-and-effect relationship between variables or factors. These objectives focus on understanding why certain events or phenomena occur and how they are related to each other.
Also Read: What are the types of research?
Steps for Writing Objectives in Research Paper
1. identify the research topic:.
Clearly define the subject or topic of your research. This will provide a broad context for developing specific research objectives.
2. Conduct a Literature Review
Review existing literature and research related to your topic. This will help you understand the current state of knowledge, identify any research gaps, and refine your research objectives accordingly.
3. Identify the Research Questions or Hypotheses
Formulate specific research questions or hypotheses that you want to address in your study. These questions should be directly related to your research topic and guide the development of your research objectives.
4. Focus on Specific Goals
Break down the broader research questions or hypothesis into specific goals or objectives. Each objective should focus on a particular aspect of your research topic and be achievable within the scope of your study.
5. Use Clear and Measurable Language
Write your research objectives using clear and precise language. Avoid vague terms and use specific and measurable terms that can be observed, analyzed, or measured.
6. Consider Feasibility
Ensure that your research objectives are feasible within the available resources, time constraints, and ethical considerations. They should be realistic and attainable given the limitations of your study.
7. Prioritize Objectives
If you have multiple research objectives, prioritize them based on their importance and relevance to your overall research goals. This will help you allocate resources and focus your efforts accordingly.
8. Review and Refine
Review your research objectives to ensure they align with your research questions or hypotheses, and revise them if necessary. Seek feedback from peers or advisors to ensure clarity and coherence.
Tips for Writing Objectives in Research Paper
1. be clear and specific.
Clearly state what you intend to achieve with your research. Use specific language that leaves no room for ambiguity or confusion. This ensures that your objectives are well-defined and focused.
2. Use Action Verbs
Begin each research objective with an action verb that describes a measurable action or outcome. This helps make your objectives more actionable and measurable.
3. Align with Research Questions or Hypotheses
Your research objectives should directly address the research questions or hypotheses you have formulated. Ensure there is a clear connection between them to maintain coherence in your study.
4. Be Realistic and Feasible
Set research objectives that are attainable within the constraints of your study, including available resources, time, and ethical considerations. Unrealistic objectives may undermine the validity and reliability of your research.
5. Consider Relevance and Significance
Your research objectives should be relevant to your research topic and contribute to the broader field of study. Consider the potential impact and significance of achieving the objectives.
SMART Goals for Writing Research Objectives
To ensure that your research objectives are well-defined and effectively guide your study, you can apply the SMART framework. SMART stands for Specific, Measurable, Achievable, Relevant, and Time-bound. Here’s how you can make your research objectives SMART:
- Specific : Clearly state what you want to achieve in a precise and specific manner. Avoid vague or generalized language. Specify the population, variables, or phenomena of interest.
- Measurable : Ensure that your research objectives can be quantified or observed in a measurable way. This allows for objective evaluation and assessment of progress.
- Achievable : Set research objectives that are realistic and attainable within the available resources, time, and scope of your study. Consider the feasibility of conducting the research and collecting the necessary data.
- Relevant : Ensure that your research objectives are directly relevant to your research topic and contribute to the broader knowledge or understanding of the field. They should align with the purpose and significance of your study.
- Time-bound : Set a specific timeframe or deadline for achieving your research objectives. This helps create a sense of urgency and provides a clear timeline for your study.
Examples of Research Objectives
Here are some examples of research objectives from various fields of study:
- To examine the relationship between social media usage and self-esteem among young adults aged 18-25 in order to understand the potential impact on mental well-being.
- To assess the effectiveness of a mindfulness-based intervention in reducing stress levels and improving coping mechanisms among individuals diagnosed with anxiety disorders.
- To investigate the factors influencing consumer purchasing decisions in the e-commerce industry, with a focus on the role of online reviews and social media influencers.
- To analyze the effects of climate change on the biodiversity of coral reefs in a specific region, using remote sensing techniques and field surveys.
Importance of Research Objectives
Research objectives play a crucial role in the research process and hold significant importance for several reasons:
- Guiding the Research Process: Research objectives provide a clear roadmap for the entire research process. They help researchers stay focused and on track, ensuring that the study remains purposeful and relevant.
- Defining the Scope of the Study: Research objectives help in determining the boundaries and scope of the study. They clarify what aspects of the research topic will be explored and what will be excluded.
- Providing Direction for Data Collection and Analysis: Research objectives assist in identifying the type of data to be collected and the methods of data collection. They also guide the selection of appropriate data analysis techniques.
- Evaluating the Success of the Study: Research objectives serve as benchmarks for evaluating the success and outcomes of the research. They provide measurable criteria against which the researcher can assess whether the objectives have been met or not.
- Enhancing Communication and Collaboration: Clearly defined research objectives facilitate effective communication and collaboration among researchers, advisors, and stakeholders.
Common Mistakes to Avoid While Writing Research Objectives
When writing research objectives, it’s important to be aware of common mistakes and pitfalls that can undermine the effectiveness and clarity of your objectives. Here are some common mistakes to avoid:
- Vague or Ambiguous Language: One of the key mistakes is using vague or ambiguous language that lacks specificity. Ensure that your research objectives are clearly and precisely stated, leaving no room for misinterpretation or confusion.
- Lack of Measurability: Research objectives should be measurable, meaning that they should allow for the collection of data or evidence that can be quantified or observed. Avoid setting objectives that cannot be measured or assessed objectively.
- Lack of Alignment with Research Questions or Hypotheses: Your research objectives should directly align with the research questions or hypotheses you have formulated. Make sure there is a clear connection between them to maintain coherence in your study.
- Overgeneralization : Avoid writing research objectives that are too broad or encompass too many variables or phenomena. Overgeneralized objectives may lead to a lack of focus or feasibility in conducting the research.
- Unrealistic or Unattainable Objectives: Ensure that your research objectives are realistic and attainable within the available resources, time, and scope of your study. Setting unrealistic objectives may compromise the validity and reliability of your research.
In conclusion, research objectives are integral to the success and effectiveness of any research study. They provide a clear direction, focus, and purpose, guiding the entire research process from start to finish. By formulating specific, measurable, achievable, relevant, and time-bound objectives, researchers can define the scope of their study, guide data collection and analysis, and evaluate the outcomes of their research.
Turn your data into easy-to-understand and dynamic stories
When you wish to explain any complex data, it’s always advised to break it down into simpler visuals or stories. This is where Mind the Graph comes in. It is a platform that helps researchers and scientists to turn their data into easy-to-understand and dynamic stories, helping the audience understand the concepts better. Sign Up now to explore the library of scientific infographics.

Subscribe to our newsletter
Exclusive high quality content about effective visual communication in science.
About Sowjanya Pedada
Sowjanya is a passionate writer and an avid reader. She holds MBA in Agribusiness Management and now is working as a content writer. She loves to play with words and hopes to make a difference in the world through her writings. Apart from writing, she is interested in reading fiction novels and doing craftwork. She also loves to travel and explore different cuisines and spend time with her family and friends.
Content tags
Research Objectives: The Compass of Your Study
Table of contents
- 1 Definition and Purpose of Setting Clear Research Objectives
- 2 How Research Objectives Fit into the Overall Research Framework
- 3 Types of Research Objectives
- 4 Aligning Objectives with Research Questions and Hypotheses
- 5 Role of Research Objectives in Various Research Phases
- 6.1 Key characteristics of well-defined research objectives
- 6.2 Step-by-Step Guide on How to Formulate Both General and Specific Research Objectives
- 6.3 How to Know When Your Objectives Need Refinement
- 7 Research Objectives Examples in Different Fields
- 8 Conclusion
Embarking on a research journey without clear objectives is like navigating the sea without a compass. This article delves into the essence of establishing precise research objectives, serving as the guiding star for your scholarly exploration.
We will unfold the layers of how the objective of study not only defines the scope of your research but also directs every phase of the research process, from formulating research questions to interpreting research findings. By bridging theory with practical examples, we aim to illuminate the path to crafting effective research objectives that are both ambitious and attainable. Let’s chart the course to a successful research voyage, exploring the significance, types, and formulation of research paper objectives.
Definition and Purpose of Setting Clear Research Objectives
Defining the research objectives includes which two tasks? Research objectives are clear and concise statements that outline what you aim to achieve through your study. They are the foundation for determining your research scope, guiding your data collection methods, and shaping your analysis. The purpose of research proposal and setting clear objectives in it is to ensure that your research efforts are focused and efficient, and to provide a roadmap that keeps your study aligned with its intended outcomes.
To define the research objective at the outset, researchers can avoid the pitfalls of scope creep, where the study’s focus gradually broadens beyond its initial boundaries, leading to wasted resources and time. Clear objectives facilitate communication with stakeholders, such as funding bodies, academic supervisors, and the broader academic community, by succinctly conveying the study’s goals and significance. Furthermore, they help in the formulation of precise research questions and hypotheses, making the research process more systematic and organized. Yet, it is not always easy. For this reason, PapersOwl is always ready to help. Lastly, clear research objectives enable the researcher to critically assess the study’s progress and outcomes against predefined benchmarks, ensuring the research stays on track and delivers meaningful results.
How Research Objectives Fit into the Overall Research Framework
Research objectives are integral to the research framework as the nexus between the research problem, questions, and hypotheses. They translate the broad goals of your study into actionable steps, ensuring every aspect of your research is purposefully aligned towards addressing the research problem. This alignment helps in structuring the research design and methodology, ensuring that each component of the study is geared towards answering the core questions derived from the objectives. Creating such a difficult piece may take a lot of time. If you need it to be accurate yet fast delivered, consider getting professional research paper writing help whenever the time comes. It also aids in the identification and justification of the research methods and tools used for data collection and analysis, aligning them with the objectives to enhance the validity and reliability of the findings.
Furthermore, by setting clear objectives, researchers can more effectively evaluate the impact and significance of their work in contributing to existing knowledge. Additionally, research objectives guide literature review, enabling researchers to focus their examination on relevant studies and theoretical frameworks that directly inform their research goals.
Types of Research Objectives
In the landscape of research, setting objectives is akin to laying down the tracks for a train’s journey, guiding it towards its destination. Constructing these tracks involves defining two main types of objectives: general and specific. Each serves a unique purpose in guiding the research towards its ultimate goals, with general objectives providing the broad vision and specific objectives outlining the concrete steps needed to fulfill that vision. Together, they form a cohesive blueprint that directs the focus of the study, ensuring that every effort contributes meaningfully to the overarching research aims.
- General objectives articulate the overarching goals of your study. They are broad, setting the direction for your research without delving into specifics. These objectives capture what you wish to explore or contribute to existing knowledge.
- Specific objectives break down the general objectives into measurable outcomes. They are precise, detailing the steps needed to achieve the broader goals of your study. They often correspond to different aspects of your research question , ensuring a comprehensive approach to your study.
To illustrate, consider a research project on the impact of digital marketing on consumer behavior. A general objective might be “to explore the influence of digital marketing on consumer purchasing decisions.” Specific objectives could include “to assess the effectiveness of social media advertising in enhancing brand awareness” and “to evaluate the impact of email marketing on customer loyalty.”
Aligning Objectives with Research Questions and Hypotheses
The harmony between what research objectives should be, questions, and hypotheses is critical. Objectives define what you aim to achieve; research questions specify what you seek to understand, and hypotheses predict the expected outcomes.
This alignment ensures a coherent and focused research endeavor. Achieving it necessitates a thoughtful consideration of how each component interrelates, ensuring that the objectives are not only ambitious but also directly answerable through the research questions and testable via the hypotheses. This interconnectedness facilitates a streamlined approach to the research process, enabling researchers to systematically address each aspect of their study in a logical sequence. Moreover, it enhances the clarity and precision of the research, making it easier for peers and stakeholders to grasp the study’s direction and potential contributions.
Role of Research Objectives in Various Research Phases
Throughout the research process, objectives guide your choices and strategies – from selecting the appropriate research design and methods to analyzing data and interpreting results. They are the criteria against which you measure the success of your study. In the initial stages, research objectives inform the selection of a topic, helping to narrow down a broad area of interest into a focused question that can be explored in depth. During the methodology phase, they dictate the type of data needed and the best methods for obtaining that data, ensuring that every step taken is purposeful and aligned with the study’s goals. As the research progresses, objectives provide a framework for analyzing the collected data, guiding the researcher in identifying patterns, drawing conclusions, and making informed decisions.
Crafting Effective Research Objectives

The effective objective of research is pivotal in laying the groundwork for a successful investigation. These objectives clarify the focus of your study and determine its direction and scope. Ensuring that your objectives are well-defined and aligned with the SMART criteria is crucial for setting a strong foundation for your research.
Key characteristics of well-defined research objectives
Well-defined research objectives are characterized by the SMART criteria – Specific, Measurable, Achievable, Relevant, and Time-bound. Specific objectives clearly define what you plan to achieve, eliminating any ambiguity. Measurable objectives allow you to track progress and assess the outcome. Achievable objectives are realistic, considering the research sources and time available. Relevant objectives align with the broader goals of your field or research question. Finally, Time-bound objectives have a clear timeline for completion, adding urgency and a schedule to your work.
Step-by-Step Guide on How to Formulate Both General and Specific Research Objectives
So lets get to the part, how to write research objectives properly?
- Understand the issue or gap in existing knowledge your study aims to address.
- Gain insights into how similar challenges have been approached to refine your objectives.
- Articulate the broad goal of research based on your understanding of the problem.
- Detail the specific aspects of your research, ensuring they are actionable and measurable.
How to Know When Your Objectives Need Refinement
Your objectives of research may require refinement if they lack clarity, feasibility, or alignment with the research problem. If you find yourself struggling to design experiments or methods that directly address your objectives, or if the objectives seem too broad or not directly related to your research question, it’s likely time for refinement. Additionally, objectives in research proposal that do not facilitate a clear measurement of success indicate a need for a more precise definition. Refinement involves ensuring that each objective is specific, measurable, achievable, relevant, and time-bound, enhancing your research’s overall focus and impact.
Research Objectives Examples in Different Fields
The application of research objectives spans various academic disciplines, each with its unique focus and methodologies. To illustrate how the objectives of the study guide a research paper across different fields, here are some research objective examples:
- In Health Sciences , a research aim may be to “determine the efficacy of a new vaccine in reducing the incidence of a specific disease among a target population within one year.” This objective is specific (efficacy of a new vaccine), measurable (reduction in disease incidence), achievable (with the right study design and sample size), relevant (to public health), and time-bound (within one year).
- In Environmental Studies , the study objectives could be “to assess the impact of air pollution on urban biodiversity over a decade.” This reflects a commitment to understanding the long-term effects of human activities on urban ecosystems, emphasizing the need for sustainable urban planning.
- In Economics , an example objective of a study might be “to analyze the relationship between fiscal policies and unemployment rates in developing countries over the past twenty years.” This seeks to explore macroeconomic trends and inform policymaking, highlighting the role of economic research study in societal development.
These examples of research objectives describe the versatility and significance of research objectives in guiding scholarly inquiry across different domains. By setting clear, well-defined objectives, researchers can ensure their studies are focused and impactful and contribute valuable knowledge to their respective fields.
Defining research studies objectives and problem statement is not just a preliminary step, but a continuous guiding force throughout the research journey. These goals of research illuminate the path forward and ensure that every stride taken is meaningful and aligned with the ultimate goals of the inquiry. Whether through the meticulous application of the SMART criteria or the strategic alignment with research questions and hypotheses, the rigor in crafting and refining these objectives underscores the integrity and relevance of the research. As scholars venture into the vast terrains of knowledge, the clarity, and precision of their objectives serve as beacons of light, steering their explorations toward discoveries that advance academic discourse and resonate with the broader societal needs.
Readers also enjoyed

WHY WAIT? PLACE AN ORDER RIGHT NOW!
Just fill out the form, press the button, and have no worries!
We use cookies to give you the best experience possible. By continuing we’ll assume you board with our cookie policy.
- Aims and Objectives – A Guide for Academic Writing
- Doing a PhD
One of the most important aspects of a thesis, dissertation or research paper is the correct formulation of the aims and objectives. This is because your aims and objectives will establish the scope, depth and direction that your research will ultimately take. An effective set of aims and objectives will give your research focus and your reader clarity, with your aims indicating what is to be achieved, and your objectives indicating how it will be achieved.
Introduction
There is no getting away from the importance of the aims and objectives in determining the success of your research project. Unfortunately, however, it is an aspect that many students struggle with, and ultimately end up doing poorly. Given their importance, if you suspect that there is even the smallest possibility that you belong to this group of students, we strongly recommend you read this page in full.
This page describes what research aims and objectives are, how they differ from each other, how to write them correctly, and the common mistakes students make and how to avoid them. An example of a good aim and objectives from a past thesis has also been deconstructed to help your understanding.
What Are Aims and Objectives?
Research aims.
A research aim describes the main goal or the overarching purpose of your research project.
In doing so, it acts as a focal point for your research and provides your readers with clarity as to what your study is all about. Because of this, research aims are almost always located within its own subsection under the introduction section of a research document, regardless of whether it’s a thesis , a dissertation, or a research paper .
A research aim is usually formulated as a broad statement of the main goal of the research and can range in length from a single sentence to a short paragraph. Although the exact format may vary according to preference, they should all describe why your research is needed (i.e. the context), what it sets out to accomplish (the actual aim) and, briefly, how it intends to accomplish it (overview of your objectives).
To give an example, we have extracted the following research aim from a real PhD thesis:
Example of a Research Aim
The role of diametrical cup deformation as a factor to unsatisfactory implant performance has not been widely reported. The aim of this thesis was to gain an understanding of the diametrical deformation behaviour of acetabular cups and shells following impaction into the reamed acetabulum. The influence of a range of factors on deformation was investigated to ascertain if cup and shell deformation may be high enough to potentially contribute to early failure and high wear rates in metal-on-metal implants.
Note: Extracted with permission from thesis titled “T he Impact And Deformation Of Press-Fit Metal Acetabular Components ” produced by Dr H Hothi of previously Queen Mary University of London.
Research Objectives
Where a research aim specifies what your study will answer, research objectives specify how your study will answer it.
They divide your research aim into several smaller parts, each of which represents a key section of your research project. As a result, almost all research objectives take the form of a numbered list, with each item usually receiving its own chapter in a dissertation or thesis.
Following the example of the research aim shared above, here are it’s real research objectives as an example:
Example of a Research Objective
- Develop finite element models using explicit dynamics to mimic mallet blows during cup/shell insertion, initially using simplified experimentally validated foam models to represent the acetabulum.
- Investigate the number, velocity and position of impacts needed to insert a cup.
- Determine the relationship between the size of interference between the cup and cavity and deformation for different cup types.
- Investigate the influence of non-uniform cup support and varying the orientation of the component in the cavity on deformation.
- Examine the influence of errors during reaming of the acetabulum which introduce ovality to the cavity.
- Determine the relationship between changes in the geometry of the component and deformation for different cup designs.
- Develop three dimensional pelvis models with non-uniform bone material properties from a range of patients with varying bone quality.
- Use the key parameters that influence deformation, as identified in the foam models to determine the range of deformations that may occur clinically using the anatomic models and if these deformations are clinically significant.
It’s worth noting that researchers sometimes use research questions instead of research objectives, or in other cases both. From a high-level perspective, research questions and research objectives make the same statements, but just in different formats.
Taking the first three research objectives as an example, they can be restructured into research questions as follows:
Restructuring Research Objectives as Research Questions
- Can finite element models using simplified experimentally validated foam models to represent the acetabulum together with explicit dynamics be used to mimic mallet blows during cup/shell insertion?
- What is the number, velocity and position of impacts needed to insert a cup?
- What is the relationship between the size of interference between the cup and cavity and deformation for different cup types?
Difference Between Aims and Objectives
Hopefully the above explanations make clear the differences between aims and objectives, but to clarify:
- The research aim focus on what the research project is intended to achieve; research objectives focus on how the aim will be achieved.
- Research aims are relatively broad; research objectives are specific.
- Research aims focus on a project’s long-term outcomes; research objectives focus on its immediate, short-term outcomes.
- A research aim can be written in a single sentence or short paragraph; research objectives should be written as a numbered list.
How to Write Aims and Objectives
Before we discuss how to write a clear set of research aims and objectives, we should make it clear that there is no single way they must be written. Each researcher will approach their aims and objectives slightly differently, and often your supervisor will influence the formulation of yours on the basis of their own preferences.
Regardless, there are some basic principles that you should observe for good practice; these principles are described below.
Your aim should be made up of three parts that answer the below questions:
- Why is this research required?
- What is this research about?
- How are you going to do it?
The easiest way to achieve this would be to address each question in its own sentence, although it does not matter whether you combine them or write multiple sentences for each, the key is to address each one.
The first question, why , provides context to your research project, the second question, what , describes the aim of your research, and the last question, how , acts as an introduction to your objectives which will immediately follow.
Scroll through the image set below to see the ‘why, what and how’ associated with our research aim example.

Note: Your research aims need not be limited to one. Some individuals per to define one broad ‘overarching aim’ of a project and then adopt two or three specific research aims for their thesis or dissertation. Remember, however, that in order for your assessors to consider your research project complete, you will need to prove you have fulfilled all of the aims you set out to achieve. Therefore, while having more than one research aim is not necessarily disadvantageous, consider whether a single overarching one will do.
Research Objectives
Each of your research objectives should be SMART :
- Specific – is there any ambiguity in the action you are going to undertake, or is it focused and well-defined?
- Measurable – how will you measure progress and determine when you have achieved the action?
- Achievable – do you have the support, resources and facilities required to carry out the action?
- Relevant – is the action essential to the achievement of your research aim?
- Timebound – can you realistically complete the action in the available time alongside your other research tasks?
In addition to being SMART, your research objectives should start with a verb that helps communicate your intent. Common research verbs include:
Table of Research Verbs to Use in Aims and Objectives
| (Understanding and organising information) | (Solving problems using information) | (reaching conclusion from evidence) | (Breaking down into components) | (Judging merit) |
| Review Identify Explore Discover Discuss Summarise Describe | Interpret Apply Demonstrate Establish Determine Estimate Calculate Relate | Analyse Compare Inspect Examine Verify Select Test Arrange | Propose Design Formulate Collect Construct Prepare Undertake Assemble | Appraise Evaluate Compare Assess Recommend Conclude Select |
Last, format your objectives into a numbered list. This is because when you write your thesis or dissertation, you will at times need to make reference to a specific research objective; structuring your research objectives in a numbered list will provide a clear way of doing this.
To bring all this together, let’s compare the first research objective in the previous example with the above guidance:
Checking Research Objective Example Against Recommended Approach
Research Objective:
1. Develop finite element models using explicit dynamics to mimic mallet blows during cup/shell insertion, initially using simplified experimentally validated foam models to represent the acetabulum.
Checking Against Recommended Approach:
Q: Is it specific? A: Yes, it is clear what the student intends to do (produce a finite element model), why they intend to do it (mimic cup/shell blows) and their parameters have been well-defined ( using simplified experimentally validated foam models to represent the acetabulum ).
Q: Is it measurable? A: Yes, it is clear that the research objective will be achieved once the finite element model is complete.
Q: Is it achievable? A: Yes, provided the student has access to a computer lab, modelling software and laboratory data.
Q: Is it relevant? A: Yes, mimicking impacts to a cup/shell is fundamental to the overall aim of understanding how they deform when impacted upon.
Q: Is it timebound? A: Yes, it is possible to create a limited-scope finite element model in a relatively short time, especially if you already have experience in modelling.
Q: Does it start with a verb? A: Yes, it starts with ‘develop’, which makes the intent of the objective immediately clear.
Q: Is it a numbered list? A: Yes, it is the first research objective in a list of eight.
Mistakes in Writing Research Aims and Objectives
1. making your research aim too broad.
Having a research aim too broad becomes very difficult to achieve. Normally, this occurs when a student develops their research aim before they have a good understanding of what they want to research. Remember that at the end of your project and during your viva defence , you will have to prove that you have achieved your research aims; if they are too broad, this will be an almost impossible task. In the early stages of your research project, your priority should be to narrow your study to a specific area. A good way to do this is to take the time to study existing literature, question their current approaches, findings and limitations, and consider whether there are any recurring gaps that could be investigated .
Note: Achieving a set of aims does not necessarily mean proving or disproving a theory or hypothesis, even if your research aim was to, but having done enough work to provide a useful and original insight into the principles that underlie your research aim.
2. Making Your Research Objectives Too Ambitious
Be realistic about what you can achieve in the time you have available. It is natural to want to set ambitious research objectives that require sophisticated data collection and analysis, but only completing this with six months before the end of your PhD registration period is not a worthwhile trade-off.
3. Formulating Repetitive Research Objectives
Each research objective should have its own purpose and distinct measurable outcome. To this effect, a common mistake is to form research objectives which have large amounts of overlap. This makes it difficult to determine when an objective is truly complete, and also presents challenges in estimating the duration of objectives when creating your project timeline. It also makes it difficult to structure your thesis into unique chapters, making it more challenging for you to write and for your audience to read.
Fortunately, this oversight can be easily avoided by using SMART objectives.
Hopefully, you now have a good idea of how to create an effective set of aims and objectives for your research project, whether it be a thesis, dissertation or research paper. While it may be tempting to dive directly into your research, spending time on getting your aims and objectives right will give your research clear direction. This won’t only reduce the likelihood of problems arising later down the line, but will also lead to a more thorough and coherent research project.
Finding a PhD has never been this easy – search for a PhD by keyword, location or academic area of interest.
Browse PhDs Now
Join thousands of students.
Join thousands of other students and stay up to date with the latest PhD programmes, funding opportunities and advice.
Writing the Research Objectives: 5 Straightforward Examples
The research objective of a research proposal or scientific article defines the direction or content of a research investigation. Without the research objectives, the proposal or research paper is in disarray. It is like a fisherman riding on a boat without any purpose and with no destination in sight. Therefore, at the beginning of any research venture, the researcher must be clear about what he or she intends to do or achieve in conducting a study.
How do you define the objectives of a study? What are the uses of the research objective? How would a researcher write this essential part of the research? This article aims to provide answers to these questions.
Table of Contents
Definition of a research objective.
“ What does the researcher want or hope to achieve at the end of the research project.”
What are the Uses of the Research Objective?
The uses of the research objective are enumerated below:
The research design serves as the “blueprint” for the research investigation. The University of Southern California describes the different types of research design extensively. It details the data to be gathered, data collection procedure, data measurement, and statistical tests to use in the analysis.
The variables of the study include those factors that the researcher wants to evaluate in the study. These variables narrow down the research to several manageable components to see differences or correlations between them.
Specifying the data collection procedure ensures data accuracy and integrity . Thus, the probability of error is minimized. Generalizations or conclusions based on valid arguments founded on reliable data strengthens research findings on particular issues and problems.
In data mining activities where large data sets are involved, the research objective plays a crucial role. Without a clear objective to guide the machine learning process, the desired outcomes will not be met.
How is the Research Objective Written?
Before forming a research objective, you should read about all the developments in your area of research and find gaps in knowledge that need to be addressed. Readings will help you come up with suitable objectives for your research project.
5 Examples of Research Objectives
The following examples of research objectives based on several published studies on various topics demonstrate how the research objectives are written:
Finally, writing the research objectives requires constant practice, experience, and knowledge about the topic investigated. Clearly written objectives save time, money, and effort.
I wrote a detailed, step-by-step guide on how to develop a conceptual framework with illustration in my post titled “ Conceptual Framework: A Step by Step Guide on How to Make One. “
Evans, K. L., Rodrigues, A. S., Chown, S. L., & Gaston, K. J. (2006). Protected areas and regional avian species richness in South Africa. Biology letters , 2 (2), 184-188.
Yeemin, T., Sutthacheep, M., & Pettongma, R. (2006). Coral reef restoration projects in Thailand. Ocean & Coastal Management , 49 (9-10), 562-575.
© 2020 March 23 P. A. Regoniel Updated 17 November 2020 | Updated 18 January 2024
Related Posts
A critique on the cooperative writing response groups, the yaya dub phenomenon: why videos go viral, lingoconomics – an emerging theory in language acquisition, about the author, patrick regoniel, simplyeducate.me privacy policy.
We use cookies to give you the best experience possible. By continuing we’ll assume you’re on board with our cookie policy
- A Research Guide
- Research Paper Guide
How to Write Research Objectives
- What are research objectives
- Step-by-step writing guide
- Helpful tips
- Research objectives examples
What are research objectives, and why are they important?
Step-by-step research objectives writing guide, step 1: provide the major background of your research, step 2: mention several objectives from the most to least important aspects, step 3: follow your resources and do not promise too much, step 4: keep your objectives and limitations mentioned, step 5: provide action verbs and tone, helpful tips for writing research objectives.
- Keep your content specific! It is necessary to narrow things down and leave no space for double meanings or confusion. If some idea cannot be supported with a piece of evidence, it’s better to avoid it in your objectives.
- Objectives must be measurable! It is crucial to make it possible to replicate your work in further research. Creating an outline as you strive for your goals and set the purpose is necessary.
- Keeping things relevant! Your research objectives should be related to your thesis statement and the subject that you have chosen to work with. It will help to avoid introducing ideas that are not related to your work.
- Temporal factor! Set deadlines to track your progress and provide a setting for your research if it is relevant. It will help your target audience to see your limitations and specifics.
Research objectives example
Research objective 1: The study aims to explore the origins and evolution of the youth movements in the Flemish provinces in Belgium, namely Chiro and KSA. This research evaluates the major differences during the post-WW2 period and the social factors that created differences between the movements.
Research objective 2: This paper implements surveys and personal interviews to determine first-hand feedback from the youth members and the team leaders.
Research objective 3: Aiming to compare and contrast, this study determines the positive outcomes of the unity project work between the branches of the youth movement in Belgium, aiming for statistical data to support it.

Receive paper in 3 Hours!
- Choose the number of pages.
- Select your deadline.
- Complete your order.
Number of Pages
550 words (double spaced)
Deadline: 10 days left
By clicking "Log In", you agree to our terms of service and privacy policy . We'll occasionally send you account related and promo emails.
Sign Up for your FREE account
- Privacy Policy
Home » Research Paper – Structure, Examples and Writing Guide
Research Paper – Structure, Examples and Writing Guide
Table of Contents

Research Paper
Definition:
Research Paper is a written document that presents the author’s original research, analysis, and interpretation of a specific topic or issue.
It is typically based on Empirical Evidence, and may involve qualitative or quantitative research methods, or a combination of both. The purpose of a research paper is to contribute new knowledge or insights to a particular field of study, and to demonstrate the author’s understanding of the existing literature and theories related to the topic.
Structure of Research Paper
The structure of a research paper typically follows a standard format, consisting of several sections that convey specific information about the research study. The following is a detailed explanation of the structure of a research paper:
The title page contains the title of the paper, the name(s) of the author(s), and the affiliation(s) of the author(s). It also includes the date of submission and possibly, the name of the journal or conference where the paper is to be published.
The abstract is a brief summary of the research paper, typically ranging from 100 to 250 words. It should include the research question, the methods used, the key findings, and the implications of the results. The abstract should be written in a concise and clear manner to allow readers to quickly grasp the essence of the research.
Introduction
The introduction section of a research paper provides background information about the research problem, the research question, and the research objectives. It also outlines the significance of the research, the research gap that it aims to fill, and the approach taken to address the research question. Finally, the introduction section ends with a clear statement of the research hypothesis or research question.
Literature Review
The literature review section of a research paper provides an overview of the existing literature on the topic of study. It includes a critical analysis and synthesis of the literature, highlighting the key concepts, themes, and debates. The literature review should also demonstrate the research gap and how the current study seeks to address it.
The methods section of a research paper describes the research design, the sample selection, the data collection and analysis procedures, and the statistical methods used to analyze the data. This section should provide sufficient detail for other researchers to replicate the study.
The results section presents the findings of the research, using tables, graphs, and figures to illustrate the data. The findings should be presented in a clear and concise manner, with reference to the research question and hypothesis.
The discussion section of a research paper interprets the findings and discusses their implications for the research question, the literature review, and the field of study. It should also address the limitations of the study and suggest future research directions.
The conclusion section summarizes the main findings of the study, restates the research question and hypothesis, and provides a final reflection on the significance of the research.
The references section provides a list of all the sources cited in the paper, following a specific citation style such as APA, MLA or Chicago.
How to Write Research Paper
You can write Research Paper by the following guide:
- Choose a Topic: The first step is to select a topic that interests you and is relevant to your field of study. Brainstorm ideas and narrow down to a research question that is specific and researchable.
- Conduct a Literature Review: The literature review helps you identify the gap in the existing research and provides a basis for your research question. It also helps you to develop a theoretical framework and research hypothesis.
- Develop a Thesis Statement : The thesis statement is the main argument of your research paper. It should be clear, concise and specific to your research question.
- Plan your Research: Develop a research plan that outlines the methods, data sources, and data analysis procedures. This will help you to collect and analyze data effectively.
- Collect and Analyze Data: Collect data using various methods such as surveys, interviews, observations, or experiments. Analyze data using statistical tools or other qualitative methods.
- Organize your Paper : Organize your paper into sections such as Introduction, Literature Review, Methods, Results, Discussion, and Conclusion. Ensure that each section is coherent and follows a logical flow.
- Write your Paper : Start by writing the introduction, followed by the literature review, methods, results, discussion, and conclusion. Ensure that your writing is clear, concise, and follows the required formatting and citation styles.
- Edit and Proofread your Paper: Review your paper for grammar and spelling errors, and ensure that it is well-structured and easy to read. Ask someone else to review your paper to get feedback and suggestions for improvement.
- Cite your Sources: Ensure that you properly cite all sources used in your research paper. This is essential for giving credit to the original authors and avoiding plagiarism.
Research Paper Example
Note : The below example research paper is for illustrative purposes only and is not an actual research paper. Actual research papers may have different structures, contents, and formats depending on the field of study, research question, data collection and analysis methods, and other factors. Students should always consult with their professors or supervisors for specific guidelines and expectations for their research papers.
Research Paper Example sample for Students:
Title: The Impact of Social Media on Mental Health among Young Adults
Abstract: This study aims to investigate the impact of social media use on the mental health of young adults. A literature review was conducted to examine the existing research on the topic. A survey was then administered to 200 university students to collect data on their social media use, mental health status, and perceived impact of social media on their mental health. The results showed that social media use is positively associated with depression, anxiety, and stress. The study also found that social comparison, cyberbullying, and FOMO (Fear of Missing Out) are significant predictors of mental health problems among young adults.
Introduction: Social media has become an integral part of modern life, particularly among young adults. While social media has many benefits, including increased communication and social connectivity, it has also been associated with negative outcomes, such as addiction, cyberbullying, and mental health problems. This study aims to investigate the impact of social media use on the mental health of young adults.
Literature Review: The literature review highlights the existing research on the impact of social media use on mental health. The review shows that social media use is associated with depression, anxiety, stress, and other mental health problems. The review also identifies the factors that contribute to the negative impact of social media, including social comparison, cyberbullying, and FOMO.
Methods : A survey was administered to 200 university students to collect data on their social media use, mental health status, and perceived impact of social media on their mental health. The survey included questions on social media use, mental health status (measured using the DASS-21), and perceived impact of social media on their mental health. Data were analyzed using descriptive statistics and regression analysis.
Results : The results showed that social media use is positively associated with depression, anxiety, and stress. The study also found that social comparison, cyberbullying, and FOMO are significant predictors of mental health problems among young adults.
Discussion : The study’s findings suggest that social media use has a negative impact on the mental health of young adults. The study highlights the need for interventions that address the factors contributing to the negative impact of social media, such as social comparison, cyberbullying, and FOMO.
Conclusion : In conclusion, social media use has a significant impact on the mental health of young adults. The study’s findings underscore the need for interventions that promote healthy social media use and address the negative outcomes associated with social media use. Future research can explore the effectiveness of interventions aimed at reducing the negative impact of social media on mental health. Additionally, longitudinal studies can investigate the long-term effects of social media use on mental health.
Limitations : The study has some limitations, including the use of self-report measures and a cross-sectional design. The use of self-report measures may result in biased responses, and a cross-sectional design limits the ability to establish causality.
Implications: The study’s findings have implications for mental health professionals, educators, and policymakers. Mental health professionals can use the findings to develop interventions that address the negative impact of social media use on mental health. Educators can incorporate social media literacy into their curriculum to promote healthy social media use among young adults. Policymakers can use the findings to develop policies that protect young adults from the negative outcomes associated with social media use.
References :
- Twenge, J. M., & Campbell, W. K. (2019). Associations between screen time and lower psychological well-being among children and adolescents: Evidence from a population-based study. Preventive medicine reports, 15, 100918.
- Primack, B. A., Shensa, A., Escobar-Viera, C. G., Barrett, E. L., Sidani, J. E., Colditz, J. B., … & James, A. E. (2017). Use of multiple social media platforms and symptoms of depression and anxiety: A nationally-representative study among US young adults. Computers in Human Behavior, 69, 1-9.
- Van der Meer, T. G., & Verhoeven, J. W. (2017). Social media and its impact on academic performance of students. Journal of Information Technology Education: Research, 16, 383-398.
Appendix : The survey used in this study is provided below.
Social Media and Mental Health Survey
- How often do you use social media per day?
- Less than 30 minutes
- 30 minutes to 1 hour
- 1 to 2 hours
- 2 to 4 hours
- More than 4 hours
- Which social media platforms do you use?
- Others (Please specify)
- How often do you experience the following on social media?
- Social comparison (comparing yourself to others)
- Cyberbullying
- Fear of Missing Out (FOMO)
- Have you ever experienced any of the following mental health problems in the past month?
- Do you think social media use has a positive or negative impact on your mental health?
- Very positive
- Somewhat positive
- Somewhat negative
- Very negative
- In your opinion, which factors contribute to the negative impact of social media on mental health?
- Social comparison
- In your opinion, what interventions could be effective in reducing the negative impact of social media on mental health?
- Education on healthy social media use
- Counseling for mental health problems caused by social media
- Social media detox programs
- Regulation of social media use
Thank you for your participation!
Applications of Research Paper
Research papers have several applications in various fields, including:
- Advancing knowledge: Research papers contribute to the advancement of knowledge by generating new insights, theories, and findings that can inform future research and practice. They help to answer important questions, clarify existing knowledge, and identify areas that require further investigation.
- Informing policy: Research papers can inform policy decisions by providing evidence-based recommendations for policymakers. They can help to identify gaps in current policies, evaluate the effectiveness of interventions, and inform the development of new policies and regulations.
- Improving practice: Research papers can improve practice by providing evidence-based guidance for professionals in various fields, including medicine, education, business, and psychology. They can inform the development of best practices, guidelines, and standards of care that can improve outcomes for individuals and organizations.
- Educating students : Research papers are often used as teaching tools in universities and colleges to educate students about research methods, data analysis, and academic writing. They help students to develop critical thinking skills, research skills, and communication skills that are essential for success in many careers.
- Fostering collaboration: Research papers can foster collaboration among researchers, practitioners, and policymakers by providing a platform for sharing knowledge and ideas. They can facilitate interdisciplinary collaborations and partnerships that can lead to innovative solutions to complex problems.
When to Write Research Paper
Research papers are typically written when a person has completed a research project or when they have conducted a study and have obtained data or findings that they want to share with the academic or professional community. Research papers are usually written in academic settings, such as universities, but they can also be written in professional settings, such as research organizations, government agencies, or private companies.
Here are some common situations where a person might need to write a research paper:
- For academic purposes: Students in universities and colleges are often required to write research papers as part of their coursework, particularly in the social sciences, natural sciences, and humanities. Writing research papers helps students to develop research skills, critical thinking skills, and academic writing skills.
- For publication: Researchers often write research papers to publish their findings in academic journals or to present their work at academic conferences. Publishing research papers is an important way to disseminate research findings to the academic community and to establish oneself as an expert in a particular field.
- To inform policy or practice : Researchers may write research papers to inform policy decisions or to improve practice in various fields. Research findings can be used to inform the development of policies, guidelines, and best practices that can improve outcomes for individuals and organizations.
- To share new insights or ideas: Researchers may write research papers to share new insights or ideas with the academic or professional community. They may present new theories, propose new research methods, or challenge existing paradigms in their field.
Purpose of Research Paper
The purpose of a research paper is to present the results of a study or investigation in a clear, concise, and structured manner. Research papers are written to communicate new knowledge, ideas, or findings to a specific audience, such as researchers, scholars, practitioners, or policymakers. The primary purposes of a research paper are:
- To contribute to the body of knowledge : Research papers aim to add new knowledge or insights to a particular field or discipline. They do this by reporting the results of empirical studies, reviewing and synthesizing existing literature, proposing new theories, or providing new perspectives on a topic.
- To inform or persuade: Research papers are written to inform or persuade the reader about a particular issue, topic, or phenomenon. They present evidence and arguments to support their claims and seek to persuade the reader of the validity of their findings or recommendations.
- To advance the field: Research papers seek to advance the field or discipline by identifying gaps in knowledge, proposing new research questions or approaches, or challenging existing assumptions or paradigms. They aim to contribute to ongoing debates and discussions within a field and to stimulate further research and inquiry.
- To demonstrate research skills: Research papers demonstrate the author’s research skills, including their ability to design and conduct a study, collect and analyze data, and interpret and communicate findings. They also demonstrate the author’s ability to critically evaluate existing literature, synthesize information from multiple sources, and write in a clear and structured manner.
Characteristics of Research Paper
Research papers have several characteristics that distinguish them from other forms of academic or professional writing. Here are some common characteristics of research papers:
- Evidence-based: Research papers are based on empirical evidence, which is collected through rigorous research methods such as experiments, surveys, observations, or interviews. They rely on objective data and facts to support their claims and conclusions.
- Structured and organized: Research papers have a clear and logical structure, with sections such as introduction, literature review, methods, results, discussion, and conclusion. They are organized in a way that helps the reader to follow the argument and understand the findings.
- Formal and objective: Research papers are written in a formal and objective tone, with an emphasis on clarity, precision, and accuracy. They avoid subjective language or personal opinions and instead rely on objective data and analysis to support their arguments.
- Citations and references: Research papers include citations and references to acknowledge the sources of information and ideas used in the paper. They use a specific citation style, such as APA, MLA, or Chicago, to ensure consistency and accuracy.
- Peer-reviewed: Research papers are often peer-reviewed, which means they are evaluated by other experts in the field before they are published. Peer-review ensures that the research is of high quality, meets ethical standards, and contributes to the advancement of knowledge in the field.
- Objective and unbiased: Research papers strive to be objective and unbiased in their presentation of the findings. They avoid personal biases or preconceptions and instead rely on the data and analysis to draw conclusions.
Advantages of Research Paper
Research papers have many advantages, both for the individual researcher and for the broader academic and professional community. Here are some advantages of research papers:
- Contribution to knowledge: Research papers contribute to the body of knowledge in a particular field or discipline. They add new information, insights, and perspectives to existing literature and help advance the understanding of a particular phenomenon or issue.
- Opportunity for intellectual growth: Research papers provide an opportunity for intellectual growth for the researcher. They require critical thinking, problem-solving, and creativity, which can help develop the researcher’s skills and knowledge.
- Career advancement: Research papers can help advance the researcher’s career by demonstrating their expertise and contributions to the field. They can also lead to new research opportunities, collaborations, and funding.
- Academic recognition: Research papers can lead to academic recognition in the form of awards, grants, or invitations to speak at conferences or events. They can also contribute to the researcher’s reputation and standing in the field.
- Impact on policy and practice: Research papers can have a significant impact on policy and practice. They can inform policy decisions, guide practice, and lead to changes in laws, regulations, or procedures.
- Advancement of society: Research papers can contribute to the advancement of society by addressing important issues, identifying solutions to problems, and promoting social justice and equality.
Limitations of Research Paper
Research papers also have some limitations that should be considered when interpreting their findings or implications. Here are some common limitations of research papers:
- Limited generalizability: Research findings may not be generalizable to other populations, settings, or contexts. Studies often use specific samples or conditions that may not reflect the broader population or real-world situations.
- Potential for bias : Research papers may be biased due to factors such as sample selection, measurement errors, or researcher biases. It is important to evaluate the quality of the research design and methods used to ensure that the findings are valid and reliable.
- Ethical concerns: Research papers may raise ethical concerns, such as the use of vulnerable populations or invasive procedures. Researchers must adhere to ethical guidelines and obtain informed consent from participants to ensure that the research is conducted in a responsible and respectful manner.
- Limitations of methodology: Research papers may be limited by the methodology used to collect and analyze data. For example, certain research methods may not capture the complexity or nuance of a particular phenomenon, or may not be appropriate for certain research questions.
- Publication bias: Research papers may be subject to publication bias, where positive or significant findings are more likely to be published than negative or non-significant findings. This can skew the overall findings of a particular area of research.
- Time and resource constraints: Research papers may be limited by time and resource constraints, which can affect the quality and scope of the research. Researchers may not have access to certain data or resources, or may be unable to conduct long-term studies due to practical limitations.
About the author

Muhammad Hassan
Researcher, Academic Writer, Web developer
You may also like

Research Questions – Types, Examples and Writing...

Context of the Study – Writing Guide and Examples

Assignment – Types, Examples and Writing Guide

Table of Contents – Types, Formats, Examples

Research Topics – Ideas and Examples

What is a Hypothesis – Types, Examples and...

Formulating Research Aims and Objectives
Formulating research aim and objectives in an appropriate manner is one of the most important aspects of your thesis. This is because research aim and objectives determine the scope, depth and the overall direction of the research. Research question is the central question of the study that has to be answered on the basis of research findings.
Research aim emphasizes what needs to be achieved within the scope of the research, by the end of the research process. Achievement of research aim provides answer to the research question.
Research objectives divide research aim into several parts and address each part separately. Research aim specifies WHAT needs to be studied and research objectives comprise a number of steps that address HOW research aim will be achieved.
As a rule of dumb, there would be one research aim and several research objectives. Achievement of each research objective will lead to the achievement of the research aim.
Consider the following as an example:
Research title: Effects of organizational culture on business profitability: a case study of Virgin Atlantic
Research aim: To assess the effects of Virgin Atlantic organizational culture on business profitability
Following research objectives would facilitate the achievement of this aim:
- Analyzing the nature of organizational culture at Virgin Atlantic by September 1, 2022
- Identifying factors impacting Virgin Atlantic organizational culture by September 16, 2022
- Analyzing impacts of Virgin Atlantic organizational culture on employee performances by September 30, 2022
- Providing recommendations to Virgin Atlantic strategic level management in terms of increasing the level of effectiveness of organizational culture by October 5, 2022
Figure below illustrates additional examples in formulating research aims and objectives:

Formulation of research question, aim and objectives
Common mistakes in the formulation of research aim relate to the following:
1. Choosing the topic too broadly . This is the most common mistake. For example, a research title of “an analysis of leadership practices” can be classified as too broad because the title fails to answer the following questions:
a) Which aspects of leadership practices? Leadership has many aspects such as employee motivation, ethical behaviour, strategic planning, change management etc. An attempt to cover all of these aspects of organizational leadership within a single research will result in an unfocused and poor work.
b) An analysis of leadership practices in which country? Leadership practices tend to be different in various countries due to cross-cultural differences, legislations and a range of other region-specific factors. Therefore, a study of leadership practices needs to be country-specific.
c) Analysis of leadership practices in which company or industry? Similar to the point above, analysis of leadership practices needs to take into account industry-specific and/or company-specific differences, and there is no way to conduct a leadership research that relates to all industries and organizations in an equal manner.
Accordingly, as an example “a study into the impacts of ethical behaviour of a leader on the level of employee motivation in US healthcare sector” would be a more appropriate title than simply “An analysis of leadership practices”.
2. Setting an unrealistic aim . Formulation of a research aim that involves in-depth interviews with Apple strategic level management by an undergraduate level student can be specified as a bit over-ambitious. This is because securing an interview with Apple CEO Tim Cook or members of Apple Board of Directors might not be easy. This is an extreme example of course, but you got the idea. Instead, you may aim to interview the manager of your local Apple store and adopt a more feasible strategy to get your dissertation completed.
3. Choosing research methods incompatible with the timeframe available . Conducting interviews with 20 sample group members and collecting primary data through 2 focus groups when only three months left until submission of your dissertation can be very difficult, if not impossible. Accordingly, timeframe available need to be taken into account when formulating research aims and objectives and selecting research methods.
Moreover, research objectives need to be formulated according to SMART principle,
where the abbreviation stands for specific, measurable, achievable, realistic, and time-bound.
| Study employee motivation of Coca-Cola | To study the impacts of management practices on the levels of employee motivation at Coca-Cola US by December 5, 2022
|
| Analyze consumer behaviour in catering industry
| Analyzing changes in consumer behaviour in catering industry in the 21 century in the UK by March 1, 2022 |
| Recommend Toyota Motor Corporation management on new market entry strategy
| Formulating recommendations to Toyota Motor Corporation management on the choice of appropriate strategy to enter Vietnam market by June 9, 2022
|
| Analyze the impact of social media marketing on business
| Assessing impacts of integration of social media into marketing strategy on the level of brand awareness by March 30, 2022
|
| Finding out about time management principles used by Accenture managers | Identifying main time-management strategies used by managers of Accenture France by December 1, 2022 |
Examples of SMART research objectives
At the conclusion part of your research project you will need to reflect on the level of achievement of research aims and objectives. In case your research aims and objectives are not fully achieved by the end of the study, you will need to discuss the reasons. These may include initial inappropriate formulation of research aims and objectives, effects of other variables that were not considered at the beginning of the research or changes in some circumstances during the research process.

John Dudovskiy
What are you doing and how are you doing it? Articulating your aims and objectives.
Mar 6, 2019

Have you checked out the rest of The PhD Knowledge Base ? It’s home to hundreds more free resources and guides, written especially for PhD students.
How long does it take the person reading your thesis to understand what you’re doing and how you’re doing it? If the answer is anything other than ’in the opening paragraphs of the thesis’ then keep reading.
If you tell them as early as possible what you’re doing and how you’re doing it – and do so in clear and simple terms – whatever you write after will make much more sense. If you leave them guessing for ten pages, everything they read in those ten pages has no coherence. You’ll know where it is all leading, but they won’t.
Unless you tell them.
If you tell the reader what you’re doing as early as possible in clear and simple terms, whatever you write after will make much more sense.
What are aims & objectives?
If you build a house without foundations, it’s pretty obvious what will happen. It’ll collapse. Your thesis is the same; fail to build the foundations and your thesis just won’t work .
Your aims and objectives are those foundations. That’s why we’ve put them right at the top of our PhD Writing Template (if you haven’t already downloaded it, join the thousands who have by clicking here ).
If you write your aims and objectives clearly then you’ll make your reader’s life easier.
A lot of students fail to clearly articulate their aims and objectives because they aren’t sure themselves what they actually are.
Picture this: if there’s one thing that every PhD student hates it’s being asked by a stranger what their research is on.

Your PhD thesis. All on one page.
Use our free PhD structure template to quickly visualise every element of your thesis.
Hello, Doctor…
Sounds good, doesn’t it? Be able to call yourself Doctor sooner with our five-star rated How to Write A PhD email-course. Learn everything your supervisor should have taught you about planning and completing a PhD.
Now half price. Join hundreds of other students and become a better thesis writer, or your money back.
Research aims
Your research aims are the answer to the question, ‘What are you doing?’
1. You need to clearly describe what your intentions are and what you hope to achieve. These are your aims.
2. Your aims may be to test theory in a new empirical setting, derive new theory entirely, construct a new data-set, replicate an existing study, question existing orthodoxy, and so on. Whatever they are, clearly articulate them and do so early. Definitely include them in your introduction and, if you’re smart, you’ll write them in your abstract .
3. Be very explicit . In the opening paragraphs, say, in simple terms, ‘ the aim of this thesis is to …’
4. Think of your aims then as a statement of intent. They are a promise to the reader that you are going to do something. You use the next two hundred pages or so to follow through on that promise. If you don’t make the promise, the reader won’t understand your follow-through. Simple as that.
Because they serve as the starting point of the study, there needs to be a flow from your aims through your objectives (more on this below) to your research questions and contribution and then into the study itself. If you have completed your research and found that you answered a different question (not that uncommon), make sure your original aims are still valid. If they aren’t, refine them.
If you struggle to explain in simple terms what your research is about and why it matters, you may need to refine your aims and objectives to make them more concise.
When writing up your aims, there are a number of things to bear in mind.
1. Avoid listing too many. Your PhD isn’t as long as you think it is and you won’t have time or room for more than around two or three.
2. When you write them up, be very specific. Don’t leave things so vague that the reader is left unsure or unclear on what you aim to achieve.
3. Make sure there is a logical flow between each of your aims. They should make sense together and should each be separate components which, when added together, are bigger than the sum of their parts.
Research objectives
Your aims answer the question, ‘What are you doing?’ The objectives are the answer to the question, ‘How are you doing it?’
Research objectives refer to the goals or steps that you will take to achieve your aims.
When you write them, make sure they are SMART.
- S pecific: talk in a precise and clear way about what you are going to do.
- M easurable: how will you know when you have achieved your aim?
- A chievable: make sure that you aren’t overly ambitious.
- R ealistic: recognise the time and resource constraints that come with doing a PhD and don’t attempt to do too much.
- T ime constrained: determine when each objective needs to be completed.
You need to be as explicit as possible here. Leave the reader in no doubt about what you will do to achieve your aims. Step by step. Leave no ambiguity. At the same time, be careful not to repeat your methods chapter here. Just hint at your methods by presenting the headlines. You’ll have plenty of space in your methods discussion to flesh out the detail.
Elsewhere in the thesis you will necessarily have to talk in a complex language and juggle complex ideas. Here you don’t. You can write in clear, plain sentences.
What is the difference between research aims and objectives?
The aims of a study describe what you hope to achieve. The objectives detail how you are going to achieve your aims.
Let’s use an example to illustrate.
- To understand the contribution that local governments make to national level energy policy.
Objectives:
- Conduct a survey of local politicians to solicit responses.
- Conduct desk-research of local government websites to create a database of local energy policy.
- Interview national level politicians to understand the impact these local policies have had.
- Data will be coded using a code book derived from dominant theories of governance.
If you’re still struggling, Professor Pat Thompson’s great blog has a guide that will help.
Leave the reader in no doubt about what you will do to achieve your aims. Step by step. Leave no ambiguity.
I can’t articulate them clearly, my research is complicated!
Of course your research is complex. That’s the name of the game. But the sign of someone being able to master complexity is their ability to summarise it . Sure, you’re not looking to capture all the richness and detail in a short summary of aims and objectives, but you are looking to tell the reader what you’re doing and how you’re doing it.
If you’re struggling to clearly articulate your aims and objectives, then try the following task. At the top of a Post-it note write the sentence: ‘In this research I will…’. Then keep trying until you can fit an answer onto one single Post-it note. The answer should answer two questions: what are are you doing and how are you doing it?
Remember – whenever you write, make it as clear as possible. Pay attention to the words ‘as possible’ there. That means you should write as clearly as you can given the fact that your subject and research is necessarily complex. Think of it the other way: it’s about not making things more complicated and unclear than they need to be.
In other words, make your reader’s job as easy as you can. They’ll thank you for it.
If you’re still having trouble, get in touch to arrange a one-on-one coaching session and we can work through your aims and objectives together.
Share this:
32 comments.

The write up is quite inspiring.

My topic is setting up a healing gardens in hospitals Need a aim and objectives for a dissertation

Dis is really good and more understandable thanks

Crisp, concise, and easy to understnad. Thank you for posint this. I now know how to write up my report.

Great. Glad you found it useful.

Good piece of work! Very useful
Great. Glad you found it useful!

The write up makes sense
Great. Thanks!

I love this article. Amazing, outstanding and incredible facts.
Glad you found it useful!

Well written and easy to follow
Thank you for the comment, I’m really glad you found it valuable.

I’m currently developing a dissertation proposal for my PhD in organizational leadership. I need guidance in writing my proposal
Hey – have you checked out this guide? https://www.thephdproofreaders.com/writing/how-to-write-a-phd-proposal/

Indeed I’m impressed and gained a lot from this and I hope I can write an acceptable thesis with this your guide. Bello, H.K
Great. Thanks for the kind words. Good luck with the thesis.

Thumbs up! God job, well done. The information is quite concise and straight to the point.
Glad you thought so – good luck with the writing.

Dear Max, thank you so much for your work and efforts!
Your explanation about Aims and Objectives really helped me out. However, I got stuck with other parts of the Aims and Objectives Work Sheet: Scope, Main Argument, and Contribution.
Could you please explain these as well, preferably including some examples?
Thanks for your kind words. Your question is a big one! Without knowing lots about your topics/subject I’m not able to provide tailored advice, but broadly speaking your scope is the aims/objectives, your main argument is the thread running through the thesis (i.e. what your thesis is trying to argue) and the contribution (again, broadly speaking) is that gap you are filling.

I love your website and you’ve been so SO helpful..
DUMB QUESTION ALERT: Is there supposed to be a difference between aims and research question?
I mean, using your own example.. if the aim of my research is: “To understand the contribution that local governments make to national level energy policy” then wouldn’t the research question be: “How do local governments contribute to energy policy at national level”?
I am sorry if this comes out as completely obvious but I am at that stage of confusion where I am starting to question everything I know.
Sorry it’s taken me so long to reply! It’s not a dumb question at all. The aim of the study is what the study as a whole is seeking to achieve. So that might be the gap it is filling/the contribution it is making. The research questions are your means to achieving that aim. Your aim might be to fill a gap in knowledge, and you then may have a small number of questions that help you along that path. Does that make sense?

Thank you Max for this post! So helpful!
Thanks Anna!

Thanks so much this piece. I have written both bachelor’s and master’s thesis but haven’t read this made me feel like I didn’t know anything about research at all. I gained more insight into aims and objectives of academic researches.

Interesting explanation. Thank you.
I’m glad you found it useful.

Hi… I really like the way it is put “What are you going?” (Aims) and “How are you doing it?” (Objectives). Simple and straightforward. Thanks for making aims and objectives easy to understand.

Thank you for the write up it is insightful. if you are ask to discuss your doctoral aims. that means: what you are doing how you are doing it.

I was totally lost and still in the woods to the point of thinking I am dull, but looking at how you are coaching it tells me that i am just a student who needs to understand the lesson. I now believe that with your guidance i will pass my PhD. I am writing on an otherwise obvious subject, Value addition to raw materials, why Africa has failed to add value to raw materials? Difficult question as answers seem to abound, but that is where i differ and i seem to be against the general tide. However with your guidance I believe i will make it. Thanks.
Thanks for your lovely, kind words. So kind.
Submit a Comment Cancel reply
Your email address will not be published. Required fields are marked *

Search The PhD Knowledge Base
Most popular articles from the phd knowlege base.
The PhD Knowledge Base Categories
- Your PhD and Covid
- Mastering your theory and literature review chapters
- How to structure and write every chapter of the PhD
- How to stay motivated and productive
- Techniques to improve your writing and fluency
- Advice on maintaining good mental health
- Resources designed for non-native English speakers
- PhD Writing Template
- Explore our back-catalogue of motivational advice

An official website of the United States government
The .gov means it’s official. Federal government websites often end in .gov or .mil. Before sharing sensitive information, make sure you’re on a federal government site.
The site is secure. The https:// ensures that you are connecting to the official website and that any information you provide is encrypted and transmitted securely.
- Publications
- Account settings
Preview improvements coming to the PMC website in October 2024. Learn More or Try it out now .
- Advanced Search
- Journal List
- v.53(4); 2010 Aug
Research questions, hypotheses and objectives
Patricia farrugia.
* Michael G. DeGroote School of Medicine, the
Bradley A. Petrisor
† Division of Orthopaedic Surgery and the
Forough Farrokhyar
‡ Departments of Surgery and
§ Clinical Epidemiology and Biostatistics, McMaster University, Hamilton, Ont
Mohit Bhandari
There is an increasing familiarity with the principles of evidence-based medicine in the surgical community. As surgeons become more aware of the hierarchy of evidence, grades of recommendations and the principles of critical appraisal, they develop an increasing familiarity with research design. Surgeons and clinicians are looking more and more to the literature and clinical trials to guide their practice; as such, it is becoming a responsibility of the clinical research community to attempt to answer questions that are not only well thought out but also clinically relevant. The development of the research question, including a supportive hypothesis and objectives, is a necessary key step in producing clinically relevant results to be used in evidence-based practice. A well-defined and specific research question is more likely to help guide us in making decisions about study design and population and subsequently what data will be collected and analyzed. 1
Objectives of this article
In this article, we discuss important considerations in the development of a research question and hypothesis and in defining objectives for research. By the end of this article, the reader will be able to appreciate the significance of constructing a good research question and developing hypotheses and research objectives for the successful design of a research study. The following article is divided into 3 sections: research question, research hypothesis and research objectives.
Research question
Interest in a particular topic usually begins the research process, but it is the familiarity with the subject that helps define an appropriate research question for a study. 1 Questions then arise out of a perceived knowledge deficit within a subject area or field of study. 2 Indeed, Haynes suggests that it is important to know “where the boundary between current knowledge and ignorance lies.” 1 The challenge in developing an appropriate research question is in determining which clinical uncertainties could or should be studied and also rationalizing the need for their investigation.
Increasing one’s knowledge about the subject of interest can be accomplished in many ways. Appropriate methods include systematically searching the literature, in-depth interviews and focus groups with patients (and proxies) and interviews with experts in the field. In addition, awareness of current trends and technological advances can assist with the development of research questions. 2 It is imperative to understand what has been studied about a topic to date in order to further the knowledge that has been previously gathered on a topic. Indeed, some granting institutions (e.g., Canadian Institute for Health Research) encourage applicants to conduct a systematic review of the available evidence if a recent review does not already exist and preferably a pilot or feasibility study before applying for a grant for a full trial.
In-depth knowledge about a subject may generate a number of questions. It then becomes necessary to ask whether these questions can be answered through one study or if more than one study needed. 1 Additional research questions can be developed, but several basic principles should be taken into consideration. 1 All questions, primary and secondary, should be developed at the beginning and planning stages of a study. Any additional questions should never compromise the primary question because it is the primary research question that forms the basis of the hypothesis and study objectives. It must be kept in mind that within the scope of one study, the presence of a number of research questions will affect and potentially increase the complexity of both the study design and subsequent statistical analyses, not to mention the actual feasibility of answering every question. 1 A sensible strategy is to establish a single primary research question around which to focus the study plan. 3 In a study, the primary research question should be clearly stated at the end of the introduction of the grant proposal, and it usually specifies the population to be studied, the intervention to be implemented and other circumstantial factors. 4
Hulley and colleagues 2 have suggested the use of the FINER criteria in the development of a good research question ( Box 1 ). The FINER criteria highlight useful points that may increase the chances of developing a successful research project. A good research question should specify the population of interest, be of interest to the scientific community and potentially to the public, have clinical relevance and further current knowledge in the field (and of course be compliant with the standards of ethical boards and national research standards).
FINER criteria for a good research question
| Feasible | ||
| Interesting | ||
| Novel | ||
| Ethical | ||
| Relevant |
Adapted with permission from Wolters Kluwer Health. 2
Whereas the FINER criteria outline the important aspects of the question in general, a useful format to use in the development of a specific research question is the PICO format — consider the population (P) of interest, the intervention (I) being studied, the comparison (C) group (or to what is the intervention being compared) and the outcome of interest (O). 3 , 5 , 6 Often timing (T) is added to PICO ( Box 2 ) — that is, “Over what time frame will the study take place?” 1 The PICOT approach helps generate a question that aids in constructing the framework of the study and subsequently in protocol development by alluding to the inclusion and exclusion criteria and identifying the groups of patients to be included. Knowing the specific population of interest, intervention (and comparator) and outcome of interest may also help the researcher identify an appropriate outcome measurement tool. 7 The more defined the population of interest, and thus the more stringent the inclusion and exclusion criteria, the greater the effect on the interpretation and subsequent applicability and generalizability of the research findings. 1 , 2 A restricted study population (and exclusion criteria) may limit bias and increase the internal validity of the study; however, this approach will limit external validity of the study and, thus, the generalizability of the findings to the practical clinical setting. Conversely, a broadly defined study population and inclusion criteria may be representative of practical clinical practice but may increase bias and reduce the internal validity of the study.
PICOT criteria 1
| Population (patients) | ||
| Intervention (for intervention studies only) | ||
| Comparison group | ||
| Outcome of interest | ||
| Time |
A poorly devised research question may affect the choice of study design, potentially lead to futile situations and, thus, hamper the chance of determining anything of clinical significance, which will then affect the potential for publication. Without devoting appropriate resources to developing the research question, the quality of the study and subsequent results may be compromised. During the initial stages of any research study, it is therefore imperative to formulate a research question that is both clinically relevant and answerable.
Research hypothesis
The primary research question should be driven by the hypothesis rather than the data. 1 , 2 That is, the research question and hypothesis should be developed before the start of the study. This sounds intuitive; however, if we take, for example, a database of information, it is potentially possible to perform multiple statistical comparisons of groups within the database to find a statistically significant association. This could then lead one to work backward from the data and develop the “question.” This is counterintuitive to the process because the question is asked specifically to then find the answer, thus collecting data along the way (i.e., in a prospective manner). Multiple statistical testing of associations from data previously collected could potentially lead to spuriously positive findings of association through chance alone. 2 Therefore, a good hypothesis must be based on a good research question at the start of a trial and, indeed, drive data collection for the study.
The research or clinical hypothesis is developed from the research question and then the main elements of the study — sampling strategy, intervention (if applicable), comparison and outcome variables — are summarized in a form that establishes the basis for testing, statistical and ultimately clinical significance. 3 For example, in a research study comparing computer-assisted acetabular component insertion versus freehand acetabular component placement in patients in need of total hip arthroplasty, the experimental group would be computer-assisted insertion and the control/conventional group would be free-hand placement. The investigative team would first state a research hypothesis. This could be expressed as a single outcome (e.g., computer-assisted acetabular component placement leads to improved functional outcome) or potentially as a complex/composite outcome; that is, more than one outcome (e.g., computer-assisted acetabular component placement leads to both improved radiographic cup placement and improved functional outcome).
However, when formally testing statistical significance, the hypothesis should be stated as a “null” hypothesis. 2 The purpose of hypothesis testing is to make an inference about the population of interest on the basis of a random sample taken from that population. The null hypothesis for the preceding research hypothesis then would be that there is no difference in mean functional outcome between the computer-assisted insertion and free-hand placement techniques. After forming the null hypothesis, the researchers would form an alternate hypothesis stating the nature of the difference, if it should appear. The alternate hypothesis would be that there is a difference in mean functional outcome between these techniques. At the end of the study, the null hypothesis is then tested statistically. If the findings of the study are not statistically significant (i.e., there is no difference in functional outcome between the groups in a statistical sense), we cannot reject the null hypothesis, whereas if the findings were significant, we can reject the null hypothesis and accept the alternate hypothesis (i.e., there is a difference in mean functional outcome between the study groups), errors in testing notwithstanding. In other words, hypothesis testing confirms or refutes the statement that the observed findings did not occur by chance alone but rather occurred because there was a true difference in outcomes between these surgical procedures. The concept of statistical hypothesis testing is complex, and the details are beyond the scope of this article.
Another important concept inherent in hypothesis testing is whether the hypotheses will be 1-sided or 2-sided. A 2-sided hypothesis states that there is a difference between the experimental group and the control group, but it does not specify in advance the expected direction of the difference. For example, we asked whether there is there an improvement in outcomes with computer-assisted surgery or whether the outcomes worse with computer-assisted surgery. We presented a 2-sided test in the above example because we did not specify the direction of the difference. A 1-sided hypothesis states a specific direction (e.g., there is an improvement in outcomes with computer-assisted surgery). A 2-sided hypothesis should be used unless there is a good justification for using a 1-sided hypothesis. As Bland and Atlman 8 stated, “One-sided hypothesis testing should never be used as a device to make a conventionally nonsignificant difference significant.”
The research hypothesis should be stated at the beginning of the study to guide the objectives for research. Whereas the investigators may state the hypothesis as being 1-sided (there is an improvement with treatment), the study and investigators must adhere to the concept of clinical equipoise. According to this principle, a clinical (or surgical) trial is ethical only if the expert community is uncertain about the relative therapeutic merits of the experimental and control groups being evaluated. 9 It means there must exist an honest and professional disagreement among expert clinicians about the preferred treatment. 9
Designing a research hypothesis is supported by a good research question and will influence the type of research design for the study. Acting on the principles of appropriate hypothesis development, the study can then confidently proceed to the development of the research objective.
Research objective
The primary objective should be coupled with the hypothesis of the study. Study objectives define the specific aims of the study and should be clearly stated in the introduction of the research protocol. 7 From our previous example and using the investigative hypothesis that there is a difference in functional outcomes between computer-assisted acetabular component placement and free-hand placement, the primary objective can be stated as follows: this study will compare the functional outcomes of computer-assisted acetabular component insertion versus free-hand placement in patients undergoing total hip arthroplasty. Note that the study objective is an active statement about how the study is going to answer the specific research question. Objectives can (and often do) state exactly which outcome measures are going to be used within their statements. They are important because they not only help guide the development of the protocol and design of study but also play a role in sample size calculations and determining the power of the study. 7 These concepts will be discussed in other articles in this series.
From the surgeon’s point of view, it is important for the study objectives to be focused on outcomes that are important to patients and clinically relevant. For example, the most methodologically sound randomized controlled trial comparing 2 techniques of distal radial fixation would have little or no clinical impact if the primary objective was to determine the effect of treatment A as compared to treatment B on intraoperative fluoroscopy time. However, if the objective was to determine the effect of treatment A as compared to treatment B on patient functional outcome at 1 year, this would have a much more significant impact on clinical decision-making. Second, more meaningful surgeon–patient discussions could ensue, incorporating patient values and preferences with the results from this study. 6 , 7 It is the precise objective and what the investigator is trying to measure that is of clinical relevance in the practical setting.
The following is an example from the literature about the relation between the research question, hypothesis and study objectives:
Study: Warden SJ, Metcalf BR, Kiss ZS, et al. Low-intensity pulsed ultrasound for chronic patellar tendinopathy: a randomized, double-blind, placebo-controlled trial. Rheumatology 2008;47:467–71.
Research question: How does low-intensity pulsed ultrasound (LIPUS) compare with a placebo device in managing the symptoms of skeletally mature patients with patellar tendinopathy?
Research hypothesis: Pain levels are reduced in patients who receive daily active-LIPUS (treatment) for 12 weeks compared with individuals who receive inactive-LIPUS (placebo).
Objective: To investigate the clinical efficacy of LIPUS in the management of patellar tendinopathy symptoms.
The development of the research question is the most important aspect of a research project. A research project can fail if the objectives and hypothesis are poorly focused and underdeveloped. Useful tips for surgical researchers are provided in Box 3 . Designing and developing an appropriate and relevant research question, hypothesis and objectives can be a difficult task. The critical appraisal of the research question used in a study is vital to the application of the findings to clinical practice. Focusing resources, time and dedication to these 3 very important tasks will help to guide a successful research project, influence interpretation of the results and affect future publication efforts.
Tips for developing research questions, hypotheses and objectives for research studies
- Perform a systematic literature review (if one has not been done) to increase knowledge and familiarity with the topic and to assist with research development.
- Learn about current trends and technological advances on the topic.
- Seek careful input from experts, mentors, colleagues and collaborators to refine your research question as this will aid in developing the research question and guide the research study.
- Use the FINER criteria in the development of the research question.
- Ensure that the research question follows PICOT format.
- Develop a research hypothesis from the research question.
- Develop clear and well-defined primary and secondary (if needed) objectives.
- Ensure that the research question and objectives are answerable, feasible and clinically relevant.
FINER = feasible, interesting, novel, ethical, relevant; PICOT = population (patients), intervention (for intervention studies only), comparison group, outcome of interest, time.
Competing interests: No funding was received in preparation of this paper. Dr. Bhandari was funded, in part, by a Canada Research Chair, McMaster University.

The Importance Of Research Objectives
Imagine you’re a student planning a vacation in a foreign country. You’re on a tight budget and need to draw…

Imagine you’re a student planning a vacation in a foreign country. You’re on a tight budget and need to draw up a pocket-friendly plan. Where do you begin? The first step is to do your research.
Before that, you make a mental list of your objectives—finding reasonably-priced hotels, traveling safely and finding ways of communicating with someone back home. These objectives help you focus sharply during your research and be aware of the finer details of your trip.
More often than not, research is a part of our daily lives. Whether it’s to pick a restaurant for your next birthday dinner or to prepare a presentation at work, good research is the foundation of effective learning. Read on to understand the meaning, importance and examples of research objectives.
Why Do We Need Research?
What are the objectives of research, what goes into a research plan.
Research is a careful and detailed study of a particular problem or concern, using scientific methods. An in-depth analysis of information creates space for generating new questions, concepts and understandings. The main objective of research is to explore the unknown and unlock new possibilities. It’s an essential component of success.
Over the years, businesses have started emphasizing the need for research. You’ve probably noticed organizations hiring research managers and analysts. The primary purpose of business research is to determine the goals and opportunities of an organization. It’s critical in making business decisions and appropriately allocating available resources.
Here are a few benefits of research that’ll explain why it is a vital aspect of our professional lives:
Expands Your Knowledge Base
One of the greatest benefits of research is to learn and gain a deeper understanding. The deeper you dig into a topic, the more well-versed you are. Furthermore, research has the power to help you build on any personal experience you have on the subject.
Keeps You Up To Date
Research encourages you to discover the most recent information available. Updated information prevents you from falling behind and helps you present accurate information. You’re better equipped to develop ideas or talk about a topic when you’re armed with the latest inputs.
Builds Your Credibility
Research provides you with a good foundation upon which you can develop your thoughts and ideas. People take you more seriously when your suggestions are backed by research. You can speak with greater confidence because you know that the information is accurate.
Sparks Connections
Take any leading nonprofit organization, you’ll see how they have a strong research arm supported by real-life stories. Research also becomes the base upon which real-life connections and impact can be made. It even helps you communicate better with others and conveys why you’re pursuing something.
Encourages Curiosity
As we’ve already established, research is mostly about using existing information to create new ideas and opinions. In the process, it sparks curiosity as you’re encouraged to explore and gain deeper insights into a subject. Curiosity leads to higher levels of positivity and lower levels of anxiety.
Well-defined objectives of research are an essential component of successful research engagement. If you want to drive all aspects of your research methodology such as data collection, design, analysis and recommendation, you need to lay down the objectives of research methodology. In other words, the objectives of research should address the underlying purpose of investigation and analysis. It should outline the steps you’d take to achieve desirable outcomes. Research objectives help you stay focused and adjust your expectations as you progress.
The objectives of research should be closely related to the problem statement, giving way to specific and achievable goals. Here are the four types of research objectives for you to explore:
General Objective
Also known as secondary objectives, general objectives provide a detailed view of the aim of a study. In other words, you get a general overview of what you want to achieve by the end of your study. For example, if you want to study an organization’s contribution to environmental sustainability, your general objective could be: a study of sustainable practices and the use of renewable energy by the organization.
Specific Objectives
Specific objectives define the primary aim of the study. Typically, general objectives provide the foundation for identifying specific objectives. In other words, when general objectives are broken down into smaller and logically connected objectives, they’re known as specific objectives. They help define the who, what, why, when and how aspects of your project. Once you identify the main objective of research, it’s easier to develop and pursue a plan of action.
Let’s take the example of ‘a study of an organization’s contribution to environmental sustainability’ again. The specific objectives will look like this:
To determine through history how the organization has changed its practices and adopted new solutions
To assess how the new practices, technology and strategies will contribute to the overall effectiveness
Once you’ve identified the objectives of research, it’s time to organize your thoughts and streamline your research goals. Here are a few effective tips to develop a powerful research plan and improve your business performance.
Set SMART Goals
Your research objectives should be SMART—Specific, Measurable, Achievable, Realistic and Time-constrained. When you focus on utilizing available resources and setting realistic timeframes and milestones, it’s easier to prioritize objectives. Continuously track your progress and check whether you need to revise your expectations or targets. This way, you’re in greater control over the process.
Create A Plan
Create a plan that’ll help you select appropriate methods to collect accurate information. A well-structured plan allows you to use logical and creative approaches towards problem-solving. The complexity of information and your skills are bound to influence your plan, which is why you need to make room for flexibility. The availability of resources will also play a big role in influencing your decisions.
Collect And Collate
After you’ve created a plan for the research process, make a list of the data you’re going to collect and the methods you’ll use. Not only will it help make sense of your insights but also keep track of your approach. The information you collect should be:
Logical, rigorous and objective
Can be reproduced by other people working on the same subject
Free of errors and highlighting necessary details
Current and updated
Includes everything required to support your argument/suggestions
Analyze And Keep Ready
Data analysis is the most crucial part of the process and there are many ways in which the information can be utilized. Four types of data analysis are often seen in a professional environment. While they may be divided into separate categories, they’re linked to each other.
Descriptive Analysis:
The most commonly used data analysis, descriptive analysis simply summarizes past data. For example, Key Performance Indicators (KPIs) use descriptive analysis. It establishes certain benchmarks after studying how someone has been performing in the past.
Diagnostic Analysis:
The next step is to identify why something happened. Diagnostic analysis uses the information gathered through descriptive analysis and helps find the underlying causes of an outcome. For example, if a marketing initiative was successful, you deep-dive into the strategies that worked.
Predictive Analysis:
It attempts to answer ‘what’s likely to happen’. Predictive analysis makes use of past data to predict future outcomes. However, the accuracy of predictions depends on the quality of the data provided. Risk assessment is an ideal example of using predictive analysis.
Prescriptive Analysis:
The most sought-after type of data analysis, prescriptive analysis combines the insights of all of the previous analyses. It’s a huge organizational commitment as it requires plenty of effort and resources. A great example of prescriptive analysis is Artificial Intelligence (AI), which consumes large amounts of data. You need to be prepared to commit to this type of analysis.
Review And Interpret
Once you’ve collected and collated your data, it’s time to review it and draw accurate conclusions. Here are a few ways to improve the review process:
Identify the fundamental issues, opportunities and problems and make note of recurring trends if any
Make a list of your insights and check which is the most or the least common. In short, keep track of the frequency of each insight
Conduct a SWOT analysis and identify the strengths, weaknesses, opportunities and threats
Write down your conclusions and recommendations of the research
When we think about research, we often associate it with academicians and students. but the truth is research is for everybody who is willing to learn and enhance their knowledge. If you want to master the art of strategically upgrading your knowledge, Harappa Education’s Learning Expertly course has all the answers. Not only will it help you look at things from a fresh perspective but also show you how to acquire new information with greater efficiency. The Growth Mindset framework will teach you how to believe in your abilities to grow and improve. The Learning Transfer framework will help you apply your learnings from one context to another. Begin the journey of tactful learning and self-improvement today!
Explore Harappa Diaries to learn more about topics related to the THINK Habit such as Learning From Experience , Critical Thinking & What is Brainstorming to think clearly and rationally.


Chapter 6 Objectives
Barry Mauer and John Venecek

This portion of the course covers key library resources: literature databases, academic journals, scholarly monographs, and primary source collections. We also discuss key library services for undergraduates as well as connecting with librarians who specialize in English studies, and search tips that will help make your research more efficient. We also cover an often-overlooked skill: citation management, which enables you to compile, organize, and manage your resources efficiently. Managing citations as you go will reduce the stress of the research process
Learning Objectives
Understanding how to efficiently locate relevant literature will free up time for your reading and writing. You will learn about library services to help you with your search. A key resource is your subject librarian, who is always available to help. In this chapter, you will learn about:
- Primo, the UCF Library’s online catalog.
- Database search strategies.
- Key library services such as research consultations, Inter-Library Loan, the Research Tips Thursdays video series, and the office of Scholarly Communication.
- Citation management.
- Creating search alerts.
Chapter 6 Objectives Copyright © 2021 by Barry Mauer and John Venecek is licensed under a Creative Commons Attribution-NonCommercial-ShareAlike 4.0 International License , except where otherwise noted.
Share This Book
- Introduction
- Conclusions
- Article Information
A, Participant flow for the discovery study. B, Participant flow for the replication study. In both studies, during a single visit at the testing site, enrolled participants received expert clinical diagnosis using standardized assessments (reference standard diagnosis) as well as eye-tracking–based measurement of social visual engagement (index test). Index test quality control indicator (QCIs) failures occurred when participants’ data failed to meet automated preset data QCIs (additional details are available in eTables 2 and 3 in Supplement 1 ).
Performance among 711 children in the discovery study and 361 children in the replication study. A, The diamond represents the optimal test positivity threshold for the discovery study (Youden index). B, The test positivity threshold determined in the discovery study was fixed and applied independently in the replication study. The diamond represents the achieved sensitivity and specificity in the replication study using the test positivity threshold from the discovery study. The solid blue circle represents the post hoc theoretical optimal threshold. C, Tabulation corresponds to the diamond in panel A. D, Tabulation corresponds to the diamond in panel B. AUC indicates area under the curve; ROC, receiver operating characteristic. Negative predictive value (NPV) and positive predictive value (PPV) estimates reported here are calculated based on study sample prevalence.
A, Discovery study correlation between eye-tracking–based indices of social disability versus children’s total scores on the Autism Diagnostic Observation Schedule, second edition (ADOS-2). B, Discovery study correlation between eye-tracking–based indices of verbal ability versus children’s verbal age equivalent scores as measured by the Mullen Scales of Early Learning (Mullen). C, Discovery study correlation between eye-tracking–based indices of nonverbal cognitive ability versus children’s nonverbal age equivalent scores as measured by the Mullen. D, E, F, Replication study correlations between eye-tracking–based indices and reference standard assessments. In all scatterplots, circles represent individual data and diamonds represent regression outliers (bivariate outliers identified using Cook distance and difference-in-fits regression diagnostic assessment). The adjusted R 2 values were adjusted for measurement error variance of the reference standard (yielding percentage of reference standard nonerror variance explained by the index test). Additional information is provided in the Secondary End Point Analyses subsection of the eMethods in Supplement 1 .
Measurement of social visual engagement quantifies how a child engages with social and nonsocial cues occurring continuously within naturalistic environmental contexts (left column, shown as still frames from testing videos). In relation to those contexts, normative reference measures provide objective quantification of nonautism age-expected visual engagement (middle columns, shown as density distributions in both pseudocolor format and as color to grayscale fades overlaid on corresponding still frames). The age-expected reference measures can be used to measure and visualize patient comparisons, revealing individual strengths, vulnerabilities, and opportunities for skill building (right columns, sample patient data shown as overlaid circular apertures that encompass the portion of video foveated by each patient [each aperture spans the central 5.2 degrees of a patient’s visual field]). Children with autism present as engaging with toys of interest (1, 3, 5, and 7), color and contrast cues (2, 6, 8, and 9), and objects and background elements not directly relevant to social context (4 and 10-14). Elapsed times at the bottom right of still frames highlight the rapidly changing nature of social interaction in which many hundreds of verbal and nonverbal communicative cues are presented, each eliciting age-expected patterns of engagement and offering corresponding opportunities for objective quantitative comparisons of patient behavior.
eFigure 1. Example Video Stimuli and Coded Regions of Interest
eFigure 2. Eye-Tracking Data Collection Device
eFigure 3. Analysis of Dynamic Visual Scanning and Derivation of Attentional Funnels
eFigure 4. Using Kernel Density Estimation to Derive Attentional Funnels and Quantify Dynamic Visual Scanning
eFigure 5. Eye-Tracking Calibration Accuracy
eFigure 6. Probability Density Functions of Individual Score Numeric Values Used to Make Index Test Categorical Determinations of Autism vs Nonautism, Plotted According to Reference Standard Expert Clinical Diagnosis in Discovery and Replication Studies
eTable 1. Correlation of Eye-Tracking–Based Indices With Reference Standard Assessments
eTable 2. Discovery Study Participants With Missing Eye-Tracking Data (Failed Quality Controls)
eTable 3. Replication Study Participants With Missing Eye-Tracking Data (Failed Quality Controls)
eMethods. Participants, Experimental Design, Experimental Procedures and Data Collection, Data Processing, and Data Analysis and Statistics
eResults. Clinical Outcomes of False Positives and Negatives and Missing Data
eReferences
Data Sharing Statement
- Eye-Tracking–Based Measurement of Social Visual Engagement in the Diagnosis of Autism JAMA Original Investigation September 5, 2023 This study evaluates the performance of eye-tracking measurement of social visual engagement relative to expert clinical diagnosis in young children referred to specialty autism clinics. Warren Jones, PhD; Cheryl Klaiman, PhD; Shana Richardson, PhD; Christa Aoki, PhD; Christopher Smith, PhD; Mendy Minjarez, PhD; Raphael Bernier, PhD; Ernest Pedapati, MD; Somer Bishop, PhD; Whitney Ence, PhD; Allison Wainer, PhD; Jennifer Moriuchi, PhD; Sew-Wah Tay, PhD; Ami Klin, PhD
See More About
Sign up for emails based on your interests, select your interests.
Customize your JAMA Network experience by selecting one or more topics from the list below.
- Academic Medicine
- Acid Base, Electrolytes, Fluids
- Allergy and Clinical Immunology
- American Indian or Alaska Natives
- Anesthesiology
- Anticoagulation
- Art and Images in Psychiatry
- Artificial Intelligence
- Assisted Reproduction
- Bleeding and Transfusion
- Caring for the Critically Ill Patient
- Challenges in Clinical Electrocardiography
- Climate and Health
- Climate Change
- Clinical Challenge
- Clinical Decision Support
- Clinical Implications of Basic Neuroscience
- Clinical Pharmacy and Pharmacology
- Complementary and Alternative Medicine
- Consensus Statements
- Coronavirus (COVID-19)
- Critical Care Medicine
- Cultural Competency
- Dental Medicine
- Dermatology
- Diabetes and Endocrinology
- Diagnostic Test Interpretation
- Drug Development
- Electronic Health Records
- Emergency Medicine
- End of Life, Hospice, Palliative Care
- Environmental Health
- Equity, Diversity, and Inclusion
- Facial Plastic Surgery
- Gastroenterology and Hepatology
- Genetics and Genomics
- Genomics and Precision Health
- Global Health
- Guide to Statistics and Methods
- Hair Disorders
- Health Care Delivery Models
- Health Care Economics, Insurance, Payment
- Health Care Quality
- Health Care Reform
- Health Care Safety
- Health Care Workforce
- Health Disparities
- Health Inequities
- Health Policy
- Health Systems Science
- History of Medicine
- Hypertension
- Images in Neurology
- Implementation Science
- Infectious Diseases
- Innovations in Health Care Delivery
- JAMA Infographic
- Law and Medicine
- Leading Change
- Less is More
- LGBTQIA Medicine
- Lifestyle Behaviors
- Medical Coding
- Medical Devices and Equipment
- Medical Education
- Medical Education and Training
- Medical Journals and Publishing
- Mobile Health and Telemedicine
- Narrative Medicine
- Neuroscience and Psychiatry
- Notable Notes
- Nutrition, Obesity, Exercise
- Obstetrics and Gynecology
- Occupational Health
- Ophthalmology
- Orthopedics
- Otolaryngology
- Pain Medicine
- Palliative Care
- Pathology and Laboratory Medicine
- Patient Care
- Patient Information
- Performance Improvement
- Performance Measures
- Perioperative Care and Consultation
- Pharmacoeconomics
- Pharmacoepidemiology
- Pharmacogenetics
- Pharmacy and Clinical Pharmacology
- Physical Medicine and Rehabilitation
- Physical Therapy
- Physician Leadership
- Population Health
- Primary Care
- Professional Well-being
- Professionalism
- Psychiatry and Behavioral Health
- Public Health
- Pulmonary Medicine
- Regulatory Agencies
- Reproductive Health
- Research, Methods, Statistics
- Resuscitation
- Rheumatology
- Risk Management
- Scientific Discovery and the Future of Medicine
- Shared Decision Making and Communication
- Sleep Medicine
- Sports Medicine
- Stem Cell Transplantation
- Substance Use and Addiction Medicine
- Surgical Innovation
- Surgical Pearls
- Teachable Moment
- Technology and Finance
- The Art of JAMA
- The Arts and Medicine
- The Rational Clinical Examination
- Tobacco and e-Cigarettes
- Translational Medicine
- Trauma and Injury
- Treatment Adherence
- Ultrasonography
- Users' Guide to the Medical Literature
- Vaccination
- Venous Thromboembolism
- Veterans Health
- Women's Health
- Workflow and Process
- Wound Care, Infection, Healing
Get the latest research based on your areas of interest.
Others also liked.
- Download PDF
- X Facebook More LinkedIn
Jones W , Klaiman C , Richardson S, et al. Development and Replication of Objective Measurements of Social Visual Engagement to Aid in Early Diagnosis and Assessment of Autism. JAMA Netw Open. 2023;6(9):e2330145. doi:10.1001/jamanetworkopen.2023.30145
Manage citations:
© 2024
- Permissions
Development and Replication of Objective Measurements of Social Visual Engagement to Aid in Early Diagnosis and Assessment of Autism
- 1 Marcus Autism Center, Children’s Healthcare of Atlanta, Atlanta, Georgia
- 2 Division of Autism and Related Disabilities, Department of Pediatrics, Emory University School of Medicine, Atlanta, Georgia
- 3 Center for Translational Social Neuroscience, Emory University, Atlanta, Georgia
- 4 Department of Psychiatry, Washington University in St Louis School of Medicine, St Louis, Missouri
- 5 Intellectual and Developmental Disabilities Research Center, Washington University in St Louis School of Medicine, St Louis, Missouri
- 6 Now with Department of Psychiatry, Emory University School of Medicine, Atlanta, Georgia
- 7 Now with Division of Behavioral and Mental Health, Children’s Healthcare of Atlanta, Atlanta, Georgia
- Original Investigation Eye-Tracking–Based Measurement of Social Visual Engagement in the Diagnosis of Autism Warren Jones, PhD; Cheryl Klaiman, PhD; Shana Richardson, PhD; Christa Aoki, PhD; Christopher Smith, PhD; Mendy Minjarez, PhD; Raphael Bernier, PhD; Ernest Pedapati, MD; Somer Bishop, PhD; Whitney Ence, PhD; Allison Wainer, PhD; Jennifer Moriuchi, PhD; Sew-Wah Tay, PhD; Ami Klin, PhD JAMA
Question Can objective measurements of social visual engagement be developed and replicated to aid in early diagnosis and assessment of autism before age 3 years?
Findings In 2 prospective double-blind studies of diagnostic performance in 1089 children aged 16 to 30 months, 719 in discovery and 370 in replication, eye-tracking–based measurements of social visual engagement relative to expert clinical diagnosis had area under the receiver operating characteristic curve of 0.90, sensitivity of 81.9%, and specificity of 89.9% in discovery; and area under the curve of 0.89, sensitivity of 80.6%, and specificity of 82.3% in replication.
Meaning These results offer the prospect of an objective biomarker to aid in autism diagnosis and assessment.
Importance Autism spectrum disorder is a common and early-emerging neurodevelopmental condition. While 80% of parents report having had concerns for their child’s development before age 2 years, many children are not diagnosed until ages 4 to 5 years or later.
Objective To develop an objective performance-based tool to aid in early diagnosis and assessment of autism in children younger than 3 years.
Design, Setting, and Participants In 2 prospective, consecutively enrolled, broad-spectrum, double-blind studies, we developed an objective eye-tracking–based index test for children aged 16 to 30 months, compared its performance with best-practice reference standard diagnosis of autism (discovery study), and then replicated findings in an independent sample (replication study). Discovery and replication studies were conducted in specialty centers for autism diagnosis and treatment. Reference standard diagnoses were made using best-practice standardized protocols by specialists blind to eye-tracking results. Eye-tracking tests were administered by staff blind to clinical results. Children were enrolled from April 27, 2013, until September 26, 2017. Data were analyzed from March 28, 2018, to January 3, 2019.
Main Outcomes and Measures Prespecified primary end points were the sensitivity and specificity of the eye-tracking–based index test compared with the reference standard. Prespecified secondary end points measured convergent validity between eye-tracking–based indices and reference standard assessments of social disability, verbal ability, and nonverbal ability.
Results Data were collected from 1089 children: 719 children (mean [SD] age, 22.4 [3.6] months) in the discovery study, and 370 children (mean [SD] age, 25.4 [6.0] months) in the replication study. In discovery, 224 (31.2%) were female and 495 (68.8%) male; in replication, 120 (32.4%) were female and 250 (67.6%) male. Based on reference standard expert clinical diagnosis, there were 386 participants (53.7%) with nonautism diagnoses and 333 (46.3%) with autism diagnoses in discovery, and 184 participants (49.7%) with nonautism diagnoses and 186 (50.3%) with autism diagnoses in replication. In the discovery study, the area under the receiver operating characteristic curve was 0.90 (95% CI, 0.88-0.92), sensitivity was 81.9% (95% CI, 77.3%-85.7%), and specificity was 89.9% (95% CI, 86.4%-92.5%). In the replication study, the area under the receiver operating characteristic curve was 0.89 (95% CI, 0.86-0.93), sensitivity was 80.6% (95% CI, 74.1%-85.7%), and specificity was 82.3% (95% CI, 76.1%-87.2%). Eye-tracking test results correlated with expert clinical assessments of children’s individual levels of ability, explaining 68.6% (95% CI, 58.3%-78.6%), 63.4% (95% CI, 47.9%-79.2%), and 49.0% (95% CI, 33.8%-65.4%) of variance in reference standard assessments of social disability, verbal ability, and nonverbal cognitive ability, respectively.
Conclusions and Relevance In two diagnostic studies of children younger than 3 years, objective eye-tracking–based measurements of social visual engagement quantified diagnostic status as well as individual levels of social disability, verbal ability, and nonverbal ability in autism. These findings suggest that objective measurements of social visual engagement can be used to aid in autism diagnosis and assessment.
Approximately 1 in 36 US children is affected by autism. 1 Thirty percent of parents of children with autism had concerns for their child’s development before age 12 months, 50% of parents had concerns by age 18 months, and 80% had concerns by age 2 years. 2 - 4 Despite these early concerns and the manifest behaviors that elicited these concerns, the median age of US diagnosis remains delayed until the age of 4 to 5 years. 5 , 6 The age of diagnosis is even later among those who lack resources or lack access to expert clinicians: diagnoses for US racial minority families, families with low income, and families residing in rural areas lag further. 1 , 6 - 9
The goal of diagnosis in autism is to facilitate timely and targeted support to help a child and family as needed. To that end, there may be an important role for new tools and objective biomarkers that can accurately and efficiently aid in diagnosing children as well as aid in quantifying individual strengths and vulnerabilities. 10 Such tools could enhance health care system capacity and help facilitate timely access to individually appropriate services. 10 , 11
In current best practice, autism is diagnosed behaviorally by symptomatic deficits in social interaction and communication and by the presence of restricted and repetitive behaviors. 12 Current gold (reference) standard 13 diagnostic instruments are standardized validated assessments that measure the presence of autistic social disability through both behavioral observation and parent interview. 14 , 15 Best-practice guidelines also call for standardized assessments of a child’s cognitive and language skills. 16
Unfortunately, there are often long wait lists to access expert clinicians using gold standard instruments (a situation now described as a crisis) 17 and community use of gold standard instruments is limited. 18 , 19 Consequently, many children experience delayed diagnosis, and most receive diagnostic labels without receiving comprehensive evaluations and standardized assessments. 18 , 19
In the present studies, we tested the performance of eye-tracking–based measurements of social visual engagement to accurately predict autism diagnoses and to objectively quantify individual levels of social disability, verbal ability, and nonverbal cognitive ability. In primary analyses, we measured the sensitivity and specificity of eye-tracking assays in comparison with clinician best-estimate diagnosis by expert clinicians. In secondary analyses, we quantified convergent validity between eye-tracking–based indices of social disability, verbal ability, and nonverbal cognitive ability in comparison with standardized assessments thereof as administered by expert clinicians. 20 , 21
The present studies build on prior research using eye tracking to quantify social visual engagement, defined as how children look at and learn from their surrounding social environment. The prior research found that social visual engagement is strongly influenced by individual genetic variation (with monozygotic twin-twin concordance of approximately 0.9), 22 is highly biologically conserved, 23 and is atypical in autism 24 , 25 from very early ages in development (ie, 2-6 months). 26 Here we test the hypothesis that measurements of social visual engagement collected via eye tracking can serve as a robust biomarker to enable early diagnosis and assessment of autism.
The goal of the current studies was to evaluate performance of eye-tracking–based assays to accurately assess categorical presence of autism and to measure dimensional levels of ability or disability. In design, terminology, and reporting, this research followed the Standards for Reporting of Diagnostic Accuracy ( STARD ) guidelines, 27 - 29 with eye-tracking assays referred to as the “index test,” and expert clinical diagnosis using standardized assessments referred to as the “reference standard.” Two observational studies were conducted: a discovery study that was used to develop the data collection tool and algorithms, and a replication study that was used to test performance in an independent sample. Children were consecutively enrolled from April 27, 2013, until September 26, 2017. Data were analyzed from March 28, 2018, to January 3, 2019. The research protocol was approved by the institutional review boards of Emory University and Washington University in St Louis. Written informed consent was obtained from all parents or legal guardians.
To eliminate or minimize design-related bias (as highlighted by Lijmer et al 30 ), data were collected prospectively; participants were enrolled consecutively; enrolled participants had a broad spectrum of case presentation (spanning the full spectrum of symptom severity and absence of symptoms); clinical assessments were blind to eye tracking, eye tracking was blind to clinical assessments; and the index test and reference standard diagnosis were performed with all participants. Only the results of best-practice standardized assessments and reference standard clinician best-estimate diagnosis 31 were used clinically or communicated to parents. In this way, best-practice standard of care was maintained for all participants, blind to eye-tracking results; neither a child’s parents nor expert clinical staff were informed of a child’s eye-tracking results.
A total of 1089 children participated: 719 participated in the discovery study, and 370 participated in the replication study ( Figure 1 ). Eligible participants were identified on the basis of chronological age and were recruited through placement of advertising materials in local media, specialty clinics, and pediatric practices. The studies were designed to develop and test a tool to aid in the diagnosis and assessment of autism, not to test the tool’s utility as a screening instrument. To that end, children for whom there were concerns about autism were recruited (ie, children typically evaluated in specialized clinics for the diagnosis of autism). To be eligible for participation, children could not have clinically meaningful hearing or visual impairments (eg, congenital deafness, blindness, or nystagmus); could not have previously diagnosed genetic conditions associated with autism-related symptoms (eg, not known to have fragile X or Rett syndromes); had to be generally healthy at the time of testing, with no acute illness; had to be either born at or after 37 weeks’ gestational age (discovery study) or born at or after 32 weeks’ gestational age (replication study); and had to be either between the ages of 16 and 30 months (discovery study) or between the ages of 16 and 45 months (replication study). In both studies, the age of participants was guided by future intended use (ie, to align in time with ages that would ideally enable diagnosed children to be referred to early intervention before age 36 months). In the replication study, to test performance among a broader range of children, increased prematurity at birth and older age at enrollment was allowed. For the purpose of sample characterization, patient demographic data (including race, ethnicity, and maternal educational level) were collected by parents’ selection of fixed categories. Race and ethnicity data were collected to enable evaluation of whether test performance varied based on these characteristics. Further details are available in the eMethods in Supplement 1 .
Reference standard diagnosis consisted of clinician best-estimate diagnosis 32 - 35 by experienced licensed clinicians using standardized diagnostic protocols and developmental assessments. 20 Reference standard diagnosis was assigned based on all available clinical information, including developmental assessments as well as medical and developmental history gathered in clinical interviews. At young ages, clinician best-estimate diagnosis (ie, experienced clinicians’ judgments using the totality of information available) is a more stable predictor of later diagnosis than strict reliance on cutoff scores. 20 , 36 For example, while scores on the Autism Diagnostic Observation Schedule, second edition (ADOS-2), may vary during the first 2 to 3 years of life, clinician best estimate is more stable. 32 , 36 The standardized diagnostic protocol was sequential so that a child’s developmental history and scores on screening tests dictated subsequent assessments. A complete description of this protocol is available in the Reference Standard Diagnostic Assessment Procedures subsection of the eMethods in Supplement 1 .
For index test measurements of social visual engagement, eye-tracking data were collected while participants watched video scenes of social interaction (examples are provided in eFigure 1 in Supplement 1 ). Fourteen video scenes were presented, each with a mean (SD) duration of approximately 54.0 (21.5) seconds (range, 21.7 seconds to 1 minute, 29.7 seconds; sum, 12 minutes, 35.5 seconds). Experimental procedures, data collection, and data processing were performed as described in prior studies 22 and in the Experimental Procedures and Data Collection subsection of the eMethods in Supplement 1 . Data collection for the discovery study was performed in an academic medical center laboratory setting. Data collection for the replication study was performed in both an academic medical center laboratory setting and a community clinic using a standalone investigational eye-tracking device (eFigure 2 in Supplement 1 ). Eye-tracking data were collected using near-infrared video-based measurements of eye movements using specialized cameras and hardware (additional details are provided in the Experimental Procedures and Data Collection subsection of the eMethods in Supplement 1 ).
All collected data underwent automated quality control analyses measuring calibration accuracy, integrity of eye movements, duration of data collected, and time spent fixating on video scenes. Data that met or exceeded predefined automated static quality control thresholds proceeded to analysis (Quality Control Indicators subsection of the eMethods in Supplement 1 ). All steps in data processing and analysis were automated, with no manual human review or analysis required.
Time-varying kernel density estimation was used to quantify social visual engagement 37 (eFigure 3 in Supplement 1 ). Probability density functions of visual fixation and scanning were calculated during each moment of collected eye-tracking data (eFigure 4 in Supplement 1 ). Moments in time when the majority of participants with nonautism diagnoses in the discovery study fixated on approximately the same location(s) at the same moments at levels greater than expected by chance were identified by permutation testing. 38 Discovery study data were then mined to identify time points when the majority of participants with autism fixated on alternate locations (defining a classification index). Data were also mined to identify time points when autism and nonautism discovery study data were correlated with measurements of (1) social disability (correlated with ADOS-2 total scores), (2) verbal ability (correlated with verbal age-equivalent scores from the Mullen Scales of Early Learning, hereinafter, Mullen), or (3) nonverbal cognitive ability (correlated with visual reception age-equivalent scores from the Mullen). Data mining for these associations thereby defined 3 indices of individual variability in levels of disability and ability. Further details are provided in the Data Processing subsection of the eMethods in Supplement 1 . Discovery study results were tested by leave-one-out cross validation, 39 with each participant tested as an independent comparison relative to the rest of the sample. All parameters were fixed and then tested again in the independent replication study.
Primary effectiveness analyses were planned as a comparison between the eye-tracking index test results and the reference standard diagnosis results (either autism or nonautism). Sensitivity and specificity were calculated according to standard practice: sensitivity was calculated as the proportion of participants with reference standard autism diagnoses who had eye-tracking results that also indicated autism; specificity was calculated as the proportion of participants with reference standard nonautism diagnoses who had eye-tracking results that also indicated nonautism. The test positivity threshold was derived in the discovery study using the Youden index 40 ; the threshold was then fixed for testing in the independent replication study. Receiver operating characteristic curves, area under the curve, positive predictive value (PPV), negative predictive value (NPV), and accuracy of the eye-tracking index test were also calculated, all with 95% CIs. 41 Primary end point analyses were tested at a 1-sided significance level of α = .025.
Secondary effectiveness analyses were planned as measurements of correlation between eye-tracking–based severity indices and their respective expert clinician–administered reference standard assessments, including the ADOS-2 total score for social disability, the mean of Mullen receptive and expressive language age-equivalent scores for verbal ability, and the Mullen visual reception age-equivalent score for nonverbal ability. For social disability, the correlation was expected to be negative because higher scores on the ADOS-2 denote greater social disability, whereas for the eye-tracking test, lower scores denote greater social disability. Deming regression 42 , 43 was used to quantify the relationships between eye-tracking–based indices and their respective reference standards. Standard regression diagnostics (including Cook distance and difference-in-fits), 44 , 45 Pearson correlation coefficients, and adjusted R 2 coefficients 46 - 48 together with 95% CIs were calculated. Secondary outcome analyses were tested at a 1-sided significance level of α = .025. Data analyses were performed in Matlab R2016a (Mathworks, Inc).
A total of 719 children (mean [SD] age, 22.4 [3.6] months; 224 [31.2%] female and 495 [68.8%] male) were enrolled in the discovery study. A total of 370 children (mean [SD] age, 25.4 [6.0] months; 120 [32.4%] female and 250 [67.6%] male) were enrolled in the replication study. Based on reference standard diagnosis, the discovery study comprised 386 participants (53.7%) with nonautism diagnoses and 333 (46.3%) with autism diagnoses, while the replication study comprised 184 participants (49.7%) with nonautism diagnoses and 186 (50.3%) with autism diagnoses.
Participant characteristics and demographic data are shown in the Table . In both studies, participants with autism had higher ADOS-2 domain and total scores (all t > 24.0, all P < .001). Participants with autism also had lower Mullen verbal age-equivalent scores (both t > 7.4, P < .001) and lower Mullen nonverbal age-equivalent scores (both t > 5.1, P < .001). The ADOS-2 scores in both studies indicated that participants with autism represented the full spectrum of autism symptom severity. Likewise, the Mullen scores in both studies indicated that participants with nonautism and autism diagnoses represented a broad range of verbal and nonverbal abilities, extending from substantially delayed to age-appropriate to advanced abilities. In each study, mean (SD) age of the sample with autism diagnoses was significantly older than the sample with nonautism diagnoses (discovery: 23.1 [3.7] months vs 21.7 [3.4] months; t = 5.2, P <.001; replication: 28.1 [5.8] months vs 22.7 [4.9] months; t = 9.7, P < .001). Sex differences were as expected, 49 with a higher number of boys diagnosed with autism in both studies (both χ 2 > 16.6; P < .001).
Average calibration accuracy was within 1 degree of visual angle and did not differ significantly between diagnostic groups or study samples (eFigure 5 in Supplement 1 ). There were no significant between-group differences in duration of data collected (discovery: t = 1.48; P = .14; replication : t = 0.81 , P = .42). Children with nonautism diagnoses did fixate (discovery: t = 4.97, P < .001; replication: t = 8.51, P < .001) and saccade (discovery: t = 6.75, P < .001; replication: t = 8.10, P < .001) significantly more, and blink less (discovery: t = 4.61, P < .001; replication: t = 4.08, P < .001), than children with autism, which was consistent with expected diagnostic differences in attention to and engagement with social cues in the environment 50 that have been commonly noted in autism. 36
Prespecified primary end point analyses measured the diagnostic accuracy of eye-tracking–based index test results in comparison with reference standard diagnosis. Results are shown in Figure 2 as receiver operating characteristic curves (panels A and B) and diagnostic cross-tabulations with performance measure estimates (panels C and D); underlying score distributions are plotted in eFigure 6 in Supplement 1 . Index test performance had area under the curve statistics equal to 0.90 (95% CI, 0.88-0.92) in the discovery study and 0.89 (95% CI, 0.86-0.93) in the replication study. The test positivity threshold in the discovery study was selected to match the Youden index (represented by the diamond in Figure 2 A). After discovery study determination, the test positivity threshold was fixed and applied in the replication study. Achieved sensitivity and specificity in the replication study are shown in Figure 2 B (represented by the diamond, which corresponds to the cross-tabulation results and performance measure estimates in Figure 2 D). Eye-tracking–based index test results predicted expert clinician reference standard diagnosis with sensitivity equal to 81.9% (95% CI, 77.3%-85.7%) and specificity equal to 89.9% (95% CI, 86.4%-92.5%) in the discovery study, and sensitivity equal to 80.6% (95% CI, 74.1%-85.7%) and specificity equal to 82.3% (95% CI, 76.1%-87.2%) in the replication study. Sensitivity, specificity, PPV, NPV, and accuracy did not differ significantly by sex (all with overlapping 95% CIs of performance estimates). Additional information regarding clinical outcomes is provided in the Clinical Outcomes of False Positives and Negatives subsection in eResults in Supplement 1 .
Prespecified secondary end point analyses measured the strength of association between eye-tracking–based indices and reference standard behavioral assessments of social disability, verbal ability, and nonverbal ability. Results are shown in Figure 3 as scatter plots with Deming regression fitted functions, Pearson R values, and adjusted R 2 coefficients of determination (also summarized in eTable 1 in Supplement 1 ).
In the discovery study ( Figure 3 A-C), the correlation between the index test social disability index and the ADOS-2 total score was −0.74 (95% CI, −0.78 to −0.70), the correlation between the index test verbal ability index and the Mullen verbal age-equivalent score was 0.71 (95% CI, 0.67-0.75), and the correlation between the nonverbal ability index and the Mullen nonverbal age-equivalent score was 0.66 (95% CI, 0.61-0.70). In the replication study ( Figure 3 D-F), the correlation between the index test social disability index and the ADOS-2 total score was −0.72 (95% CI, −0.78 to −0.65), the correlation between the index test verbal ability index and the Mullen verbal age-equivalent score was 0.59 (95% CI, 0.50-0.77), and the correlation between the index test nonverbal ability index and the Mullen nonverbal age-equivalent score was 0.53 (95% CI, 0.43-0.62).
From the replication study, adjusted for reference standard measurement error, the eye-tracking–based social disability index accounted for 68.6% (adjusted R 2 = 0.69; 95% CI, 0.58-0.79) of variance in ADOS-2 total scores. The verbal ability index accounted for 63.4% (adjusted R 2 = 0.63; 95% CI, 0.48-0.79) of variance in Mullen verbal age-equivalent scores. The nonverbal ability index accounted for 49.0% (adjusted R 2 = 0.49; 95% CI, 0.34-0.65) of variance in Mullen nonverbal age-equivalent scores.
In all comparisons, the strength of association between the eye-tracking–based indices and their respective expert clinician–administered assessments was high ( R > 0.5), suggesting strong convergent validity between index and reference standard measures for social disability, verbal ability, and nonverbal ability. There were no significant differences in strength of association by sex. Participants with eye-tracking quality control indicator failures (8 of 719 in the discovery study and 9 of 370 in the replication study), with no results returned, are described further in eTables 2 and 3 in Supplement 1 . Additional details and comparisons are available in the eResults in Supplement 1 .
In 2 prospective double-blind diagnostic studies, the first a discovery study and the second a replication study, 1089 children were tested to measure the diagnostic performance of index test measurements of social visual engagement relative to reference standard expert clinical diagnosis of autism. Children aged 16 to 30 months (discovery study) and 16 to 45 months (replication study) were assessed by expert clinicians to test whether measurements of social visual engagement could accurately predict categorical diagnosis as well as dimensional levels of social disability, verbal ability, and nonverbal ability.
The results, reported in accordance with the STARD initiative, 27 - 29 found that measurements of social visual engagement had 81.9% sensitivity and 89.9% specificity relative to expert clinical diagnosis of autism in the discovery study and 80.6% sensitivity and 82.3% specificity in the replication study. Sensitivity, specificity, PPV, NPV, and accuracy did not differ significantly between the discovery and replication studies, suggesting robust and replicable performance. In addition, measurements of social visual engagement were also predictive of children’s individual scores on gold standard behavioral assessments: measurements of social visual engagement effectively explained 68.6% of variance in individual levels of social disability (ADOS-2 total scores), 63.4% of variance in verbal ability (Mullen verbal age-equivalent scores), and 49.0% of variance in nonverbal cognitive ability (Mullen nonverbal age-equivalent scores).
These results suggest high convergent validity with reference standard assessments that otherwise require highly trained experts to spend multiple hours of assessment time per child. In contrast, for measurements of social visual engagement, biomarker data collection consisted of children watching videos (eFigure 1 in Supplement 1 ), with data collected on a standalone mobile eye-tracking device that was deployed in a clinic and operated by technicians with no required clinical or technical expertise (eFigure 2 in Supplement 1 ).
Once social visual engagement data are collected, although data processing and analysis are computationally intensive, they are also automated, deployed on cloud-based servers, and capable of returning a results report in less than 30 minutes. The index test is objective and quantitative and directly measures thousands of instances of children’s behavior for comparison with age-expected norms (examples are shown in eFigure 4 in Supplement 1 ). Data processing and analysis to derive diagnostic classification and indices of symptom severity are entirely automated, requiring no special expertise or eye-tracking knowledge on the part of clinicians.
It is important to note that the test results derived from measurements of social visual engagement are not intended to replace clinicians with expertise in developmental disabilities; to the contrary, a tool like this could be used by expert clinicians to aid in accurately and efficiently diagnosing autism as well as quantifying children’s strengths and vulnerabilities. Therefore, these results offer important opportunities to enhance health care system capacity and facilitate more rapid progress from the time of first concern to the start of individually appropriate services. 10 While empirically supported services have their own access challenges, those challenges are not a reason to delay diagnosis or to delay initiation of supports for children and families. 51
Finally, the meaning of these measurements resides in what they quantify: repeated divergence from shared social experience with rapid accrual of atypical experience ( Figure 4 ). Shared experience is the foundation for communication and social development. By quantifying the number, extent, and timing of divergence from shared experience, measurements of social visual engagement provide a transactional biomarker: direct objective measurements of a child’s unique biology transacting with specific environmental contexts. Those transactions are the building blocks of learning and brain development. 52
Recognizing the transactional nature of this developmental process is a reminder that the emergence of disability is itself transactional, driven by genetic liabilities but also by atypical learning experiences that are correlated with those liabilities. 53 Recognizing this provides 2 notable reasons for optimism. First, it reminds us that disability is a cocreation, a consequence of individual vulnerabilities transacting with particular environmental contexts, severely disabling in some contexts but less so or not at all in others. 54 Fostering early intervention approaches and contexts that embrace difference and diversity while also augmenting individual adaptive skills is important to reducing disability and optimizing outcomes for all. Second, knowing that the unfolding of disability is transactional means that it can be measured as such to (1) identify children in need of support; (2) monitor specific behaviors and contexts that may exacerbate or ameliorate disability over time; and (3), ideally, intervene more successfully and treat specific individual manifestations and vulnerabilities for disability.
This study has several limitations. Clinical procedures were performed by a relatively small group of expert clinicians, and eye-tracking procedures were implemented under well-controlled laboratory conditions in the discovery study or with a single prototype standalone eye-tracking device in the replication study. The efforts in this study should be complemented by studies collecting reference standard and index test data at multiple different sites with multiple different clinical teams and eye-tracking devices. 55 The results of this study should also be complemented by data quantifying repeatability and reproducibility variance in eye-tracking–based measurements. 56 Previous studies 57 , 58 have also noted expert clinical uncertainty in the reference standard diagnosis of autism in some children. Uncertainty in the reference standard sets an upper limit on the performance measures of any comparison test (eFigure 3 in Jones et al 55 ). In the current study, we did not prospectively track expert clinician certainty of diagnosis in all children. Consequently, we were unable to analyze the effects of clinician certainty in the discovery or replication studies. This limitation was improved in a subsequent multisite study. 55
In 2 diagnostic studies of children aged 16 to 30 months with and without autism, objective measurements of social visual engagement were able to quantify diagnostic status and assess individual levels of social disability, verbal ability, and nonverbal ability. These findings suggest that objective measurements of social visual engagement can be used to aid in autism diagnosis and assessment.
Accepted for Publication: July 11, 2023.
Published: September 5, 2023. doi:10.1001/jamanetworkopen.2023.30145
Open Access: This is an open access article distributed under the terms of the CC-BY License . © 2023 Jones W et al. JAMA Network Open .
Corresponding Author: Warren Jones, PhD, Marcus Autism Center, Children’s Healthcare of Atlanta, 1920 Briarcliff Rd NE, Atlanta, GA 30329 ( [email protected] ).
Author Contributions: Dr Jones had full access to all of the data in the study and takes responsibility for the integrity of the data and the accuracy of the data analysis.
Concept and design: Jones, Klaiman, Lewis, Shultz, Klin.
Acquisition, analysis, or interpretation of data: All authors.
Drafting of the manuscript: Jones, Klaiman, Edwards, Klin.
Critical review of the manuscript for important intellectual content: Hamner, Paredes.
Statistical analysis: Jones, Edwards.
Obtained funding: Jones, Lewis, Edwards, Klin.
Administrative, technical, or material support: Jones, Klaiman, Richardson, Lambha, Hamner, Beacham, Lewis, Paredes, Edwards, Marrus, Constantino, Shultz, Klin.
Supervision: Jones, Klaiman, Lewis, Edwards, Marrus, Shultz, Klin.
Conflict of Interest Disclosures: Dr Jones reported receiving grants from the Georgia Research Alliance, the Joseph B. Whitehead Foundation, the Marcus Foundation, and the National Institute of Mental Health (NIMH) during the conduct of the study (all via his institution); being a scientific cofounder of and owning equity in EarliTec Diagnostics; holding patents licensed to EarliTec Diagnostics; and receiving personal fees for consulting from EarliTec Diagnostics and a lecture honorarium from Washington University in St Louis School of Medicine outside the submitted work. Dr Klaiman reported receiving grants from the Eunice Kennedy Shriver National Institute of Child Health and Human Development (NICHD), the Georgia Research Alliance, the Joseph B. Whitehead Foundation, the Marcus Foundation, and the NIMH (all via her institution) during the conduct of the study and personal fees from ABA Centers of America, Dekalb County School District, Cherokee County School District, Fulton County School District, Beaming Health, and EarliTec Diagnostics outside the submitted work. Dr Richardson reported receiving funding and/or equipment from the Georgia Research Alliance, the John B. Whitehead Foundation, and the Marcus Foundation (all via her institution) during the conduct of the study. Dr Lambha reported receiving funding and/or equipment from the Georgia Research Alliance, the Joseph B. Whitehead Foundation, the Marcus Foundation, the NICHD, and the NIMH (all via her institution) during the conduct of the study. Dr Beacham reported receiving funding and/or equipment from the John B. Whitehead Foundation and the Marcus Foundation during the conduct of the study. Mr Lewis reported receiving grants from the Georgia Research Alliance, the Joseph B. Whitehead Foundation, and the Marcus Foundation (all via his institution) during the conduct of the study; being a scientific cofounder of and owning equity in EarliTec Diagnostics; and holding patents licensed to EarliTec Diagnostics outside the submitted work. Mr Paredes reported receiving funding and/or equipment from the Joseph B. Whitehead Foundation and the Marcus Foundation (both via his institution) during the conduct of the study. Dr Marrus reported receiving grants from the NIMH and from Washington University in St Louis School of Medicine during the conduct of the study. Dr Constantino reported receiving grants from the NICHD during the conduct of the study and royalties from Western Psychological Services outside the submitted work. Dr Klin reported receiving grants from the Georgia Research Alliance, the Joseph B. Whitehead Foundation, the Marcus Foundation, the NICHD, and the NIMH (all via his institution) during the conduct of the study; being a scientific cofounder of and owning equity in EarliTec Diagnostics; holding patents licensed to EarliTec Diagnostics; and receiving personal fees from the Alliance for Early Success, the Brazilian Society of Speech Therapy, EarliTec Diagnostics, the McKnight Endowment Fund for Neuroscience, the National Autism Conference, and Washington University in St Louis School of Medicine outside the submitted work. No other disclosures were reported.
Funding/Support: This study was supported by funding from the Marcus Foundation (Drs Jones and Klin), the Joseph B. Whitehead Foundation (Drs Jones and Klin), and the Georgia Research Alliance (Drs Jones and Klin and Mr Lewis); grants HD068479 and U54 HD087011 from the NICHD (Dr Constantino); and grants MH100029 (Drs Jones and Klin) and MH100019 (Dr Marrus) from the NIMH.
Role of the Funder/Sponsor: The funding organizations had no role in the design and conduct of the study; collection, management, analysis, and interpretation of the data; preparation, review, or approval of the manuscript; and decision to submit the manuscript for publication.
Data Sharing Statement: See Supplement 2 .
Additional Contributions: We thank the families and children for their participation. We also thank the fellows of the Donald J. Cohen Fellowship in Developmental Social Neuroscience, the Simons Fellowship in Computational Neuroscience, and the Simons Fellowship in Design Engineering for providing help with data collection and processing at Marcus Autism Center, Children’s Healthcare of Atlanta, Emory University. We thank Erika Mortenson, BA, Sayli Sant, MD, Teddi Gray, BA, Yi Zhang, MS, Laura Campbell, BA, and Leena Malik, BA, of Washington University in St Louis, for assisting with data collection and processing. We thank Steve Kovar, BFA, of Marcus Autism Center, Children’s Healthcare of Atlanta, for providing help with building the standalone eye-tracking device used in the replication study and Robin Sifre, PhD, of EarliTec Diagnostics, for providing comments on the manuscript. The named individuals were not compensated outside of their normal salary.
- Register for email alerts with links to free full-text articles
- Access PDFs of free articles
- Manage your interests
- Save searches and receive search alerts
This paper is in the following e-collection/theme issue:
Published on 25.6.2024 in Vol 26 (2024)
Wearable Technologies for Detecting Burnout and Well-Being in Health Care Professionals: Scoping Review
Authors of this article:
- Milica Barac 1 * , BS ;
- Samantha Scaletty 1 * , BS ;
- Leslie C Hassett 2 , MLS ;
- Ashley Stillwell 3 , DO ;
- Paul E Croarkin 4 , DO, MS ;
- Mohit Chauhan 5 , MD ;
- Sherry Chesak 6 , PhD ;
- William V Bobo 5 , MD, MPH ;
- Arjun P Athreya 1, 4 * , MS, PhD ;
- Liselotte N Dyrbye 7 * , MD, MPHE
1 Department of Molecular Pharmacology and Experimental Therapeutics, Mayo Clinic, Rochester, MN, United States
2 Mayo Clinic Libraries, Mayo Clinic, Rochester, MN, United States
3 Department of Family Medicine, Mayo Clinic, Phoenix, AZ, United States
4 Department of Psychiatry and Psychology, Mayo Clinic, Rochester, MN, United States
5 Department of Psychiatry and Psychology, Mayo Clinic, Jacksonville, FL, United States
6 Department of Nursing, Mayo Clinic, Rochester, MN, United States
7 Department of Medicine, University of Colorado School of Medicine, Aurora, CO, United States
*these authors contributed equally
Corresponding Author:
Liselotte N Dyrbye, MD, MPHE
Department of Medicine
University of Colorado School of Medicine
Mail Stop C290, Fitzsimons Bldg
13001 E 17th Pl. Rm #E1347
Aurora, CO, 80045
United States
Phone: 1 303 724 4982
Email: [email protected]
Background: The occupational burnout epidemic is a growing issue, and in the United States, up to 60% of medical students, residents, physicians, and registered nurses experience symptoms. Wearable technologies may provide an opportunity to predict the onset of burnout and other forms of distress using physiological markers.
Objective: This study aims to identify physiological biomarkers of burnout, and establish what gaps are currently present in the use of wearable technologies for burnout prediction among health care professionals (HCPs).
Methods: A comprehensive search of several databases was performed on June 7, 2022. No date limits were set for the search. The databases were Ovid: MEDLINE(R), Embase, Healthstar, APA PsycInfo, Cochrane Central Register of Controlled Trials, Cochrane Database of Systematic Reviews, Web of Science Core Collection via Clarivate Analytics, Scopus via Elsevier, EBSCOhost: Academic Search Premier, CINAHL with Full Text, and Business Source Premier. Studies observing anxiety, burnout, stress, and depression using a wearable device worn by an HCP were included, with HCP defined as medical students, residents, physicians, and nurses. Bias was assessed using the Newcastle Ottawa Quality Assessment Form for Cohort Studies.
Results: The initial search yielded 505 papers, from which 10 (1.95%) studies were included in this review. The majority (n=9) used wrist-worn biosensors and described observational cohort studies (n=8), with a low risk of bias. While no physiological measures were reliably associated with burnout or anxiety, step count and time in bed were associated with depressive symptoms, and heart rate and heart rate variability were associated with acute stress. Studies were limited with long-term observations (eg, ≥12 months) and large sample sizes, with limited integration of wearable data with system-level information (eg, acuity) to predict burnout. Reporting standards were also insufficient, particularly in device adherence and sampling frequency used for physiological measurements.
Conclusions: With wearables offering promise for digital health assessments of human functioning, it is possible to see wearables as a frontier for predicting burnout. Future digital health studies exploring the utility of wearable technologies for burnout prediction should address the limitations of data standardization and strategies to improve adherence and inclusivity in study participation.
Introduction
Burnout is an occupational syndrome characterized by emotional exhaustion, depersonalization, and feelings of reduced personal accomplishment caused by chronic, unmitigated high levels of job-related stress [ 1 ]. Burnout is common among health care professionals (HCPs, also referred to as health care workers), impacting an estimated 35% to 54% of nurses and physicians, and between 45% and 60% of medical students and resident physicians in the United States [ 2 ]. Several studies also reveal a high prevalence of depression and anxiety in HCPs that preceded the coronavirus pandemic [ 3 - 9 ]. Data further suggests that burnout and other forms of distress have increased among HCPs as a result of the COVID-19 pandemic [ 10 - 12 ].
This is concerning because the well-being of HCPs impacts the quality of patient care and patients’ access to care. Several meta-analyses and systematic reviews have reported associations between burnout and negative impacts on the quality of care provided to patients, including increasing the risk of medical errors [ 13 ], malpractice claims [ 14 ], nosocomial infections [ 15 ], and mortality [ 16 ]. Additionally, other studies have found that HCPs who report experiencing burnout are more likely to reduce their time taking care of patients and quit, all of which negatively impact patient’s access to care and add a burden to the global health care system [ 2 ]. The impacts of burnout go beyond the workplace, as HCPs with reported burnout are at increased risk of cardiovascular diseases [ 17 , 18 ], suicidal ideation [ 13 , 19 ], substance use disorders [ 20 ], uncontrolled stress [ 21 ], car accidents [ 22 ], and quality of life [ 23 ].
Contributors of burnout in HCPs are multifactorial and complex. While most factors contributing to burnout originate from system-level factors within the work environment, some risk factors originate from the personal domain or challenges in the personal-professional interface, such as work-home conflict ( Figure 1 ). Due to the complexity of the factors involved, no model exists for predicting when an individual HCP or group of HCPs are at risk for developing burnout or other forms of distress. In response to the negative outcomes of burnout for HCPs and patients, the National Academies of Science, Engineering, and Medicine recommends health care organizations monitor (through frequent surveys) and respond to burnout. This approach is retrospective, as the time required for health care organizations to administer surveys, HCPs to complete them, and the additional time needed to analyze and interpret results all delay any response to burnout. A better approach would be a proactive one, where organizations or individual HCPs could predict and respond to high levels of job stress before the manifestation of burnout and associated personal and professional consequences result.

Previous studies and reviews suggest heart rate (HR) [ 24 ], heart rate variability (HRV) [ 24 ], sleep [ 25 ], and skin temperature [ 26 ] vary in response to stress. Additionally, sleep or fatigue also relates to the risk of burnout [ 27 ], depression [ 28 ], and other related conditions [ 29 ]. These types of data can be collected passively from wearable devices. Over the past 5 years, the adoption of wearable devices worldwide has more than doubled [ 30 ]. Therefore, data collected passively from wearable devices could potentially provide an avenue for detecting individuals at risk for high job stress, burnout, depression, and other related conditions. If predictive, such real-time information obtained passively from wearable devices could dramatically shift the current reactive paradigm to a proactive one, potentially leading to meaningful intervention before patients and HCPs experience adverse health consequences of burnout.
Previous systematic reviews suggest wearable devices may have some utility in predicting depression severity and stress levels [ 31 ]. To our knowledge, there is no review that investigates this relationship among HCPs or explores the ability of wearable devices to detect burnout risk. Hence, a scoping review was conducted to identify and summarize studies exploring associations between burnout, anxiety, depression, and stress, with data obtained from wearable devices in cohorts of HCPs.
Data Sources and Search Strategy
A comprehensive search of several databases was performed on June 7, 2022. No date limits were set for the search. The databases (and their coverage periods) were Ovid: MEDLINE (1946 to Present and Epub Ahead of Print, In-Process and Other Non-Indexed Citations and Daily), Embase (1974+), Healthstar (1966+), APA PsycInfo (1987+), Cochrane Central Register of Controlled Trials (1991+), Cochrane Database of Systematic Reviews (2005+), Web of Science Core Collection via Clarivate Analytics (1975+), Scopus via Elsevier (1788+), EBSCOhost: Academic Search Premier, CINAHL with Full Text (1981+), and Business Source Premier.
The search strategy was designed and conducted by a medical librarian (LCH) with input from the study’s investigators (APA and LND). Controlled vocabulary supplemented with keywords was used. The actual strategies listing all search terms used and how they are combined are available in the Multimedia Appendix 1 .
Review Strategy
The initial search yielded 505 papers. Two reviewers (MB and SS) independently identified and screened the titles and abstracts of potentially eligible papers. The inclusion criteria of the initial round of screening were as follows: the study must include a validated measure of burnout, stress, anxiety, or depression and the study must include only data from a wearable device worn by an HCP. For this work, we defined HCP as being a medical student, resident, practicing physician, or registered nurse in a hospital or outpatient clinical setting. The full-text reviews of the papers that resulted from the initial screening, data extraction, and quality assessment were also performed independently and in pairs by 2 reviewers (MB and SS). Papers were not excluded due to their calculated quality score. During this process, 475 papers were omitted because they did not satisfy the inclusion criteria (n=472) or were duplicates (n=3). After the initial screening, the full text of 30 papers was assessed for eligibility. Any disagreement was resolved by consensus with other senior reviewers (APA and LND) and the final source list was created, with senior reviewers blinded to reviews of each other and primary reviewers (MB and SS). The study selection process is illustrated in Figure 2 . Tables 1 and 2 provide descriptions of the final 10 papers published from April 2017 to December 2021 included in this review.

| Author | Sample characteristics | Wearable-derived measurements | Validated anxiety, burnout, stress, or depression measures | Other measure included |
| Feng et al [ ] | 113 Nurses | HR , Sleep, and STC | STAI | Positive and Negative Affect Schedule, Satisfaction with Life Scale, Pittsburgh Sleep Quality Index, Affect EMA , Big Five Inventory-2, and Anxiety and Stress EMA |
| Adler et al [ ] | 775 Residents | HR, Sleep, and STC | PHQ-9 | Mood EMA |
| Jevsevar et al [ ] | 21 Resident and Physicians | HRV , RHR , RR , and Sleep | MBI-Abbreviated | — |
| Silva et al [ ] | 83 Medical students (19 had complete data) | HR and HRV | PSS-4 | — |
| Mendelsohn et al [ ] | 59 Residents | Sleep and STC | MBI-HSS | Short-Form Health Survey, Epworth Sleepiness Scale, Satisfaction with Medicine Scale, and International Physical Activity Questionnaire |
| Marek et al [ ] | 28 Residents | RHR, Sleep, and STC | Single-item burnout measure | — |
| Sochacki et al [ ] | 21 Physicians | Sleep | MBI-HSS, PROMIS-29 (Depression and Anxiety) | — |
| Chaukos et al [ ] | 75 Residents (26 had complete data) | Activity level and Sleep | MBI–HSS, PSS-10, and PHQ-9 | Functional Assessment of Chronic Illness Therapy-Fatigue, Penn State Worry Questionnaire, Revised Life Orientation Test, Interpersonal Reactivity Index Perspective-Taking subscale, Measure of Current Status-Part A, and Cognitive Affective Mindfulness Scale |
| de Looff et al [ ] | 114 Nurses | SC | MBI–HSS (modified Dutch version) | — |
| Weenk et al [ ] | 20 Residents and Physicians | HR and HRV | STAI-short version | — |
a HR: heart rate.
b STC: step count.
c STAI: State-Trait Anxiety Inventory.
d EDA: electrodermal activity.
e EMA: ecological momentary assessment.
f PHQ-9: Patient Health Questionnaire.
g HRV: heart rate variability.
h RHR: resting heart rate.
i RR: respiratory rate.
j Not available.
k PSS: Perceived Stress Scale.
l MBI-HSS: Maslach Burnout Inventory–Human Services Survey.
m PROMIS : Performance of the Patient-Reported Outcomes.
n SC: skin conductance.
| Author | Device | Length of data collection | Primary findings | Newcastle Ottawa Scale Score |
| Feng et al [ ] | Fitbit Charge 2 | 10 weeks | Baseline STAI score did not relate to sensor-measured physical activity or sleep over the ensuing 10 weeks. | 8 |
| Adler et al [ ] | Fitbit Charge 2 | 14 months | Quarterly measurements of change in depressive symptoms related to measured STC , sleep, and HR . | 7 |
| Jevsevar et al [ ] | WHOOP | 12 weeks | Being in the operating room related to the next day HRV . Device reported sleep related to next-day HRV. Relationship between baseline burnout score and device measurements not reported. | 8 |
| Silva et al [ ] | Microsoft Smart Band 2 | 2 weeks | Stress and HRV were both significantly different between the baseline and stress condition | 8 |
| Mendelsohn et al [ ] | Fitbit Charge | 14 days | Baseline burnout score did not relate to average daily sleep or STC over the ensuing 14 days. | 7 |
| Marek et al [ ] | Fitbit Charge HR | 16 weeks | Average daily sleep and activity level over a 2-4–week period did not relate to single-item burnout measure score. Average daily resting HR over a 2-4–week period was higher among residents with burnout versus those without burnout | 8 |
| Sochacki et al [ ] | WHOOP | 4 weeks | No significant association between weekly burnout score and device-measured hours of sleep over 4 weeks. | 8 |
| Chaukos et al [ ] | Basis Health Tracker | 6 months | No association between baseline depressive symptoms or stress levels and device-measured sleep or activity levels over 30 or 90 days of the study. No association between chronic burnout (burnout at 2 time points), never burned out, new burnout (burnout at 2nd but not 1st time point), and unknown burnout status (survey not completed) and devise measured sleep or activity level aggregated over first 30 days. | 6 |
| de Looff et al [ ] | Empatica E4 | 1 day or night shift | Skin conductance collected over 1 shift among nursing staff did not correlate with burnout scores collected on questionnaires completed within 2 days of wearing the device (mean 2.4, SD 10 days; range 0-44 days). | 8 |
| Weenk et al [ ] | HealthPatch | Up to 3 days (at least 2) | Stress measured by the patch increased during surgery, more so for less experienced trainees, but did not correlate with change in STAI score before or after surgery, perhaps due to small sample size or lack of sensitivity to change. | 8 |
a STAI: State-Trait Anxiety Inventory.
c HR: heart rate.
d HRV: heart rate variability.
Extraction Strategy
Data extraction was mostly completed by a single researcher (MB). Other researchers (APA and SS) helped refine data extraction and review the tables. The following information was extracted from the papers and is included in Tables 1 and 2 : sample population (size and occupation), anxiety, burnout, stress or depression assessment instrument, additional measurements used, wearable device used, measured physiological variable, study duration, primary findings, and the author-determined quality assessment score.
Quality Assessment
The methodological quality of nonrandomized or observational studies was assessed by 2 reviewers (MB and SS) using the Newcastle Ottawa Quality Assessment Form for Cohort Studies [ 42 ]. The Newcastle-Ottawa Scale is a validated scale of 8 items in 3 domains: selection, comparability, and outcome. Studies are rated from 0 to 9, with those studies rating 0-2 (poor quality), 3-5 (fair quality), and 6-9 (good or high quality). All 10 studies received a Newcastle-Ottawa Scale rating of good or high quality.
Roles of Participating Health Care Professionals
Among the 10 reviewed studies, 8 were conducted in the United States, 1 study was conducted in Portugal [ 35 ], and another one was conducted in Canada [ 36 ]. Seven studies recruited either resident physicians (postgraduate medical trainees), practicing physicians, or a combination of both, primarily within the same specialty (eg, orthopedic surgery and emergency medicine). Two studies recruited registered nurses [ 32 , 40 ] and 1 study recruited medical students [ 35 ]. Sample sizes ranged from 20 to 775 participants per study (see Table 1 ). Only 3 studies had more than 100 participants [ 32 , 33 , 40 ].
Wearable Devices, Physiological Variables Collected, and Duration of Observation
Table 1 summarizes the sample population, sample size, physiological variables collected from wearable devices, and psychometrics used in the 10 studies. The devices used, length of data collection, and primary findings are listed in Table 2 . Out of the 10 studies, 9 used wrist-worn biosensors, such as the Fitbit Charge (n=4) [ 32 , 33 , 35 , 40 ] WHOOP (n=2) [ 34 , 38 ], Basis B1 (n=1) [ 35 ], Empatica E4 (n=1) [ 40 ], and the Microsoft Smart Band 2 (n=1) [ 35 ]. Sensors embedded within wrist-worn biosensors included optical heart sensors, electrical heart sensors, accelerometers, and skin temperature sensors. The other device used was a HealthPatch, an adhesive patch with 2 ECG electrodes used to measure HR and HRV. A variety of physiological variables were collected, with sleep being the most common, measured in 7 studies. Studies ranged in length of data collection, from a single 12-hour shift to a 14-month period. Only 5 studies collected data for more than 10 weeks [ 32 - 34 , 37 , 39 ].
Methodological Wearable Data Reporting
Only 2 studies explicitly stated the sampling frequency used when processing data from the wearable device [ 33 , 39 ]. Four of the studies discussed how the data were processed; however, the level of detail varied [ 32 , 33 , 35 , 40 ]. Three of the studies indicated the cutoff values for physiological variables or explained how outliers were addressed [ 32 , 33 , 40 ]. Only 4 studies explicitly stated how much raw data were retrieved from the devices [ 32 - 34 , 36 ].
Reported Relationships Among Burnout, Depressive Symptoms, Stress, and Anxiety With Data Obtained From Wearable Devices
Of the 10 included studies, 6 included a measure of burnout ( Table 1 ) [ 34 , 36 - 40 ]. Four of these 6 studies used the Maslach Burnout Inventory–Human Services Survey (MBI-HSS) [ 43 ]. In a cross-sectional study of 114 nurses, no relationship was found between MBI-HSS score and skin conductance, a measure of autonomic nervous activity, collected through an Empatica E4, for 1 shift [ 40 ]. Another study investigated the relationship between MBI-HSS score, self-reported work hours, physical activity, and sleep, as measured by a Fitbit, in a cohort of 59 residents [ 36 ]. No relationship was found between the change in burnout score and data collected from the Fitbit over 2 weeks. In the third study, no relationship was found between MBI-HSS score and sleep, as measured by a WHOOP, over the course of 4 weeks [ 38 ]. Last, in a study of 75 medicine and psychiatry residents, no relationship was found between burnout score and sleep or activity levels, as measured by Basis B1 health-tracking device, during their first 6 months of residency [ 39 ].
Two studies measured burnout using scales other than the 22-item MBI-HSS (widely considered the gold standard) [ 34 , 37 ]. In a study of 21 orthopedic residents and surgeons, no association was found between baseline abbreviated MBI scores and WHOOP measures collected over 12 weeks [ 34 ]. The final study investigated the association between burnout, as measured by a commonly used single-item measure, and sleep and activity level, as measured by a Fitbit. In this study, of 28 emergency medicine residents, there was no association between burnout scores and sleep or activity levels over the course of the 16-week study [ 37 ].
Depressive Symptoms, Stress, and Anxiety
A 14-month study of 775 medical residents found a relationship between depressive symptoms, as measured by the 9-item Patient Health Questionnaire [ 44 ], and step count (STC) and sleep as measured by a Fitbit Charge 2 [ 33 ]. Medical residents whose depressive symptoms worsened over the period of the study had a significantly higher skew in their hourly STC distributions and spent less time in bed than those whose symptoms did not worsen. In a study of 83 medical students, Perceived Stress Scale-4 scores related to HR and HRV, were measured by a Microsoft Smartband 2, at baseline and during an examination [ 35 ].
In a 10-week study of 113 nurses led by Feng et al [ 32 ], no relationship was found between the level of anxiety, as measured by the State-Trait Anxiety Inventory (STAI) [ 45 ], and wearable sensor data (eg, sleep and HR) collected using Fitbit Charge 2 smartwatch. Weenk et al [ 41 ] conducted a study of 20 surgeons and surgical residents who completed an abbreviated version of the STAI before and after performing surgery, and wore a HealthPatch. This adhesive patch calculates stress using an HR and HRV-dependent algorithm for 48 to 72 hours [ 41 ]. There was no correlation found between the STAI score and HealthPatch data.
Device Use Compliance and Experience
Seven studies reported data on participant adherence or experience with wearable devices. Chaukos et al [ 39 ] reported that 25 (40%) of their participants wore their device for more than 50% of the time for the first 3 months of the study, while another 13 (21%) participants wore the device for more than 75% of the time for the first 3 months. Other studies, such as one conducted by Sochacki et al [ 38 ] reported that of the 26 participants, 5 did not complete the minimum WHOOP compliance (4 weeks). Surgeons involved in a study by Jevsevar et al [ 34 ] reported a high percentage of device compliance at 83.2% of the total collection window, similar to the 93% compliance rate reported by Mendelsohn et al [ 36 ] and Sochacki et al [ 38 ]. Weenk et al [ 41 ] reported that 6 of 20 individuals experienced problems with their HealthPatch, similar to Marek et al [ 37 ] who reported 1 of 30 participants dropped out due to fitness tracker intolerance. Problems included connection failure (n=2), loss of skin contact (n=2), and skin irritation (n=2). Feng et al [ 32 ] noted similar compliance between day-shift participants and night-shift participants (number of recordings day-shift: mean 44.6, SD 3.1 sessions; night-shift: mean 45, SD 20.2 sessions).
Risk of Bias
A risk of bias of assessment was completed for the 8 cohort studies and 1 cross-sectional study ( Figure 3 ). While the risk of bias was generally low across the studies, none included a comparison group of participants who did not wear a device.

To our knowledge, this is the first scoping review to investigate the use of wearable technologies for the prediction of burnout, anxiety, depression, and stress in HCPs. Among the 10 studies identified, a range of wearables collected data on HR, HRV, respiratory rate, skin temperature, sleep, and activity levels from a single shift of work and up to 14 months of data collection in relatively small samples of physicians, medical students, and nurses. In these studies, no relationships were found between collected physiological data from wearables and burnout or anxiety. One study reported a relationship between STC, time in bed, and depressive symptoms, and another between HR, HRV, and acute stress (during an examination). Identified studies had methodological limitations, including short duration which limits the capture of naturalistic variations in the workplace stressors.
In this review, 3 studies measured HRV [ 34 , 35 , 41 ] and only 1 found a significant relationship between HRV and acute stress. A previous systematic review involving non-HCPs identified 2 studies demonstrating relationships between HRV and acute stress-induced conditions and 1 study demonstrating a relationship between HRV and stress levels measured by catecholamine levels [ 31 ]. This previous systematic review also identified 1 study where in a setting of laboratory-induced stress, HRV parameters related to STAI score. These studies, however, differed substantially from the ones included in this review. For example, none of them collected physiological data longer than 24 minutes, stress was induced in a laboratory setting (vs occurring naturally in a work setting), and only 1 study compared physiological data with a self-reported stress measure (ie, STAI score).
Given these early findings, further research focusing on the following elements of rigor are warranted. First, the length of observation should be long enough (at least 2 or 3 consecutive quarters of a calendar year) to allow sufficient quanta of wearable data to capture fluctuations in and chronicity of workplace stress. Studies should systematically collect data using validated instruments measuring burnout (eg, MBI-HSS [ 43 ]), depression (eg, Center for Epidemiologic Studies Depression Scale [ 46 ] and Patient Health Questionnaire-9 [ 44 ]), and anxiety (eg, General Anxiety Disorder-7 [ 47 ]). Investigators may also want to consider designing cohorts comprising groups of HCPs defined by their type of medical specialty or practice location. For example, it is possible that workplace stressors, patient acuity, and job demand fluctuate between primary care and surgical specialties and between outpatient practices and hospital-based practices. Hence, the burnout biomarkers may vary between practices. Considering that burnout is defined as when job demands exceed job resources, it is possible that the workplace (eg, patient acuity and hospital bed size) and related staffing factors (eg, workload, shift length, and availability of support staff) impact physiological biomarkers collected from wearables. Hence, future studies should consider collecting organizational variables to better understand the systemic contributors of burnout. Additionally, given the era of decentralized health care practice (eg, nontraditional shift days/hours and remote care with augmented reality), studies engaging with HCPs may benefit from no-contact passive monitoring and a digital app interface for survey collection (ie, decentralized trail). Finally, there is a bioethics component to understand how wearables can be successfully integrated into workforces’ burnout management. Greater attention needs to be paid to participant engagement, including addressing comfort with wearing the device, resolving discrepancies in wearable-derived data versus self-reported data, and understanding factors that influence perceptions of fatigue but not recorded sleep [ 37 , 48 , 49 ].
The use of wearables to detect the functioning states of human beings is an active and rapidly evolving field. Several wearable-based studies have been shown to aid in the detection of mental health conditions or resilience in quality of life [ 50 ] through mindfulness practices including physical activity [ 51 ] and sleep [ 52 - 54 ] monitoring. Prior work has demonstrated that aspects of physical functioning when combined with data during the day could predict variations in aspects of QoL and mental well-being [ 55 - 58 ]. Work by Campbell et al [ 59 - 64 ] has demonstrated the ability of daily journaling, wearables, and mobile assessments to detect depressive symptoms and mental states in patients with schizophrenia. These prior efforts in the field of mental health and the work summarized in this scoping review demonstrate the promise of wearables in predicting states of one’s functioning, including burnout. However, a consensus is lacking on the best approaches to collecting, processing, and reporting physiological data, much like CONSORT (Consolidated Standards of Reporting Trials) [ 65 ] for reporting randomized trials and STROBE (Strengthening the Reporting of Observational Studies in Epidemiology) [ 66 ] guidelines for reporting observational studies. Standardization of variables should include the creation of a guideline for reporting the sampling frequency, device adherence, and other information regarding device parameters that impact data collection. Such standardization would assist with generalizing findings, validating predictive algorithms, informing meta-analysis, and the use of data for retraining predictive models regardless of the wearable’s make and model. Additionally, there needs to be consensus around approaches to address bioethics, privacy, and confidentiality concerns of participants [ 67 , 68 ]. Predictive technologies, informed by personal biometric or physiologic data, may help improve work conditions but could also place individuals’ privacy or perhaps even their job security at risk.
This study has limitations. Only studies that included physicians, resident physicians, medical students, and nurses and were published in English were included. Following the 2019 pandemic, physicians identifying as 2 or more races experienced the highest levels of burnout onset, according to a report by the American Medical Association [ 69 ]. Furthermore, there are known disparities in the access to, and the use of digital health technologies in underrepresented minorities [ 70 , 71 ]. Therefore, it is vital to understand the factors that cause burnout in these groups of professionals and remove barriers to access to personalized wellness technologies using wearables that may help understand and mitigate burnout. In the context of the use and access of digital health for burnout, 8 of the 10 studies reported the gender breakdown of participants, and only 1 study reported the race of their participants. With the urgent need to broaden access to digital health solutions to study and understand burnout, future efforts should (1) follow reporting guidelines (eg, set by National Institutes of Health in the Human Subjects sections) to report on participant characteristics by ethnicity, race, and gender, and (2) innovate study procedures (eg, decentralized protocols) that improve the recruitment and engagement of underrepresented minorities in digital health studies of burnout. Although we sought to include validated measures of burnout, stress, depression, and anxiety, the instruments used in the studies varied in their psychometric strengths. Finally, most studies lacked power calculations, making findings, effect sizes, or impact of dropouts difficult to interpret from the perspective of the generalizability of biomarkers.
Despite the popularity of wearable devices, only 10 studies were identified that explored relationships between physiological data and burnout, depressive symptoms, stress, or anxiety. Most of these studies had substantial methodological limitations, and nearly all reported limited data collection and processing information, participant experience with the wearable device, and device compliance. Standardizing study procedures, common data elements, and reporting of wearable data are needed to strengthen the rigor of digital health studies. Addressing these limitations will result in improvements in wearable device research, including data standardization and reporting, that will validate their use in providing early intervention for HCP wellness. Additional research is warranted to explore the potential of wearable devices, perhaps augmented with other system-level data (eg, work shift lengths and absenteeism), to predict burnout and other forms of distress, hopefully leading to meaningful action before it has an adverse impact on HCPs and patient care.
Acknowledgments
This study was partially supported by the Mayo Clinic Summer Undergraduate Research Fellowship, National Science Foundation (grant 2041339); National Institutes of Health (grant R01 NR020362); the Mayo Clinic Center for Individualized Medicine, and the Mayo Clinic Center for Clinical and Translational Science. Any opinions, findings, conclusions, or recommendations expressed in this material are those of the authors and do not necessarily reflect the views of the National Science Foundation or National Institutes of Health.
Authors' Contributions
APA and LND contributed equally as co-Corresponding Authors. APA may be contacted at [email protected].
Conflicts of Interest
PC has received research support from the National Institutes of Health (NIH), National Science Foundation (NSF), Brain and Behavior Research Foundation, and the Mayo Clinic Foundation. PC has received research support from Pfizer, Inc. He has received equipment support from Neuronetics, Inc, and MagVenture, Inc. He received grant-in-kind supplies and genotyping from Assurex Health, Inc for an investigator-initiated study. He served as the primary investigator for a multicenter study funded by Neuronetics, Inc and a site primary investigator for a study funded by NeoSync, Inc. PC served as a paid consultant for Engrail Therapeutics, Sunovion, Procter and Gamble Company, Meta Platforms, Inc, and Myriad Neuroscience. PC is employed by the Mayo Clinic. LD is a coinventor of the Well-Being Index and its derivatives which Mayo Clinic has licensed. LD receives royalties. WB’s research has been supported by the NIMH, NINR, NSF, the Blue Gator Foundation, the Watzinger Foundation, and the Mayo Foundation for Medical Education and Research. He has contributed chapters to UpToDate concerning the pharmacological management of patients with bipolar spectrum disorders. MCs research has been supported by NSF and the Mayo Foundation for Medical Education and Research.
Search strategy.
PRISMA-ScR checklist.
- ICD-11 for mortality and morbidity statistics. World Health Organization. 2023. URL: http://id.who.int/icd/entity/129180281 [accessed 2024-04-10]
- Taking Action Against Clinician Burnout: A Systems Approach to Professional Well-Being. Washington, DC. National Academies Press; 2019.
- Golonka K, Mojsa-Kaja J, Blukacz M, Gawłowska M, Marek T. Occupational burnout and its overlapping effect with depression and anxiety. Int J Occup Med Environ Health. 2019;32(2):229-244. [ FREE Full text ] [ CrossRef ] [ Medline ]
- Mata DA, Ramos MA, Bansal N, Khan R, Guille C, Di Angelantonio E, et al. Prevalence of depression and depressive symptoms among resident physicians: a systematic review and meta-analysis. JAMA. 2015;314(22):2373-2383. [ FREE Full text ] [ CrossRef ] [ Medline ]
- Melnyk BM, Kelly SA, Stephens J, Dhakal K, McGovern C, Tucker S, et al. Interventions to improve mental health, well-being, physical health, and lifestyle behaviors in physicians and nurses: a systematic review. Am J Health Promot. 2020;34(8):929-941. [ FREE Full text ] [ CrossRef ] [ Medline ]
- Ernst J, Jordan KD, Weilenmann S, Sazpinar O, Gehrke S, Paolercio F, et al. Burnout, depression and anxiety among Swiss medical students—a network analysis. J Psychiatr Res. 2021;143:196-201. [ FREE Full text ] [ CrossRef ] [ Medline ]
- Appiani FJ, Cairoli FR, Sarotto L, Yaryour C, Basile ME, Duarte JM. Prevalence of stress, burnout syndrome, anxiety and depression among physicians of a teaching hospital during the COVID-19 pandemic. [prevalencia de estrés, síndrome de desgaste profesional, ansiedad y depresión en médicos de un hospital universitario durante la pandemia de COVID-19]. Arch Argent Pediatr. 2021;119(5):317-324. [ FREE Full text ] [ CrossRef ] [ Medline ]
- Colville GA, Smith JG, Brierley J, Citron K, Nguru NM, Shaunak PD, et al. Coping with staff burnout and work-related posttraumatic stress in intensive care. Pediatr Crit Care Med. 2017;18(7):e267-e273. [ CrossRef ] [ Medline ]
- Misiolek-Marín A, Soto-Rubio A, Misiolek H, Gil-Monte PR. Influence of burnout and feelings of guilt on depression and health in anesthesiologists. Int J Environ Res Public Health. 2020;17(24):9267. [ FREE Full text ] [ CrossRef ] [ Medline ]
- Shanafelt TD, West CP, Dyrbye LN, Trockel M, Tutty M, Wang H, et al. Changes in burnout and satisfaction with work-life integration in physicians during the first 2 years of the COVID-19 pandemic. Mayo Clin Proc. 2022;97(12):2248-2258. [ FREE Full text ] [ CrossRef ] [ Medline ]
- Sexton JB, Adair KC, Proulx J, Profit J, Cui X, Bae J, et al. Emotional exhaustion among US health care workers before and during the COVID-19 pandemic, 2019-2021. JAMA Netw Open. 2022;5(9):e2232748. [ FREE Full text ] [ CrossRef ] [ Medline ]
- Jaconia GD, Lynch LR, Miller LK, Hines RL, Pinyavat T. COVID-19 impact on resident mental health and well-being. J Neurosurg Anesthesiol. 2022;34(1):122-126. [ CrossRef ] [ Medline ]
- Menon NK, Shanafelt TD, Sinsky CA, Linzer M, Carlasare L, Brady KJS, et al. Association of physician burnout with suicidal ideation and medical errors. JAMA Netw Open. 2020;3(12):e2028780. [ FREE Full text ] [ CrossRef ] [ Medline ]
- Austin EE, Do V, Nullwala R, Pulido DF, Hibbert PD, Braithwaite J, et al. Systematic review of the factors and the key indicators that identify doctors at risk of complaints, malpractice claims or impaired performance. BMJ Open. 2021;11(8):e050377. [ FREE Full text ] [ CrossRef ] [ Medline ]
- Noah N, Potas N. Association between nursing work stress, burnout and nosocomial infection rate in a neonatal intensive care unit in Hargeisa, Somaliland. Trop Doct. 2022;52(1):46-52. [ FREE Full text ] [ CrossRef ] [ Medline ]
- Schlak AE, Aiken LH, Chittams J, Poghosyan L, McHugh M. Leveraging the work environment to minimize the negative impact of nurse burnout on patient outcomes. Int J Environ Res Public Health. 2021;18(2):610. [ FREE Full text ] [ CrossRef ] [ Medline ]
- Melamed S, Shirom A, Toker S, Berliner S, Shapira I. Burnout and risk of cardiovascular disease: evidence, possible causal paths, and promising research directions. Psychol Bull. 2006;132(3):327-353. [ CrossRef ] [ Medline ]
- Melamed S, Kushnir T, Shirom A. Burnout and risk factors for cardiovascular diseases. Behav Med. 1992;18(2):53-60. [ CrossRef ] [ Medline ]
- Kuhn CM, Flanagan EM. Self-care as a professional imperative: physician burnout, depression, and suicide. [prendre soin de soi, un impératif professionnel: l'épuisement professionnel, la dépression et le suicide chez les médecins]. Can J Anaesth. 2017;64(2):158-168. [ FREE Full text ] [ CrossRef ] [ Medline ]
- Lacy BE, Chan JL. Physician burnout: the hidden health care crisis. Clin Gastroenterol Hepatol. 2018;16(3):311-317. [ FREE Full text ] [ CrossRef ] [ Medline ]
- Arnsten AFT, Shanafelt T. Physician distress and burnout: the neurobiological perspective. Mayo Clin Proc. 2021;96(3):763-769. [ FREE Full text ] [ CrossRef ] [ Medline ]
- HaGani N, Hershler ME, Ben Shlush E. The relationship between burnout, commuting crashes and drowsy driving among hospital health care workers. Int Arch Occup Environ Health. 2022;95(6):1357-1367. [ FREE Full text ] [ CrossRef ] [ Medline ]
- Pulcrano M, Evans SRT, Sosin M. Quality of life and burnout rates across surgical specialties: a systematic review. JAMA Surg. 2016;151(10):970-978. [ CrossRef ] [ Medline ]
- Kim HG, Cheon EJ, Bai DS, Lee YH, Koo BH. Stress and heart rate variability: a meta-analysis and review of the literature. Psychiatry Investig. 2018;15(3):235-245. [ FREE Full text ] [ CrossRef ] [ Medline ]
- Hirotsu C, Tufik S, Andersen ML. Interactions between sleep, stress, and metabolism: from physiological to pathological conditions. Sleep Sci. 2015;8(3):143-152. [ FREE Full text ] [ CrossRef ] [ Medline ]
- Herborn KA, Graves JL, Jerem P, Evans NP, Nager R, McCafferty DJ, et al. Skin temperature reveals the intensity of acute stress. Physiol Behav. 2015;152(Pt A):225-230. [ FREE Full text ] [ CrossRef ] [ Medline ]
- Membrive-Jiménez MJ, Gómez-Urquiza JL, Suleiman-Martos N, Velando-Soriano A, Ariza T, De la Fuente-Solana EI, et al. Relation between burnout and sleep problems in nurses: a systematic review with meta-analysis. Healthcare (Basel). 2022;10(5):954. [ FREE Full text ] [ CrossRef ] [ Medline ]
- Dong L, Xie Y, Zou X. Association between sleep duration and depression in US adults: a cross-sectional study. J Affect Disord. 2022;296:183-188. [ FREE Full text ] [ CrossRef ] [ Medline ]
- Cox RC, Olatunji BO. A systematic review of sleep disturbance in anxiety and related disorders. J Anxiety Disord. 2016;37:104-129. [ CrossRef ] [ Medline ]
- Cisco visual networking index: global mobile data traffic forecast update, 2017–2022. The Networking REPORT. 2019. URL: https://networking.report/whitepapers/cisco-visual-networking-index-global-mobile-data-trafficforecast-update-2017%E2%80%932022 [accessed 2024-04-10]
- Hickey BA, Chalmers T, Newton P, Lin CT, Sibbritt D, McLachlan CS, et al. Smart devices and wearable technologies to detect and monitor mental health conditions and stress: a systematic review. Sensors (Basel). 2021;21(10):3461. [ FREE Full text ] [ CrossRef ] [ Medline ]
- Feng T, Booth BM, Baldwin-Rodríguez B, Osorno F, Narayanan S. A multimodal analysis of physical activity, sleep, and work shift in nurses with wearable sensor data. Sci Rep. 2021;11(1):8693. [ FREE Full text ] [ CrossRef ] [ Medline ]
- Adler DA, Tseng VWS, Qi G, Scarpa J, Sen S, Choudhury T. Identifying mobile sensing indicators of stress-resilience. Proc ACM Interact Mob Wearable Ubiquitous Technol. 2021;5(2):51. [ FREE Full text ] [ CrossRef ] [ Medline ]
- Jevsevar DS, Molloy IB, Gitajn IL, Werth PM. Orthopaedic surgeon physiological indicators of strain as measured by a wearable fitness device. J Am Acad Orthop Surg. 2021;29(24):e1378-e1386. [ CrossRef ] [ Medline ]
- Silva E, Aguiar J, Reis LP, Sá JOE, Gonçalves J, Carvalho V. Stress among Portuguese medical students: the EuStress solution. J Med Syst. 2020;44(2):45. [ CrossRef ] [ Medline ]
- Mendelsohn D, Despot I, Gooderham PA, Singhal A, Redekop GJ, Toyota BD. Impact of work hours and sleep on well-being and burnout for physicians-in-training: the resident activity tracker evaluation study. Med Educ. 2019;53(3):306-315. [ CrossRef ] [ Medline ]
- Marek AP, Nygaard RM, Liang ET, Roetker NS, DeLaquil M, Gregorich S, et al. The association between objectively-measured activity, sleep, call responsibilities, and burnout in a resident cohort. BMC Med Educ. 2019;19(1):158. [ FREE Full text ] [ CrossRef ] [ Medline ]
- Sochacki KR, Dong D, Peterson L, McCulloch PC, Harris JD. The measurement of orthopaedic surgeon burnout using a validated wearable device. Arthrosc Sports Med Rehabil. 2019;1(2):e115-e121. [ FREE Full text ] [ CrossRef ] [ Medline ]
- Chaukos D, Chad-Friedman E, Mehta DH, Byerly L, Celik A, McCoy TH, et al. SMART-R: a prospective cohort study of a resilience curriculum for residents by residents. Acad Psychiatry. 2018;42(1):78-83. [ CrossRef ] [ Medline ]
- de Looff P, Nijman H, Didden R, Embregts P. Burnout symptoms in forensic psychiatric nurses and their associations with personality, emotional intelligence and client aggression: a cross-sectional study. J Psychiatr Ment Health Nurs. 2018;25(8):506-516. [ FREE Full text ] [ CrossRef ] [ Medline ]
- Weenk M, Alken APB, Engelen LJLPG, Bredie SJH, van de Belt TH, van Goor H. Stress measurement in surgeons and residents using a smart patch. Am J Surg. 2018;216(2):361-368. [ CrossRef ] [ Medline ]
- Stang A. Critical evaluation of the Newcastle-Ottawa scale for the assessment of the quality of nonrandomized studies in meta-analyses. Eur J Epidemiol. 2010;25(9):603-605. [ CrossRef ] [ Medline ]
- Maslach C, Jackson SE, Leiter MP. Maslach Burnout Inventory Manual, 3rd Edition. Palo Alto, CA. ConsultingPsychologists Press; 1996.
- Kroenke K, Spitzer RL, Williams JB. The PHQ-9: validity of a brief depression severity measure. J Gen Intern Med. 2001;16(9):606-613. [ FREE Full text ] [ CrossRef ] [ Medline ]
- Spielberger CD. State-trait anxiety inventory for adults. American Psychological Association. 1983. URL: https://psycnet.apa.org/doiLanding?doi=10.1037%2Ft06496-000 [accessed 2024-04-10]
- Vilagut G, Forero CG, Barbaglia G, Alonso J. Screening for depression in the general population with the Center for Epidemiologic Studies Depression (CES-D): a systematic review with meta-analysis. PLoS One. 2016;11(5):e0155431. [ FREE Full text ] [ CrossRef ] [ Medline ]
- Spitzer RL, Kroenke K, Williams JBW, Löwe B. A brief measure for assessing generalized anxiety disorder: the GAD-7. Arch Intern Med. 2006;166(10):1092-1097. [ FREE Full text ] [ CrossRef ] [ Medline ]
- Sargent MC, Sotile W, Sotile MO, Rubash H, Barrack RL. Stress and coping among orthopaedic surgery residents and faculty. J Bone Joint Surg Am. 2004;86(7):1579-1586. [ CrossRef ] [ Medline ]
- Sargent MC, Sotile W, Sotile MO, Rubash H, Barrack RL. Quality of life during orthopaedic training and academic practice. part 1: orthopaedic surgery residents and faculty. J Bone Joint Surg Am. 2009;91(10):2395-2405. [ CrossRef ] [ Medline ]
- Hirten RP, Suprun M, Danieletto M, Zweig M, Golden E, Pyzik R, et al. A machine learning approach to determine resilience utilizing wearable device data: analysis of an observational cohort. JAMIA Open. 2023;6(2):ooad029. [ FREE Full text ] [ CrossRef ] [ Medline ]
- Ghosh K, Nanda S, Hurt RT, Schroeder DR, West CP, Fischer KM, et al. Mindfulness using a wearable brain sensing device for health care professionals during a pandemic: a pilot program. J Prim Care Community Health. 2023;14:21501319231162308. [ FREE Full text ] [ CrossRef ] [ Medline ]
- Huberty J, Green J, Glissmann C, Larkey L, Puzia M, Lee C. Efficacy of the mindfulness meditation mobile app "calm" to reduce stress among college students: randomized controlled trial. JMIR Mhealth Uhealth. 2019;7(6):e14273. [ FREE Full text ] [ CrossRef ] [ Medline ]
- Pyrkov TV, Sokolov IS, Fedichev PO. Deep longitudinal phenotyping of wearable sensor data reveals independent markers of longevity, stress, and resilience. Aging (Albany NY). 2021;13(6):7900-7913. [ FREE Full text ] [ CrossRef ] [ Medline ]
- Thota D. Evaluating the relationship between fitbit sleep data and self-reported mood, sleep, and environmental contextual factors in healthy adults: pilot observational cohort study. JMIR Form Res. 2020;4(9):e18086. [ FREE Full text ] [ CrossRef ] [ Medline ]
- Fischer D, McHill AW, Sano A, Picard RW, Barger LK, Czeisler CA, et al. Irregular sleep and event schedules are associated with poorer self-reported well-being in US college students. Sleep. 2020;43(6):zsz300. [ FREE Full text ] [ CrossRef ] [ Medline ]
- Sano A, Yu AZ, McHill AW, Phillips AJK, Taylor S, Jaques N, et al. Prediction of happy-sad mood from daily behaviors and previous sleep history. Annu Int Conf IEEE Eng Med Biol Soc. 2015;2015:6796-6799. [ FREE Full text ] [ CrossRef ] [ Medline ]
- Umematsu T, Sano A, Picard RW. Daytime data and LSTM can forecast tomorrow's stress, health, and happiness. Annu Int Conf IEEE Eng Med Biol Soc. 2019;2019:2186-2190. [ CrossRef ] [ Medline ]
- Umematsu T, Sano A, Taylor S, Tsujikawa M, Picard RW. Forecasting stress, mood, and health from daytime physiology in office workers and students. Annu Int Conf IEEE Eng Med Biol Soc. 2020;2020:5953-5957. [ CrossRef ] [ Medline ]
- Ben-Zeev D, Scherer EA, Wang R, Xie H, Campbell AT. Next-generation psychiatric assessment: using smartphone sensors to monitor behavior and mental health. Psychiatr Rehabil J. 2015;38(3):218-226. [ FREE Full text ] [ CrossRef ] [ Medline ]
- Buck B, Hallgren KA, Campbell AT, Choudhury T, Kane JM, Ben-Zeev D. mHealth-assisted detection of precursors to relapse in schizophrenia. Front Psychiatry. 2021;12:642200. [ FREE Full text ] [ CrossRef ] [ Medline ]
- daSilva AW, Huckins JF, Wang W, Wang R, Campbell AT, Meyer ML. Daily perceived stress predicts less next day social interaction: evidence from a naturalistic mobile sensing study. Emotion. 2021;21(8):1760-1770. [ CrossRef ] [ Medline ]
- Huckins JF, DaSilva AW, Hedlund EL, Murphy EI, Rogers C, Wang W, et al. Causal factors of anxiety and depression in college students: longitudinal ecological momentary assessment and causal analysis using Peter and Clark momentary conditional independence. JMIR Ment Health. 2020;7(6):e16684. [ FREE Full text ] [ CrossRef ] [ Medline ]
- Huckins JF, daSilva AW, Wang R, Wang W, Hedlund EL, Murphy EI, et al. Fusing mobile phone sensing and brain imaging to assess depression in college students. Front Neurosci. 2019;13:248. [ FREE Full text ] [ CrossRef ] [ Medline ]
- Huckins JF, daSilva AW, Wang W, Hedlund E, Rogers C, Nepal SK, et al. Mental health and behavior of college students during the early phases of the COVID-19 pandemic: longitudinal smartphone and ecological momentary assessment study. J Med Internet Res. 2020;22(6):e20185. [ FREE Full text ] [ CrossRef ] [ Medline ]
- Calvert M, Blazeby J, Altman DG, Revicki DA, Moher D, Brundage MD, et al. CONSORT PRO Group. Reporting of patient-reported outcomes in randomized trials: the CONSORT PRO extension. JAMA. 2013;309(8):814-822. [ FREE Full text ] [ CrossRef ] [ Medline ]
- von Elm E, Altman DG, Egger M, Pocock SJ, Gøtzsche PC, Vandenbroucke JP, et al. STROBE Initiative. The Strengthening the Reporting of Observational Studies in Epidemiology (STROBE) statement: guidelines for reporting observational studies. Int J Surg. 2014;12(12):1495-1499. [ FREE Full text ] [ CrossRef ] [ Medline ]
- Martinez-Martin N, Luo Z, Kaushal A, Adeli E, Haque A, Kelly SS, et al. Ethical issues in using ambient intelligence in health-care settings. Lancet Digit Health. 2021;3(2):e115-e123. [ FREE Full text ] [ CrossRef ] [ Medline ]
- Johansson JV, Bentzen HB, Mascalzoni D. What ethical approaches are used by scientists when sharing health data? an interview study. BMC Med Ethics. 2022;23(1):41. [ FREE Full text ] [ CrossRef ] [ Medline ]
- Shanafelt TD, West CP, Sinsky C, Trockel M, Tutty M, Satele DV, et al. Changes in burnout and satisfaction with work-life integration in physicians and the general US working population between 2011 and 2017. Mayo Clin Proc. 2019;94(9):1681-1694. [ FREE Full text ] [ CrossRef ] [ Medline ]
- van Kessel R, Wong BLH, Clemens T, Brand H. Digital health literacy as a super determinant of health: more than simply the sum of its parts. Internet Interv. 2022;27:100500. [ FREE Full text ] [ CrossRef ] [ Medline ]
- Busse TS, Nitsche J, Kernebeck S, Jux C, Weitz J, Ehlers JP, et al. Approaches to improvement of Digital Health Literacy (eHL) in the context of person-centered care. Int J Environ Res Public Health. 2022;19(14):8309. [ FREE Full text ] [ CrossRef ] [ Medline ]
Abbreviations
| Consolidated Standards of Reporting Trials |
| health care professional |
| heart rate |
| heart rate variability |
| Maslach Burnout Inventory–Human Services Survey |
| State-Trait Anxiety Inventory |
| step count |
| Strengthening the Reporting of Observational Studies in Epidemiology |
Edited by T de Azevedo Cardoso; submitted 24.06.23; peer-reviewed by T Pipe, P Punda; comments to author 01.12.23; revised version received 01.01.24; accepted 20.03.24; published 25.06.24.
©Milica Barac, Samantha Scaletty, Leslie C Hassett, Ashley Stillwell, Paul E Croarkin, Mohit Chauhan, Sherry Chesak, William V Bobo, Arjun P Athreya, Liselotte N Dyrbye. Originally published in the Journal of Medical Internet Research (https://www.jmir.org), 25.06.2024.
This is an open-access article distributed under the terms of the Creative Commons Attribution License (https://creativecommons.org/licenses/by/4.0/), which permits unrestricted use, distribution, and reproduction in any medium, provided the original work, first published in the Journal of Medical Internet Research, is properly cited. The complete bibliographic information, a link to the original publication on https://www.jmir.org/, as well as this copyright and license information must be included.
Thank you for visiting nature.com. You are using a browser version with limited support for CSS. To obtain the best experience, we recommend you use a more up to date browser (or turn off compatibility mode in Internet Explorer). In the meantime, to ensure continued support, we are displaying the site without styles and JavaScript.
- View all journals
- Explore content
- About the journal
- Publish with us
- Sign up for alerts
- Open access
- Published: 18 June 2024
Plasma proteomics identify biomarkers predicting Parkinson’s disease up to 7 years before symptom onset
- Jenny Hällqvist ORCID: orcid.org/0000-0001-6709-3211 1 , 2 na1 ,
- Michael Bartl ORCID: orcid.org/0000-0002-7752-2443 3 , 4 na1 ,
- Mohammed Dakna 3 ,
- Sebastian Schade ORCID: orcid.org/0000-0002-6316-6804 5 ,
- Paolo Garagnani ORCID: orcid.org/0000-0002-4161-3626 6 ,
- Maria-Giulia Bacalini 7 ,
- Chiara Pirazzini 6 ,
- Kailash Bhatia ORCID: orcid.org/0000-0001-8185-286X 8 ,
- Sebastian Schreglmann ORCID: orcid.org/0000-0002-4129-5808 8 ,
- Mary Xylaki ORCID: orcid.org/0000-0002-7892-8621 3 ,
- Sandrina Weber 3 ,
- Marielle Ernst 9 ,
- Maria-Lucia Muntean 5 ,
- Friederike Sixel-Döring 5 , 10 ,
- Claudio Franceschi ORCID: orcid.org/0000-0001-9841-6386 6 ,
- Ivan Doykov 1 ,
- Justyna Śpiewak 1 ,
- Héloїse Vinette ORCID: orcid.org/0009-0000-4360-1293 1 , 11 ,
- Claudia Trenkwalder 5 , 12 ,
- Wendy E. Heywood ORCID: orcid.org/0000-0003-2106-8760 1 ,
- Kevin Mills 2 na2 &
- Brit Mollenhauer ORCID: orcid.org/0000-0001-8437-3645 3 , 5 na2
Nature Communications volume 15 , Article number: 4759 ( 2024 ) Cite this article
20k Accesses
2101 Altmetric
Metrics details
- Parkinson's disease
Parkinson’s disease is increasingly prevalent. It progresses from the pre-motor stage (characterised by non-motor symptoms like REM sleep behaviour disorder), to the disabling motor stage. We need objective biomarkers for early/pre-motor disease stages to be able to intervene and slow the underlying neurodegenerative process. Here, we validate a targeted multiplexed mass spectrometry assay for blood samples from recently diagnosed motor Parkinson’s patients ( n = 99), pre-motor individuals with isolated REM sleep behaviour disorder (two cohorts: n = 18 and n = 54 longitudinally), and healthy controls ( n = 36). Our machine-learning model accurately identifies all Parkinson patients and classifies 79% of the pre-motor individuals up to 7 years before motor onset by analysing the expression of eight proteins—Granulin precursor, Mannan-binding-lectin-serine-peptidase-2, Endoplasmatic-reticulum-chaperone-BiP, Prostaglaindin-H2-D-isomaerase, Interceullular-adhesion-molecule-1, Complement C3, Dickkopf-WNT-signalling pathway-inhibitor-3, and Plasma-protease-C1-inhibitor. Many of these biomarkers correlate with symptom severity. This specific blood panel indicates molecular events in early stages and could help identify at-risk participants for clinical trials aimed at slowing/preventing motor Parkinson’s disease.
Plasma GFAP as a prognostic biomarker of motor subtype in early Parkinson’s disease

Prediction of motor and non-motor Parkinson’s disease symptoms using serum lipidomics and machine learning: a 2-year study

Parkinson’s progression prediction using machine learning and serum cytokines
Introduction.
Parkinson’s disease (PD) is a complex and increasingly prevalent neurodegenerative disease of the central nervous system (CNS). It is clinically characterised by progressive motor and non-motor symptoms that are caused by α-synuclein aggregation predominantly in dopaminergic cells, which leads to Lewy body (LB) formation 1 . The failure of neuroprotective strategies in preventing disease progression is due, in part, to the clinical heterogeneity of the disease—it has several phenotypes—and to the lack of objective biomarker readouts 2 . To facilitate the approval of neuroprotective strategies, governing agencies and pharmaceutical companies need regulatory pathways that use objectively measurable markers—potential therapeutical targets as well as state and rate biomarkers—directly associated with PD pathophysiology and clinical phenotypes 3 .
The recently emerged α-synuclein seed amplification assays (SAA) can identify α-synuclein pathology in vivo and support stratification purposes but still rely on cerebrospinal fluid (CSF) obtained through relatively invasive lumbar punctures 4 . Therefore, this test remains specialised and not readily suitable for large-scale clinical use. As peripheral fluid biomarkers are less invasive and easier to obtain, they could be used in repeated and long-term monitoring, which is necessary for population-based screenings for upcoming neuroprotective trials. While the only emerged serum biomarker in the last years, axonal marker neurofilament light chain (NfL), increases longitudinally and correlates with motor and cognitive PD progression 5 , it is non-specific to the disease process.
Growing data support evidence of PD pathology in the peripheral system, which increases the likelihood of finding a source of matrices for less invasive biomarkers. We know α-synuclein aggregation induces neurodegeneration, which is propagated throughout the CNS. Evidence indicates that additional inflammatory events are an early and potentially initial step in a pathophysiological cascade leading to downstream α-synuclein aggregation that activates the immune system 6 . Inflammatory risk factors in circulating blood (i.e. C-reactive-protein and Interleukin-6 and α-synuclein-specific T-cells) are associated with motor deterioration and cognitive decline in PD 7 , 8 . These inflammatory blood markers can even be identified in plasma/serum samples of individuals with isolated REM sleep behaviour disorder (iRBD), the early stage of a neuronal synuclein disease (NSD), and the most specific predictor for PD and dementia with Lewy bodies (DLB) 6 . NSD was recently proposed as a biologically defined term, for a spectrum of clinical syndromes, including iRBD, PD and DLB, that follow an integrated clinical staging system of progressing neuronal α-synuclein pathology (NSD-ISS) 9 .
In this study, we used mass spectrometry-based proteomic phenotyping to identify a panel of blood biomarkers in early PD. In the initial discovery stage, we analysed samples from a well-characterised cohort of de novo PD patients and healthy controls (HC) who had been subjected to rigorous collection protocols 10 . Using unbiased state-of-the-art mass spectrometry, we identified putatively involved proteins, suggesting an early inflammatory profile in plasma. We thereafter moved on to the validation phase by creating a high-throughput and targeted proteomic assay that was applied to samples from an independent replication cohort, consisting of de novo PD, HC and iRBD patients. Finally, after refining the targeted proteomic panel to include a multiplex of only the biomarkers which were reliably measured, an independent analysis was performed on a larger and independent cohort of longitudinal, high-risk subjects who had been confirmed as iRBD by state-of-the-art video-recorded polysomnography (vPSG), including follow-up sampling of up to 7 years.
In summary, using a panel of eight blood biomarkers identified in a machine-learning approach, we were able to differentiate between PD and HC with a specificity of 100%, and to identify 79% of the iRBD subjects, up to 7 years before the development of either DLB or motor PD (NSD stage 3). Our identified panel of biomarkers significantly advances NSD research by providing potential screening and detection markers for use in the earliest stages of NSD for subject identification/stratification for the upcoming prevention trials.
Proteomic discovery phase 0
We performed a bottom-up proteomics analysis of plasma, which had been depleted of the major blood proteins, using two-dimensional in-line liquid chromatography fractionation into ten fractions and label-free mass spectrometric analysis by QTOF MS E . The discovery cohort consisted of ten randomly selected drug-naïve patients with PD and ten matched HC from the de novo Parkinson’s disease (DeNoPa 10 ) cohort (details can be found in Supplementary Table 1 ). This analysis identified 1238 proteins when restricting identification to originate from at least one peptide per protein and at least two fragments per peptide. After excluding proteins with less than two unique peptides or with an identification score below a set threshold (see method section below), 895 distinct proteins remained. Of these proteins, 47 were differentially expressed between the de novo PD and control groups on a nominal significance level of 95%. Pathway analysis suggested enrichment in several inflammatory pathways. Workflow and Results are shown in Fig. 1 , and 2 Supplementary Figs. 1 , 2.

The study included three phases. Phase 0 consisted of discovery proteomics by untargeted mass spectrometry to identify putative biomarkers, followed by phase I in which targets from the discovery phase were transferred to a targeted, mass spectrometric MRM method and applied to a new and larger cohort of samples, and finally phase II in which the targeted MRM method was refined and a larger number of samples were analysed to evaluate the clinical feasibility of the targeted protein panel.

The circle radii in the Volcano plot represent the identification certainty, where large radii represent proteins identified by at least two unique peptides and an identification score >15, smaller radii are given for proteins identified by two or more unique peptides or a confidence score >15. The horizontal axis shows log 2 of the average fold-change and the vertical axis shows −log 10 of the p values. The significantly different proteins are annotated by gene name and coloured in pink, while the non-significant proteins are coloured in grey. GO annotations for the significant proteins are shown, the dashed line represents p = 0.05. Disease and function annotations from IPA are shown, divided into annotations with a positive or negative activation score. Source data are provided as a Source Data file.
Selection of proteins for the targeted proteomic assay
We next developed a validatory, high-throughput and multiplexed, mass spectrometric targeted proteomic assay based on the potential biomarkers identified in the discovery phase. Additional proteins were also included in the assay, several of which had been identified in previous discovery studies of PD, Alzheimer’s disease (AD), and ageing 11 . In addition, we also included several known pro- and anti-inflammatory proteins identified in the literature 12 , 13 , 14 , 15 , which had been previously developed into an in-house targeted proteomic neuroinflammatory panel. Using this approach, we created a targeted proteomic panel, including biomarkers from current scientific developments and preliminary findings from our own work 16 , 17 . This targeted proteomic and multiplexed assay included 121 proteins and aimed to validate biomarkers and probe the pathways identified as being perturbed in the discovery phase. Details can be found in Supplementary Table 2 and Fig. 3 .

Workflow and overview of the results of the targeted proteomic analysis of de novo Parkinson’s disease (PD) subjects, healthy controls (HC), and the validation cohorts of other neurological disorders (OND) and isolated REM sleep behaviour disorder (iRBD). A A targeted mass spectrometric proteomic assay was developed and optimised. The assay was then applied to plasma samples from cohorts comprising de novo PD ( n = 99) and HC ( n = 36), and validated in patients with OND ( n = 41) and prodromal subjects with iRBD ( n = 18). The protein expression difference between the groups was compared using Mann–Whitney’s two-sided U -test with Benjamini–Hochberg FDR adjustment at 5%. The lollipop charts show the log 10 p values, signed according to fold-changes. Pink icons represent a protein upregulated in an affected group and grey represents a protein upregulated in controls. B Significantly differentially expressed proteins in the comparison between de novo PD and healthy controls. C Significantly differentially expressed proteins between iRBD, OND and HC. Source data are provided as a Source Data file.
Demographics-targeted proteomic validation phase (phase I)
For the targeted proteomics analysis, we used plasma samples, independent from the proteomic discovery step, from 99 individuals recently diagnosed with de novo PD (48 men, 50%, mean age 67 years) and 36 healthy controls (HC; 20 men, 57%, mean age 64 years). This was the main cohort, to which we added further samples for validation that consisted of a heterogeneous group of 41 patients with other neurological diseases (OND) (29 men, 71%, mean age 70 years) and 18 patients with vPSG-confirmed iRBD (10 men, 56%, mean age 67 years). Further details can be found in Table 1 and Fig. 3 .
The identification of biomarkers that were significantly and differentially expressed biomarkers between patients with de novo Parkinson’s disease and healthy controls- Targeted proteomic validation phase (phase I)
Our targeted proteomic assay was developed for 121 proteins, 32 of which we consistently and reliably detected in plasma. Of these 32 markers, 23 were confirmed as being significantly and differentially expressed between PD and HC. We identified six differentially expressed proteins in the comparison between iRBD patients and HC and between OND and HC (Fig. 3 ). Both the de novo PD and iRBD groups demonstrated an upregulated expression of the serine protease inhibitors SERPINA3, SERPINF2 and SERPING1, and of the central complement protein C3. Granulin precursor protein was shown to be downregulated in all three patient groups (PD, iRBD and OND) compared to HC. The OND and PD groups had a shared and upregulated expression of the proteins PTGDS, CST3, VCAM1 and PLD3. Detailed information about the diagnoses of the OND group can be found in Table 1 , and detailed information about the proteins can be found in Supplementary Table 2 . Figure 4 shows the significantly different proteins as Box-scatter plots.

The data are displayed as Box and Whisker plots overlaid with scatter plots of the individual measurements. The whiskers show the minimum and maximum, and the boxes show the 25th percentile, the median and the 75th percentile. The protein expression difference between the groups was compared using Mann–Whitney’s two-sided U -test with Benjamini–Hochberg multiple testing correction (FDR adjustment at 5%). ns not significant, * p < 0.05, ** p < 0.01, *** p < 0.001 and **** p < 0.0001. The proteins are represented by gene names. Source data are provided as a Source Data file.
The biological significance of the differentially expressed proteins- Targeted proteomic validation phase (phase I)
The involvement of the differentially expressed proteins and their impact on biological processes were evaluated using pathway analysis (Ingenuity Pathway Analysis [IPA], Qiagen). The significantly differentially expressed proteins between PD and HC were used as input, with a fold-change set as the expression observation. We considered pathways as significant if they had an enrichment p value <0.05. At least two of the input proteins were included. Three major pathway clusters were identified and consisted of (i) the expression of serine protease inhibitors or serpins and complement and coagulation components, (ii) endoplasmic reticulum (ER) stress/heat shock-related proteins and (iii) the expression of VCAM1, SELE and PPP3CB. The highest enrichment scores were identified in the pathways acute phase response signalling ( p = 7.8 E −10 ), coagulation system ( p = 7.4 E −6 ), complement system ( p = 8.1 E −6 ), LXR/RXR activation ( p = 9.1 E −6 ), FXR/RXR activation ( p = 9.8 E −6 ) and glucocorticoid receptor signalling ( p = 2.0 E −5 ). These are all pathways involved in inflammatory responses. We also identified pathways related to the unfolded protein response ( p = 0.004) and neuroinflammation ( p = 0.04), although with lower enrichment scores. For details, see Supplementary Fig. 1 .
Inflammation-related pathways (including both the complement system and the acute phase response) demonstrated the highest significance levels, followed by pathways regulating protein folding, ER stress, and heat shock proteins. A network representation of proteins and pathways showed clusters consisting of inflammation/coagulation/lipid metabolism (FXR/RXR and LXR/RXR), heat shock proteins/protein misfolding, and more heterogenous pathway clusters related to Wnt-signalling and extracellular matrix proteins. Figure 5 illustrates the potential detrimental and protective mechanisms suggested to be taking place based on the protein expressions observed in this study, leading to oligomerisation and accumulation of α-synuclein in neuronal Lewy body inclusions and, finally, dopaminergic neuronal cell loss.

Oligomerisation and accumulation of α-synuclein in Lewy body inclusions is a key process in the pathophysiology of neuronal synuclein disease, i.e. Parkinson’s disease and dementia with Lewy bodies from aggregation and accumulation, the pathological pathway includes different steps finally leading to the loss of dopaminergic neurons. Protective and detrimental mechanisms influence these processes, based on the differently expressed protein profiles, assessed by targeted mass spectrometry in our study. Detailed information about the proteins can be found in Supplementary Table 2 .
Multivariate analysis shows differences between the proteomes of Parkinson’s disease and controls- Targeted proteomic validation phase (phase I)
Principal component analysis (PCA) demonstrated that the HC and PD groups formed two clusters separate from each other over the first and second principal components (PC), attributed with 23.5% and 13.9% of the model’s total variance, respectively. The iRBD group was situated in the middle of HC and PD, and the OND group varied considerably with no evident clustering, as expected due to the heterogeneity of diseases. The corresponding loadings of PC1 and PC2 demonstrated that those with PD correlated with lower levels of PPP3CB, DKK3, SELE and GRN, and higher levels of most of the other proteins. The loadings plot had a high level of covariation in the expression of the PPP3CB, DKK3 and SELE proteins, which were all downregulated in PD. These proteins correlated negatively with the expression of SERPINs, complement C3 and HPX, which all showed a high degree of covariation, and were upregulated in the PD group. Data are displayed in Supplementary Fig. 2 .
The use of multiplexed protein panels of protein biomarkers for the prediction of de novo Parkinson’s disease- Targeted proteomic validation phase (phase I)
We next applied machine learning to construct a discriminant OPLS-DA model using the PD and HC samples from the validation phase. The samples clustered into two distinct and well-separated classes, and evaluation of the model showed that it was highly significant ( p = 2.3E −27 permutations p = <0.001). The proteins with the greatest influence on the class separations were GRN, DKK3, C3, SERPINA3, HPX, SERPINF2, CAPN2, SERPING1 and SELE. We predicted the iRBD samples in the model, which resulted in 13 subjects classified as PD (72%) and five not belonging to either group. None of the iRBD samples were classified as controls. We additionally predicted the OND samples, out of which nine were classified as HC, 12 as PD and 19 were not classified as belonging to either group. The 12 samples predicted as PD did not demonstrate enrichment according to the OND groups. The random distribution of the OND samples between PD and HC indicates that the heterogenous group of OND individuals does not share a distinct protein expression with either the HC or PD groups. The iRBD samples that were classified as PD, and not as HC, strongly suggest a shared proteomic profile between iRBD and the protein expression observed in the newly diagnosed PD patients.
We subsequently explored if the observed protein expressions could be used to build a regression model capable of predicting whether individuals belonged to the PD or HC groups. We identified a panel of proteins that discriminated between PD and HC with 100% accuracy and then constructed a linear support vector classification model and applied recursive feature elimination to pinpoint the most discriminating variables. The data were divided into two parts: one consisting of 70% for model training and one containing 30% for testing. The proportion of PD and control samples was maintained in each part. The number of features included in the model was determined by feature ranking with cross-validated recursive feature elimination in the training dataset. The feature selection resulted in a model with eight predictors: GRN, MASP2, HSPA5, PTGDS, ICAM1, C3, DKK3 and SERPING1. The training data were predicted in the model and resulted in all samples being classified in the correct class. We further constructed receiver operating characteristic (ROC) and precision-recall (PR) curves to illustrate the ability of each protein to distinguish between PD and HC and compared this with the ability of the combined multiplexed protein panel. The combined panel achieved an AUC of 1.0 on both ROC and PR curves. The AUC of the individual predictors ranged from 0.53 to 0.92 in the ROC curve, and from 0.79 to 0.96 in the PR curve (Fig. 6 ). We further evaluated the whole dataset by performing repeated cross-validation with six splits of the data and 40 repetitions. The resulting classification metrics (Supplementary Fig. 3 ) demonstrated average and standard deviation for precision, recall, F1 score, and balanced accuracy score of 0.87 ± 0.09, 0.87 ± 0.08, 0.86 ± 0.09 and 0.82 ± 0.12, respectively, thereby indicating a highly robust classification model. Testing the model’s specificity for PD, we predicted the heterogenous group of OND, resulting in 26 of the 42 samples being classified as PD-like. Prediction of the prodromal iRBD group resulted in 17 of 18 samples being classified as PD-like. We compared the prediction of the OND and iRBD samples between the OPLS-DA and SVM models, finding that most of the samples were classified in the same group in both models (out of the samples with a classification in the OPLS-DA model: 82% in OND and 100% in iRBD). The proportion of iRBD samples classified as PD in our models (72% in the OPLS-DA model and 94% in the SVM model) is in line with clinical evidence based on longitudinal cohort studies, reporting that over 80% of iRBD subjects will develop an advanced NSD with motor impairment and/or cognitive decline 18 . We evaluated the influence of age and sex on the proteins included in the support vector model and found that neither influenced the model’s classification ability (see Supplementary Methods 2 for details).

The model was trained on 70% of the samples to establish the most discriminating features. Applying cross-validated recursive feature elimination, the top predictors were determined as a granulin precursor, mannan-binding lectin-serine peptidase 2, endoplasmic reticulum chaperone-BiP, prostaglandin-H2 d -isomerase, intercellular adhesion molecule-1, complement C3, dickkopf-3 and plasma protease C1 inhibitor. The remaining 30% of samples were predicted in the model and resulted in 100% prediction accuracy. Receiver operating characteristics (ROC) and precision-recall (PR) curves of the individual and combined proteins in the test set demonstrated that the individual proteins achieved ROC area under the curve (AUC) values 0.53–0.92 and PR values 0.79–0.96, while the combined predictors reached an area under the curve = 1.0. Source data are provided as a Source Data file.
Development of a rapid and refined LC-MS/MS method and evaluation of an independent and longitudinal iRBD cohort (Independent replication cohort-phase II)
To evaluate the results from the initial prediction models focusing on at-risk subjects, we developed and refined our targeted and multiplexed proteomic test to quantitate only those proteins that were readily and reliably detectable from the initial targeted proteomic assay ( n = 32). Next, we analysed an additional set of 146 longitudinal samples from an independent cohort of 54 individuals with iRBD. This cohort was available from continuing recruitment at the same centre and consisted of longitudinally followed iRBD subjects. Deep phenotyping revealed 100% (54/54) had RBD on PSG, 88.9% (48/54) had hyposmia as identified with the Sniffin’ Stick Identification Test, and 91.7 % (22/24) had neuronal α-synuclein positivity as shown by α-synuclein Seed Amplification Assay (SAA) in cerebrospinal fluid (CSF) 19 . Longitudinal follow-up was available for up to 10 years, during which 16 subjects (20%) phenoconverted to either PD ( n = 11) or dementia with Lewy bodies (DLB; n = 5). Since only serum samples were available from the independent replication cohort (further details can be found in Supplementary Table 3 ), we investigated how the proteins in our assay correlated between plasma, serum, and CSF and found good correlations between plasma and serum, but poor correlations between these blood matrices and CSF. The limited correlations between blood and CSF proteins correspond to those of other studies comparing the protein expression between plasma/serum and CSF 20 , 21 and underscore that our test does not necessarily reflect a prodromal and PD-specific proteomic signature of the protein expression in the CSF in proximity to the brain, but rather shows an earlier change in the blood protein expression between healthy status and very early PD patients (Details from this comparison can be found in Supplementary Methods 1 and Supplementary Fig. 4 ).
We applied all available longitudinal iRBD samples ( n = 146) from phase II to the two machine-learning models (OPLS-DA and support vector machine) constructed in phase I (PD vs. HC). The OPLS-DA model, based on all 32 detected proteins, identified 70% of the iRBD samples as PD, while the SVM model, which was based on a panel of eight proteins, identified 79% of the samples as PD. As mentioned above, at the time of analysis, 16 of the 54 subjects in our longitudinal iRBD validation cohort had developed PD/DLB. The earliest correct classification was 7.3 years prior to phenoconversion and the latest was 0.9 years prior to diagnosis (average 3.5 ± 2.4 years). Detailed information can be found in Fig. 7 and Supplementary Methods 3 .

146 new serum samples from individuals diagnosed with iRBD, several with longitudinal follow-up samples, were predicted in the OPLS-DA model. 70% of the samples were predicted as Parkinson’s disease (PD), and 23 of 40 individuals had all their longitudinal samples predicted as PD. In the more refined support vector machine (SVM) model, 79% of the 146 new samples were predicted as PD and 27 of 40 individuals consistently had all their longitudinal samples predicted as PD. Source data are provided as a Source Data file.
The correlation between differentially expressed protein biomarkers and patients’ clinical data in the targeted proteomic validation phase (phase I)
We next evaluated the relationship between proteins and clinical data by correlating the protein expression in PD and HC (from phase I) with clinical scores (Mini-Mental State Examination [MMSE], Hoehn & Yahr stage [H&Y] and UPDRS [Unified Parkinson’s Disease Rating Scale; I–III, and total score]). We found negative correlations for GRN, DKK3, PPP3CB, and SELE with H&Y and UPDRS parts II, III, and total score, possibly indicating a connection between a more severe clinical (especially motor) impairment and lower expression of markers in the Wnt-signalling pathways (DKK3 and PPP3CB). Higher Cystatin C plasma levels correlated with higher numbers in UPDRS part III (motor performance) and UPDRS total score. The same was found for PTGDS plasma levels, which were also negatively correlated with MMSE. The central complement cascade protein, C3, negatively correlated with MMSE, and positively correlated with H&Y, UPDRS part III, and total score. The UPR-regulating protein BiP (HSPA5) correlated negatively with MMSE, and positively with H&Y and UPDRS parts II, III, and total score. The ERAD-associated proteins, HSPAIL and adiponectin, were positively correlated with H&Y, and UPDRS parts II, III, and total score. SERPINs (SERPINA3, SERPINF2 and SERPING1) and hemopexin (HPX) correlated negatively with MMSE and positively with H&Y and UPDRS parts II, III, and total score. In general, the MMSE score was inversely correlated with H&Y stage and UPDRS scores. For detailed information, see Fig. 8 and Table 2 .

The correlation was performed using Spearman’s procedure, and the clustering method was set to average. The clustering metric was Euclidean. The heatmap is coloured by correlation coefficient where red represents positive and blue negative correlations. The proteins are represented by gene names. Detailed information about the protein correlations can be found in Supplementary Table 3 . De novo Parkinson’s disease ( n = 99) and healthy controls ( n = 36). MMSE mini-mental state examination, UPDRS unified Parkinson’s disease rating Scale. Source data are provided as a Source Data file.
Comparison of clinical outcomes and measurements in the longitudinal iRBD cohort-Independent replication cohort-phase II
The longitudinal expression in the iRBD samples was evaluated using linear mixed-effects models. Conditional growth models with random slopes and random intercepts between the individuals were constructed. After adjusting the p values for multiple testing by applying the Benjamini–Hochberg (BH) procedure with alpha = 0.05, we found that Butyrylcholinesterase (BCHE) was significantly decreased over the timepoints in the iRBD individuals ( p = 0.01). We next focused only on the iRBD samples with at least two timepoints and for which PD had consistently been predicted in the SVM model ( n = 90). This produced comparable results to the initial model with BCHE significantly related with time since baseline ( p = 0.01), but also TUBA4A was nominally significantly increased ( p = 0.04) although not passing the BH FDR threshold. The modelling also demonstrated that the clinical measurements H&Y ( p = 0.02), UPDRS I–III ( p = 0.02), and UPDRS I and III ( p = 0.03 and 0.03, respectively), were significantly related to the time since baseline in the iRBD group post multiple testing correction. PD non-motor symptoms, as measured on the PD NMS sum score, were strongly correlated with longitudinal motor progression ( p = 5E −8 ). Similarly, the questionnaire for quality of life PDQ-39’s mean values also correlated with longitudinal motor progression ( p = 0.005). From available routine blood values, cholesterol was associated with longitudinal timepoints ( p = 0.02). Details can be found in Supplementary Table 4 . Correlating the clinical measurements with the targeted proteomic data, we applied Spearman’s correlation and found that cholesterol was positively correlated with six of the identified proteins (Supplementary Table 5 ), including HSPA8, APOE and MASP2 ( p = 5E −9 , 0.0003 and 0.003, respectively). Also significantly correlated, but to a lesser degree and not passing the BH FDR threshold, were the PD NMS sum which correlated negatively with TUBA4A (p unadjusted = 0.01) and the PDQ-39 mean values, which correlated negatively with CST3 and PTGDS ( p unadjusted = 0.03 and 0.05, respectively).
PD has emerged as the world’s fastest-growing neurodegenerative disorder and currently affects close to 10 million people worldwide. Consequently, there is an urgent need for disease-modifying and prevention strategies 22 , 23 . The development of such strategies is hampered by two limitations: there are major gaps in our understanding of the earliest events in the molecular pathophysiology of PD, and we lack reliable and objective biomarkers and tests in easily accessible bio-fluids. We, therefore, need biomarkers that can identify PD earlier, preferably a significant time before an individual develops significant neuronal loss and disabling motor and/or cognitive disease. Such biomarkers would advance population-based screenings to identify individuals at risk and who could be included in upcoming prevention trials.
In the last years, CSF SAA emerged as the most specific indicator for NSD, in prodromal stages like iRBD, with an impressively high sensitivity and specificity of up to 74 and 93%, respectively, across various cohorts 9 , 24 . Despite the many questions surrounding SAA that need to be answered, including the ultimate understanding of its functionality, it is a true milestone for advancing prevention trials. It is, however, hampered by having only been shown to be robust in CSF and by the slow development and high variability of SAA in peripheral blood 25 , as well as by the lack of quantification capabilities. An easier and more accessible biofluid test would enable screening large population-based cohorts for at-risk status to develop an NSD. Therefore, the identification of additional biomarkers is needed, as is further knowledge of the biomarkers and pathways of the underlying pathophysiology (e.g. inflammation) during the earliest stage of NSD.
Other emerging multiplex technologies are increasingly used to identify individual proteomic biomarkers. However, these techniques are not true proteomic or ‘eyes open’ methods, as they rely on selected large panels of specific antibodies/and other (e.g. aptamer)-based assay technologies. These techniques, although useful, have not provided consistent results 3 , 26 . Proteomics using mass spectrometry measures all expressed proteins in an unbiased fashion as opposed to those selectively included in a panel that also includes variability due to cross-reactivity. Therefore, proteomic screening using mass spectrometry-based techniques is much more likely to identify pathways or biomarkers and provides more meaningful insights into the disease mechanisms involved in PD. We found a discrepancy between the detected markers during the discovery and the targeted phases. This is a known phenomenon in biomarker translation 27 that is also reflected in the low number of biomarkers having received FDA approval 28 . We addressed this by using previously reported successful improvement strategies in proteomic approaches, namely by refining our panel, reducing the number of markers, and increasing the sample size 29 . Furthermore, the validation of potential biomarkers was performed on a second and different type of mass spectrometer (triple quadrupole), which has the advantage of being available in all large hospitals.
Targeted MS has been previously applied in PD, including by the current authors, but the biological fluid used in the majority of studies is CSF 30 and not peripheral fluids such as blood. Here we demonstrate that even with a very low required volume of plasma/serum (10 µl) targeted proteomic is feasible.
The targeted proteomic assay presented here was developed from proteins identified in an unbiased discovery study, from our previous research, and from the literature. It included several inflammatory markers, Wnt-signalling members, and proteins indicative of protein misfolding. When analysing PD, OND, iRBD and HC in the targeted proteomic validation phase, we identified and confirmed 23 distinct and differentially expressed proteins between PD and HC. Our analysis moreover demonstrated that iRBD possesses a significantly different protein profile compared to HC, consisting of decreased levels of GRN and MASP2 and increased levels of the complement factor C3 and SERPINs (SERPINA3, SERPINF2 and SERPING1), thus indicating early involvement of inflammatory pathways in the initial pathophysiological steps of PD. Comparing these results to previous findings by our and other groups 8 , 31 highlights the link between these proteins and the pathways of complement activation, coagulation cascades, and Wnt-signalling.
By applying machine-learning models, we classified and separated de novo PD or control samples with 100% accuracy based on the expression of eight proteins (GRN, MASP2, HSPA5, PTGDS, ICAM1, C3, DKK3 and SERPING1).
With an independent validation, we added (a) a larger sample set and (b) longitudinal samples from the most interesting subgroup with 54 iRBD subjects and a total of 146 serum samples. We were able to validate our previous panel with a high prediction rate (79%) of these individuals as seen in PD in the targeted approach. Interestingly, the biomarker panel itself did not correlate with longitudinal expression but remained robust after the initial classification of iRBD. So far, 16 of the 54 iRBD subjects converted to PD/DLB (stage 3 NSD). Out of these samples, the SVM model predicted ten individuals with all their timepoints classified as PD, and of the 11 iRBD subjects who converted to PD/DLB, eight were identified as PD by the proteome analysis. Our panel, therefore, identified a PD-specific change in blood up to 7 years before the development of the stage 3 NSD.
The main shortcoming with many previously explored PD biomarkers is weak or no correlation with clinical progression data. So far, outcome measures in clinical trials are primarily based on motor progression, often by a clinical rating scale such as the UPDRS and/or wearable technologies. More objective biomarkers correlating with or reflecting the progression of the pathophysiology and clinical symptoms would be of the utmost importance. We, therefore, calculated correlations with clinical parameters and identified an association with multiple markers, including DKK3, PPP3CB and C3, indicating downregulation of Wnt-signalling pathways. Increased activity of the complement cascade correlated with higher scores in symptom severity (UPDRS part III and total score) and lower scores in cognitive performance (MMSE).
Protein (i.e. α-synuclein) misfolding is a well-known component of PD pathology and is believed to be the key factor behind Lewy body formation 32 . The transport of excessive amounts of misfolded proteins or increased folding cycles can induce ER stress. A cellular defence mechanism to alleviate ER stress is the unfolded protein response (UPR) reducing ER protein influx and increasing protein folding capacity 33 . The UPR is mainly activated by BiP-bound misfolded proteins 34 . The higher expressed markers HSPA5 (UPR-regulating protein BiP) and HSPA1L in our plasma samples of early PD indicate ER stress as a significant factor in the disease process and has been previously linked to PD in both mouse models and brain tissue studies 35 , 36 .
As mentioned by other groups and confirmed in our results, increasing evidence suggests inflammation is a specific feature in early PD. Complement activation has been associated with the formation of α-synuclein and Lewy bodies in PD and deposits of the complement factors iC3b and C9 have been found in Lewy bodies 37 . C3 is a central molecule in the complement cascade and was highly upregulated in blood in both PD and both independent iRBD sample sets analysed in this study. This upregulation in the earliest phase of motor PD (stage 3 NSD), and even in the prodromal phase (stage 2 NSD), clearly indicates inflammation as an early, if not the initial, event in PD neurodegeneration. Complement C3 levels correlated positively with indicators of motor dysfunction (H&Y stage and UPDRS)—indicating a direct connection between high plasma levels of inflammatory proteins and motor symptoms—and negatively with cognitive decline, here with the MMSE.
The protein Mannan-binding serine peptidase 2 (MASP2), an initiator of the lectin part of the complement cascade, was significantly downregulated in PD and iRBD. MASP1 and MASP2 proteins are inhibited by plasma protease C1 inhibitor SERPING1 in the lectin pathway, with SERPING1 modulating the complement cascade as it belongs to the SERPIN family of acute phase proteins 38 . In experimental PD mice models, increased SERPING1 levels are associated with dopaminergic cell death 39 . Acting as a serine/cysteine proteinase inhibitor, SERPING1 can increase serine levels, which could also affect αSyn phosphorylation. This can play a crucial role in PD pathology, as almost 90% of αSyn in Lewy bodies is phosphorylated on Serine129 40 , 41 . We identified increased SERPING1 plasma levels in both PD and iRBD in our analysis (compared to HC), thus contributing to conditions with increased αSyn phosphorylation, consecutive aggregation, Lewy body formation, and finally degeneration of dopaminergic neurons. Furthermore, we observed a strong correlation of SERPING1 plasma levels with UPDRS II, III and total score, as a direct measure of dopaminergic cell loss 39 .
Alpha-2-antiplasmin (SERPINF2) was also significantly upregulated in PD and iRBD. SERPINF2 is a major regulator of the clotting pathway, acting as an inhibitor of plasmin, a serine protease formed upon the proteolytic cleavage of its precursor, plasminogen, by tissue-type plasminogen activator (t-PA) or by the urokinase-type plasminogen activator (u-PA). Plasmin has been reported to cleave and degrade extracellular and aggregated αSyn 42 . Recently, we showed that activation of the plasminogen/plasmin system is decreased in PD, indicated by decreased plasma levels of uPA and its corresponding receptor uPAR, while t-PA was associated with faster disease progression 8 . The upregulation of SERPINF2 observed here is another indicator of decreased plasmin activity. Alpha-1-antichymotrypsin (SERPINA3), a third member of the SERPIN family, was also upregulated in the PD subjects. In the CNS, the primary source of SERPINA3 is astrocytes, where its expression is upregulated by various inflammatory receptor complexes 38 .
Overall, independent upregulation of these three members of the SERPIN (SERPING1, SERPINF2, SERPINA3) family is also indicative of increased inflammatory activity, combined with less activation of the plasmin system, and correlation with motor and non-motor symptom severity. In addition, a strong downregulation of progranulin ( GRN ) was detected, indicating a potential loss of neuroprotection and increased susceptibility to neuroinflammation. GRN may act as a neurotrophic factor, promoting neuronal survival and modulating lysosomal function. Loss-of-function mutations in the GRN gene are a cause of frontotemporal dementia and familial DLB. GRN gene variants are also known to increase the risk of developing Alzheimer’s disease (AD) and PD 43 . The main characteristics of neurodegeneration related to GRN are TDP43(-Transactive response DNA binding protein 43) inclusions, but Lewy body pathology is also very common. Loss of progranulin has further been linked to increased production of pro-inflammatory species such as tumour necrosis factor (TNF) and IL-6 in microglia 15 . A study in mice showed that Grn -/- mice had elevated levels of complement proteins, including C3, even before the onset of neurodegeneration 44 . Additionally, previous studies have found GRN downregulated in serum samples of advanced PD compared to AD and healthy individuals 45 .
As a possible compensatory reaction to the described increased inflammatory markers, the levels of Prostaglandin-H 2 d -isomerase (PTGDS)/Prostaglandin-D 2 synthase (PGDS2), better known as β-trace protein, were upregulated. PDGDS is an important brain enzyme producing prostaglandin D2 (PGD2), which has a neuroprotective and anti-inflammatory function. The upregulation reported here could be a reaction to the amount of neuronal cell loss, which is also seen in the significant correlation with the clinical motor and cognitive scales (see below). Furthermore, β-trace protein is a marker for CSF and is used to identify the fluid in clinical routine diagnostics, thus helping detect CSF leakage 46 . Increased plasma levels could be indicative of a disrupted blood–brain barrier (BBB), often discussed in PD pathology 47 and demonstrated in our cohorts.
Our study shows that the Wnt-related proteins DKK3 and PPP3CB are strongly downregulated in de novo PD. DKK3 is an activator of the canonical Wnt/β-catenin branch and PPP3CB is a component of the non-canonical Wnt/Ca 2+ signalling pathway. Wnts are secreted, cysteine-rich glycoproteins that act as ligands to locally stimulate receptor-mediated signal transduction of the Wnt-pathway 48 . Wnt-signalling is crucial for the development and maintenance of dopaminergic neurons 49 , shows protective effects on midbrain dopaminergic neurons 50 , and seems to be involved in the maintenance of the BBB 48 , 51 . Wnt-ligands and agonists trigger a “Wnt-On” stage, characterised by neuronal plasticity and protection, while the opposite “Wnt-Off” stage, potentially leading to neurodegeneration, triggered by the phosphorylation activity of glycogen synthetase kinase-3β (GSK-3beta) 50 , 52 . Wnt-inhibitors are separated into secreted Frizzled-related proteins (sFRP) and Dickkopf proteins (DKK). DKK1, DKK2 and DKK4 act as antagonists, while DKK3 is an agonist and activator 53 . Adult neurogenesis is primarily governed by canonical Wnt/β-catenin signaling 54 and downregulation of Wnt-signalling promotes dysfunction and/or death of dopaminergic neurons. Restoration of dopaminergic neurons was shown in mice where β-catenin was activated in situ 52 and neural stem cells transplanted to the substantia nigra of medically PD-induced mice induced re-expression of Wnt1 and repair dopaminergic neurons 55 . DKK3 and PPP3CB were strongly downregulated in de novo PD, removing an important line of defence against the detrimental loss of dopaminergic neurons. The downregulation of the Wnt-signalling pathways was further correlated with higher motor scores (UDPRS and H&Y stages).
Wnt-signalling in PD is not only promising as a potential biomarker. In oncology, drugs can modify Wnt-pathways, which is of interest to the PD field 56 . Some substances show no BBB-permeability. As a disrupted BBB seems to be apparent in PD, these drugs may be effective. Furthermore, these substances are also relevant for PD treatment: research points towards a peripheral starting point of PD and future therapies should be administered as early as possible 57 . These promising substances include DKK- as well as GSK inhibitors, but to date, no drugs targeting the Wnt-signalling pathways have been effectively tested in clinical trials, including in those with neurodegenerative diseases. Progress and clinical trials are urgently needed here.
The transfer of multi-omics analysis to clinically meaningful results that directly impact future drug trial planning and biomarker validation, depends fundamentally on correlating these results and altered pathway regulations with established clinical scores. The markers we analysed in our targeted mass spectrometry panel did not only show different expression patterns between HC, PD, and in both of our independent iRBD sample sets, but most of the markers also robustly correlated with important clinical scores (UPDRS and MMSE, see Table 1 ). Cognitive decline correlated negatively with the SERPINs and complement factor C3. The burden of motor and non-motor symptoms and overall symptom severity rated by UPDRS and its subscores correlated positively with the SERPINs, Complement C3, and negatively with DKK3, GRN, and SELE. So, increased inflammatory activity and downregulation of Wnt-signalling seem to strongly affect the clinical picture of PD subjects.
The iRBD subjects showed decreased levels of BCHE over time compared to controls. BCHE has been reported as decreased in serum samples of PD with cognitive impairment 58 . Validation of this easily assessable marker in serum is needed to evaluate its predictive potential.
While we did not find significant differences when we compared paired serum and plasma samples; the analysis of paired samples of plasma/serum and CSF only correlated weakly with the marker concentrations in these peripheral and central compartments. This discrepancy has been reported by several groups 20 , 21 . One reason is that mass spectrometry-based proteome analysis is always biased towards quantification and detection of the most abundant proteins in each sample matrix, and the total protein concentrations in human plasma/serum are more than two orders of magnitude higher than that in CSF. Further, the regulatory function of the blood–brain barrier seems to play a different role for different proteins, as some, like c-reactive protein, show a strong correlation between CSF and plasma, but most of the proteins do not. CSF and blood proteome show complex dynamics influenced by multiple and still mostly unknown factors. The protein shift in samples with a known BBB dysfunction (determined by the CSF/serum albumin index or the CSF/plasma ratio) can not be determined for individual proteins nor the dysfunction be localised by mass spectrometry 20 .
Our model could not correctly predict phenoconversion in all cases. The reasons for this can be varied: The proteome pattern changes over time and the period between sampling and phenconversion may play a role. The three PD phenoconverters that were not predicted as PD neither differ clinically or demographically from the phenoconverters, nor from the non-phenoconverters. iRBD diagnosis in our study was confirmed by vPSG, supported by a high percentage of additional measurements including hyposmia and CSF SAA positivity. Therefore, even those iRBD cases that do not show the PD-proteome pattern still have a high-risk constellation of converting to PD/DLB on three different levels (PSG, olfaction, and SAA). Continuing further longitudinal follow-up of these subjects will elucidate our understanding of when and potentially why conversion occurs/does not occur. It is known that around 80% of iRBD subjects develop NSD, i.e. PD/DLB, with a rate of 6% per year, as shown in a multicenter cohort including ours 59 . To a lesser extent, iRBD subjects develop the intracytoplasmic glial α-synuclein aggregation disorder Multiple Systems Atrophy (MSA) 59 , 60 . Although RBD is common in MSA (summary prevalence of 73% 61 ), none of our iRBD subjects have, as yet converted to MSA. Recruiting and following large longitudinal at-risk cohorts is, therefore, very important and future studies will not only identify biomarkers for phenoconversion from stage 1 or 2 to eventually stage 3 NSD or MSA, but also identify the many possible factors of resilience (including genetics, etc.) of NON-conversion which will be as, if not more important than identifying indicators for phenoconversion. Both direction progression biomarkers from stage 1 and 2 cohorts will have tremendous implications for future neuroprevention trials as phenoconversion itself is (due to the low annual rate) unlikely to be an outcome measure.
A significant strength of our biomarker discovery to translation pipeline is that it allows for the developed test to be easily validated and translated to any clinical laboratory equipped with a tandem LC-MS instrument. One advantage of using triple quadrupole platforms is that additional and better biomarkers can easily be augmented into the test described in this manuscript. Thus, any test could be refined and optimised over time with very little modification to the assay as additional biomarkers are discovered. Clinical testing for neurological disorders is limited to the use of a selected few well-characterised individual markers and translating biomarkers to eventual clinical application is notoriously challenging. The power of using multiplexed biomarker technologies with machine learning enables biomarkers to be evaluated in context with other markers of pathological events, thereby creating a ‘disease profile’ as opposed to individual markers. This approach opens the biomarker discovery field for many disorders and increases the specificity and sensitivity of testing, as demonstrated in this study. The combination of multiplexed analysis of biomarker panels analysed on triple quadrupole platforms can advance biomarker translation to clinical application; this mass spectral technology is already embedded in many clinical diagnostics labs for routine small molecule analyses.
Our peripheral blood protein pattern for PD helps not only to classify but also to predict the earliest stage of the disease. We find differently expressed proteins in pre-motor iRBD and early motor stages of the disease compared to HC. Multiple markers also correlated with the progression of motor and non-motors symptoms. Thus, our blood panel can also identify subjects at risk (stage 2) to develop PD up to 7 years before advancing to motor stage 3. Next steps will be the independent validation in other (and even earlier) non-motor cohorts, e.g. in subjects with hyposmia also at-risk for PD 62 and in our population-based Healthy Brain Ageing cohort in Kassel 63 . It would further be interesting to evaluate the predictive potential of these identified markers with continuing clinical follow-up and together with other established PD progression markers like serum neurofilament light chain 5 and dopamine transporter imaging in a longitudinal analysis.
Our work was predominantly focused on the similarities between PD and iRBD. The authors are unaware of any study that has analysed longitudinally collected samples and prodromal cohorts, including iRBD and phenoconverters. Future work would include (i) validation of our findings in independent cohorts consisting of iRBD and other at-risk subjects for the synuclein aggregation disorders in neurons (PD, DLB) and oligodendrocytes (MSA), (ii) refinement of the panels of biomarkers developed in this study including sensitivity and technical performance, (iii) and using the pipeline described in this manuscript, the identification and validation of additional biomarkers that could distinguish between the different clinical syndromes with the ultimate goal of identifying progression biomarkers as outcome measures for prevention trials.
In summary, instead of single biomarkers, in a univariate approach, we have created a pipeline using a targeted proteomic test of a multiplexed panel of proteins, together with machine learning. This powerful combination of multiple well-selected biomarkers with state-of-the-art machine-learning bioinformatics, allowed us to use a panel of eight biomarkers that could distinguish early PD from HC. This biomarker panel provided a distinct signature of protective and detrimental mechanisms, finally triggering oxidative stress and neuroinflammation, leading to α-synuclein aggregation and LB formation. Moreover, this signature was already present in the prodromal non-motor (stage 2 NSD), up to 7 years before the development of motor/cognitive symptoms (stage 3), supporting the high specificity of iRBD and its high conversion rate to PD/DLB 18 . Most importantly, this blood panel can, in the future, upon further validation help identify subjects at risk of developing PD/DLB and stratify them for upcoming prevention trials.
Patient cohorts and sample collection and processing
Our research complies with all relevant ethical regulations. Institutional review board statements were obtained from the University Medical Centre in Goettingen, Germany, Approval No. 9/7/04 and 36/7/02. The study was conducted according to the Declaration of Helsinki, and all participants gave written informed consent. All plasma, serum and CSF samples from subjects were selected from known cohorts using identical sample processing protocols designed by the Movement Disorder Center Paracelsus-Elena-Clinic.
Patients with de novo PD were diagnosed according to the UK Brain Bank Criteria, without PD-specific medication. Diagnosis in all subjects was supported by (1) a positive (i.e. >30% improvement of UPDRS III after 250 mg of levodopa) acute levodopa challenge testing 64 in all PD subjects, (2) hyposmia by smell identification test (Sniffin Sticks 65 ) in all PD subjects and (3) 1.5-tesla Magnetic Resonance Imaging (MRI) without significant abnormalities or evidence for other diseases in all but three subjects who were excluded (due to significant vascular lesions or evidence for hydrocephalus) from the analysis. Participants not fulfilling the above criteria and meeting criteria for other neurological disorders were named as other neurological disorders (OND). OND consists of subjects with vascular parkinsonism ( n = 10), essential tremor ( n = 7), progressive supranuclear palsy; PSP ( n = 7), multiple system atrophy; MSA ( n = 3), corticobasal syndrome; CBS ( n = 2), DLB ( n = 2), drug-induced tremor ( n = 2), dystonic tremor ( n = 2), restless legs syndrome ( n = 1), hemifacial spasm ( n = 1), motoneuron disease ( n = 1), amyotrophic shoulder neuralgia ( n = 1), and Alzheimer’s disease ( n = 1). The initial exploratory cohort consisted of ten PD subjects (8 men, mean age 67.1 ± 10.6) and ten healthy controls (5 men, mean age 65,7, SD ± 8,6.). For details, see Supplementary Table 3 ). The validation cohort included 99 PD subjects (49 men, mean age 66,1, SD ± 10,8), 36 healthy controls (20 men, mean age 63.7, SD ± 6,5.) and the described (see above) 41 OND subjects (29 men, mean age 70, SD ± 8.9. For details, see Supplementary Table 1 . The prodromal validation cohort consisted of 54 patients with iRBD (27 men, mean age 67.5, SD ± 8.1, for details, see Supplementary Table 4 ). RBD was diagnosed with two nights of state-of-the-art vPSG. Samples from HC were selected from the DeNoPa cohort 10 and matched for age and sex with the PD patients, had to be between 40 and 85 years old, without any active known/treated CNS condition, and with a negative family history of idiopathic PD. Antipsychotic drugs were an exclusion criterion. The provided data for sex are based on self-report.
The paired sample analysis of CSF, plasma and serum was applied in samples from subjects with OND 7 men, mean age 74 years, SD ± 7; diagnosis: four Alzheimer’s disease, three vascular Parkinsonism, one essential tremor, one multiple system atrophy one progressive supranuclear palsy).
Clinical assessments included the UPDRS subscores (parts I–III), the sum (UPDRS total score), and cognitive screening using the MMSE 10 .
Plasma and serum samples for both cohorts were collected in the morning under fasting conditions using Monovette tubes (Sarstedt, Nümbrecht, Germany) for EDTA plasma and serum collection by venipuncture. Tubes were centrifuged at 2500× g at room temperature (20 °C) for 10 min and aliquoted and frozen within 30 min of collection at −80 °C until analysis 10 , 66 . Single- use aliquots were used for all analyses presented here. For further details, we refer to the following publication 67 .
CSF was collected in polypropylene tubes (Sarstedt, Nümbrecht, Germany) directly after the plasma collection by lumbar puncture in the sitting position. Tubes were centrifuged at 2500× g at room temperature (20 °C) for 10 min and aliquoted and frozen within 30 min after collection at −80 °C until analysis. Before centrifugation, white and red blood cell counts in CSF were determined manually 10 , 66 . CSF β-amyloid 1–42, total tau protein (t-tau), phosphorylated tau protein (p-tau181) and neurofilament light chains (NFL) concentrations were measured by board-certified laboratory technicians, who were blinded to clinical data, using commercially available INNOTEST ELISA kits for the tau and Aβ markers (Fujirebio Europe, Ghent, Belgium) and the UmanDiagnostics NF-light® assay (UmanDiagnostics, Umeå, Sweden) for NFL. Total protein and albumin levels were measured by nephelometry (Dade Behring/Siemens Healthcare Diagnostics) 66 .
For the α-synuclein seeding aggregation assay (αSyn-SAA) the CSF samples were blindly analyzed in triplicate (40 μL/well) in a reaction mixture (0.3 mg/mL recombinant α-Syn (Amprion [California, USA]; catalogue number S2020), 100 mM piperazine- N , N ′-bis(2-ethanesulfonic acid) (PIPES) pH 6.50, 500 mM sodium chloride, 10 μM thioflavin T, and one bovine serum albumin (BSA)–blocked 2.4-mm silicon nitride G3 bead (Tsubaki-Nakashima [Georgia, USA]). Beads were blocked in 1% BSA 100 mM PIPES pH 6.50 and washed with 100 mM PIPES pH 6.50. The assay was performed in 96-well plates (Costar [New York, USA], catalogue number 3916) using a FLUOstar Omega fluorometer (BMG [Ortenberg, Germany]). Plates were orbitally shaken (800 rpm for 1 min every 29 min at 37 °C). Results from the triplicates were considered input for a three-output probabilistic algorithm with sample labelling as “positive,” “negative,” or “inconclusive”, based on the parameters: Maximum fluorescence (Fmax), time to reach 50% Fmax (T50), slope, and the coefficient of determination for the fitting were calculated for each replicate using a sigmoidal equation available in Mars data analysis software (BMG). The time to reach the 5000 relative fluorescence units (RFU) threshold (TTT) was calculated with a user-defined equation in Mars 19 .
Discovery plasma proteomics (phase 0)
In the mass spectrometry-based proteomic discovery analysis of plasma, we depleted the control and de novo PD samples from the twelve most abundant plasma proteins using Pierce Top12 columns (Thermo Fisher Scientific, Waltham, MA, USA) according to the manufacturer’s instructions. The depleted samples were freeze-dried before the addition of 20 µL of lysis buffer (100 mM Tris pH 7.8, 6 M urea, 2 M thiourea, and 2% ASB-14). The samples were shaken on an orbital shaker for 60 min at 1500 rpm. To break disulphide bonds, 45 µg DTE was added, and the samples were incubated for 60 min. To prevent disulphide bonds from reforming, 108 µg IAA was added, and the samples were incubated for 45 min covered in light. About 165 µL MilliQ water was added to dilute the concentration of urea and 1 µg trypsin gold (Promega, Mannheim, Germany) was added before 16 h of incubation at +37 °C to digest the proteins into peptides. To purify the peptides, solid phase extraction was performed using 100 mg C18 cartridges (Biotage, Uppsala, Sweden). The cartridges were washed with two 1 mL aliquots of 60% ACN, and 0.1% TFA before equilibration by two 1 mL aliquots of 0.1% TFA. The concentration of TFA in the samples was adjusted to 0.1%. The samples were loaded, and the flow-through was captured and re-applied. Salts were washed away from the bound peptides by two 1 mL aliquots of 0.1% TFA. The peptides were eluted by two 250 µL aliquots of 60% ACN, and 0.1% TFA. Solvents were evaporated using a vacuum concentrator. The samples were re-suspended in 50 µL 3% ACN, 0.1% FA prior to analysis. About 4 µL was injected into a 2D-NanoAquity liquid chromatography system (Waters, Manchester, UK). All samples were fractionated online into ten fractions over 12 h. The mobile phase in the first chromatographic system consisted of A1: 10 mM ammonium hydroxide titrated to pH 9 and B1: acetonitrile. The second chromatographic system’s mobile phase was A2: 5% dimethylsulfoxide (DMSO) + 0.1% formic acid, B2: acetonitrile with 5% DMSO + 0.1% formic acid. 2D-liquid chromatography fractionation was performed by loading the sample onto a 300 µm × 50 mm, 5 µm Peptide BEH C18 column (Waters). The peptides were eluted from the first column at a flow rate of 2 µL/min. The initial condition of the gradient elution was 3% B, held over 0.5 minutes before linearly increasing the proportion of organic solvent B, fraction per fraction over 0.5 min. The conditions thereafter remained static for 4 min before returning to the initial conditions over 0.5 min and equilibration prior to the next elution for 10 min. The eluted peptides from the first-dimensional column were loaded into a 180 µm × 20 mm, 5 µm Symmetry C18 trap column (Waters) before entering the analytical column, a 75 µm × 150 mm, 1.7 µm Peptide BEH C18 (Waters). The column temperature was +45 °C. The gradient elution applied to the analytical column started at 3% B and was linearly increased to 40% B over 40 min after which it was increased to 85% B over 2 min and washed for 2 min before returning to initial conditions over 2 min followed by equilibration for 15 min before the subsequent injection. The eluted peptides were detected using a Synapt-G2-S i (Waters) equipped with a nano-electrospray ion source. Data were acquired in positive MS E mode from 0 to 60 min within the m/z range 50−2000. The capillary voltage was set to 3 kV and the source temperature to +100 °C. The desolvation gas consisted of nitrogen with a flow rate of 50 L/h, and the desolvation temperature was set to +200 °C. The purge and desolvation gas consisted of nitrogen, operated at a flow rate of 600 mL/h and 600 L/h, respectively. The gas in the IMS cell was helium, with a flow rate of 90 mL/h. The low energy acquisition was performed by applying a constant collision energy of 4 V with a 1-s scan time. High energy acquisition was performed by applying a collision energy ramp, from 15 to 40 V, and the scan time was 1 s. The lock mass consisted of 500 fmol/µL [glu1]-fibrinopeptide B, continuously infused at a flow rate of 0.3 µL/min and acquired every 30 s. The doubly charged precursor ion, m/z 785.8426, was utilised for mass correction. After acquisition, data were imported to Progenesis QI for proteomics (Waters), and the individual fractions were processed before all results were merged into one experiment. The Ion Accounting workflow was utilised, with UniProt Canonical Human Proteome as a database (build 2016). The digestion enzyme was set as trypsin. Carbamidomethyl on cysteines was set as a fixed modification; deamidation of glutamine and asparagine, and oxidation of tryptophan and pyrrolidone carboxylic acid on the N-terminus were set as variable modifications. The identification tolerance was restricted to at least two fragments per peptide, three fragments per protein, and one peptide per protein. A FDR of 4% or less was accepted. The resulting identifications and intensities were exported and variables with a confidence score less than 15 and only one unique peptide were filtered out.
Targeted plasma proteomics (phase I)
The peptides included in the targeted assay were selected from several proteomic screening studies in which we analysed plasma, serum, urine, and CSF in ageing, PD and AD. The analytical method is described by ref. 17 . Furthermore, due to the suggested involvement of inflammation in neurodegenerative diseases, several known pro- and anti-inflammatory proteins identified from the literature were included in the multiplexed assay. The final panel consisted of 121 proteins (Supplementary Table 2 ), out of which a number were measured with two peptides, leading to a total of 167 unique peptides. When possible, the peptides were chosen to have an amino acid sequence length between 7 and 20. The amino acid sequences were confirmed to be unique to the proteins by using the Basic Local Alignment Search Tool (BLAST) provided by UniProt 68 . Synthetic peptide standards were purchased from GenScript (Amsterdam, Netherlands). To establish the most optimal transitions, repeated injections of 1 pmol peptide standard onto a Waters Acquity ultra-performance liquid chromatography (UPLC) system coupled to a Waters Xevo-TQ-S triple quadrupole MS were performed. The most high-abundant precursor-to-product ion transitions and their optimal collision energies were determined manually or using Skyline 69 . Detection was performed in positive ESI mode. The capillary voltage was set to 2.8 kV, the source temperature to 150 °C, the desolvation temperature to 600 °C, and the cone gas and desolvation gas flows to 150 and 1000 L/h, respectively. The collision gas consisted of nitrogen and was set to 0.15 mL/min. The nebuliser operated at 7 bar. Two transitions were chosen, one quantifier for relative concentration determination and one qualifier for identification, totally rendering 334 analyte transitions. Cone and collision energies varied depending on the optimal settings for each peptide. Each peptide was measured with a minimum of 12 points per peak and a dwell time of 10 ms or more to ensure adequate data acquisition. The optimised transitions were distributed over two multiple reaction monitoring (MRM) methods, always keeping the quantifier and qualifier for each peptide in the same MRM segment. Plasma, serum, and CSF samples were depleted from albumin and IgG using Pierce Top2 cartridges (Thermo Fisher Scientific, Waltham, MA, USA) following the manufacturer’s instructions. About 150 µg whole protein yeast enolase (ENO1) was added to the cartridges as an internal standard to account for digestion efficiency. Digestion was performed as described above. Solid phase extraction was carried out on BondElute 100 mg C18 96-well plates (Agilent, Santa Clara, USA) using the same methodology as in the preparation of untargeted proteomic analyses. Quality control samples were prepared from acetone-precipitated plasma, digested and solid phase extracted. Calibration curves ranging from 0 to 1 pmol/μL were constructed in blank and matrix by spiking increasing amounts of peptides into blank and QC samples. Before analysis, the samples were reconstituted in 30 µL 3% ACN, 0.1% FA containing 0.1 μM heavy isotope labelled peptides from the following proteins (annotated by gene name): ALDOA, C3, GSTO1, RSU1 and TSP1. About 5 µL were injected. The peptides were separated and detected on an Acquity UPLC system coupled to a Xevo-TQ-S triple quadrupole mass spectrometer (Waters, Manchester, UK). Chromatographic separation of the peptides was performed using a 1 × 100 mm, 1.7 μm ACQUITY UPLC Peptide CSH C18 column (Waters).
The mobile phase consisted of A: 0.1% formic acid and B: 0.1% formic acid in acetonitrile pumped at a flow rate of 0.2 mL/min. The column temperature was set to +55 °C. The initial mobile phase composition was 3% B, which was kept static for 0.8 min before initialising the linear gradient, running for 7.6 min to 25% B, eluting most of the peptides. B was thereafter linearly increased to 80% over 0.5 min and held for 1.9 min, eluting the most apolar peptides and washing the column before returning to the initial conditions over 0.1 minutes followed by equilibration for 6 min prior to the subsequent injection. Two subsequent injections of each sample were performed, each paired with one of the two MRM acquisition methods.
After acquisition, peak-picking and integration were performed using TargetLynx (version 4.1, Waters) or an in-house application ('mrmIntegrate') written in Python (version 3.8). mrmIntegrate is publicly available to download via the GitHub repository https://github.com/jchallqvist/mrmIntegrate . The application takes text files as input (.raw files are transformed into text files through the application 'MSConvert' from ProteoWizard 70 and applies a LOWESS filter over five points of the chromatogram. The integration method to produce areas under the curve is trapezoidal integration. The application enables retention time alignment and simultaneous integration of the same transition for all samples. Peptide peaks were identified by the blank and matrix calibration curves. The integrated peak areas were exported to Microsoft Excel, where first, the ratio between quantifier and qualifier peak areas were evaluated to ensure that the correct peaks had been integrated. The digestion efficiency was evaluated by monitoring the presence of baker’s yeast ENO1 in the samples, all samples without a signal were excluded from further analysis. After the initial quality assessment, the quantifier area was divided by the area of one of the internal standards, ALDOA or GSTO1 to yield a ratio used for the determination of relative concentrations. Any compound that also showed an intensity signal in the blank samples had the blank signal subtracted from the analyte peak intensity. Pooled plasma quality control samples were additionally evaluated to assess the robustness of the run.
Refined LC-MS/MS method (phase II)
The rapid and refined targeted proteomics LC-MS/MS method contained only peptides from the 31 proteins observed in the original targeted proteomics method (121 proteins). We utilised a Waters Acquity (UPLC) system coupled to a Waters Xevo-TQ-XS triple quadrupole operating in positive ESI mode. The column was an ACQUITY Premier Peptide BEH C18, 300 Å, 1.7 µm, maintained at 40 °C. The mobile phase was A: 0.1% formic acid in water, and B: 0.1% formic acid in acetonitrile. The gradient elution profile was initiated with 5% B and held for 0.25 min before linearly increasing to 40% B over 9.75 min to elute and separate the peptides. The column was washed for 1.6 min with 85% B before returning to the initial conditions and equilibrating for 0.4 min. The flow rate was 0.6 mL/min. The settings of the mass spectrometer and the peak-picking method were the same as described in the prior section. Baker’s yeast ENO1 was utilised to monitor digestion efficiency and as an internal standard.
Statistical methods
Most of the statistical analyses were performed in Python (version 3.8.5). The untargeted and targeted datasets were inspected for outliers and instrumental drift using principal component analysis (PCA) and orthogonal projection to latent variables (OPLS) in SIMCA, version 17 (Umetrics Sartorius Stedim, Umeå, Sweden). Outliers exceeding ten median deviations from each variable’s median were excluded. Instrumental drift was corrected by applying a non-parametric LOWESS filter from statsmodels (version 0.14.0) using 0.5 fractions of the data to estimate the LOWESS curve 71 . The data were evaluated for normal distribution using D’Agostino and Pearson’s method from SciPy (version 1.9.3) 72 . The non-normally distributed variables in the untargeted data were transformed to normality by the Box-Cox procedure using the SciPy function 'boxcox'. Significance testing between the independent groups of HC and PD/OND/iRBD individuals was performed by Student’s two-tailed t -test for the untargeted proteomic data and by Mann–Whitney’s non-parametric U -test (SciPy) for the targeted data. Due to the limited sample numbers, no multiple testing correction was performed in the untargeted data. In the targeted data, the Benjamini–Hochberg multiple testing correction procedure (statsmodels) was applied with an accepted false discovery rate of 5%. Fold-changes were calculated by dividing the means of the affected groups by the control group. Correlation analyses in the targeted data were performed by Spearman’s correlation (SciPy) and the correlation p values were adjusted variable-wise by the Benjamini–Hochberg procedure (FDR = 5%).
We implemented a support vector classifier model to discriminate between PD and HC and to predict new samples. The data were first z-scored protein-wise and any 'not a number'-values were replaced by the median. We used the 'LinearSVC' method from SciKit Learn and applied cross-validated recursive feature elimination to determine the number of variables to use in the model. The most discriminating variables for distinguishing between controls and PD were thereafter chosen by recursive feature elimination 73 . Feature selection and model training were performed on 70% of the data, partitioned using the SciKit Learn function “train_test_split”, and cross-validation was performed using a stratified k-fold with five splits. The remaining 30% of the data were predicted in the model. PR and ROC curves were constructed from the test data and consisted of each predictor and from the combined predictors, the packages precision_recall_curve and roc_curve from SciKit Learn were implemented. Linear mixed models were performed using the R-to-Python bridge software pymer4 (version 0.8.0), where individual was set as a random effect and the correlations between the MS measured proteins and clinical variables were evaluated for significance post Benjamini–Hochberg’s procedure for multiple testing correction. Plots of the data were constructed using the Seaborn and Matplotlib packages (versions 0.12.2 and 3.6.0, respectively) 74 .
All multivariate analyses were performed in SIMCA, version 17. OPLS and OPLS-discriminant analysis (OPLS-DA) models were evaluated for significance by ANOVA p values and by permutation tests applying 1000 permutations, where p < 0.05 and p < 0.001 were deemed significant, respectively.
Data were analysed for pathway enrichment using IPA (QIAGEN Inc. Data were analysed for pathway enrichment using IPA (QIAGEN Inc., https://digitalinsights.qiagen.com/products-overview/discovery-insights-portfolio/analysis-and-visualization/qiagen-ipa/ .). Input variables were set to proteins demonstrating a significant difference between PD individuals and HC, with fold-change as expression observation. The accepted output pathways were restricted to p < 0.05 and at least two proteins were included in the pathways. Gene Ontology (GO) annotations were extracted using DAVID Bioinformatics Resources (2021 build) 75 , 76 . Networks were built in Cytoscape 77 (version 3.8.0) by applying the “Organic layout” from yFiles 77 .
Obtaining biological materials
Patient samples can be provided to other researchers for certain projects after contact with the corresponding authors and upon availability approval of the team in Kassel, Germany.
Reporting summary
Further information on research design is available in the Nature Portfolio Reporting Summary linked to this article.
Data availability
The chromatograms from the targeted mass spectrometric data generated in this study have been deposited in the ProteomeXchange database under accession code PXD041419 and in the Panorama repository ( https://panoramaweb.org/DNP_Pub.url , https://doi.org/10.6069/p9cy-h335 ). The integrated targeted mass spectrometric data generated in this study are provided in the Supplementary Information. Source data for all data presented in graphs within the figures are provided in a source data file. Source data are provided with this paper.
Code availability
Peak-picking and integrations were performed in TargetLynx (part of the MassLynx suite, version 4.1), or using an in-house application written in Python which can be found on GitHub ( https://github.com/jchallqvist/mrmIntegrate ). The data visualisation and statistical analyses were performed in Python (version 3.8.5) using the packages SciPy (version 1.9.3), statsmodels (version 0.14.0), SciKit Learn (version 1.1.2), Seaborn (version 13.0) and Matplotlib (version 3.6.0). The code used can be found on GitHub ( https://github.com/jchallqvist/DNP_Pub/blob/main/DNP_Code , https://doi.org/10.5281/zenodo.11130369 ).
Simuni, T. et al. Baseline prevalence and longitudinal evolution of non-motor symptoms in early Parkinson’s disease: the PPMI cohort. J. Neurol. Neurosurg. Psychiatry 89 , 78–88 (2018).
Article PubMed Google Scholar
Michell, A. W., Lewis, S. J., Foltynie, T. & Barker, R. A. Biomarkers and Parkinson’s disease. Brain 127 , 1693–1705 (2004).
Article CAS PubMed Google Scholar
Kieburtz, K., Katz, R., McGarry, A. & Olanow, C. W. A new approach to the development of disease-modifying therapies for PD; fighting another pandemic. Mov. Disord. 36 , 59–63 (2021).
Shahnawaz, M. et al. Development of a biochemical diagnosis of Parkinson disease by detection of α-synuclein misfolded aggregates in cerebrospinal fluid. JAMA Neurol. 74 , 163–172, (2017).
Mollenhauer, B. et al. Validation of serum neurofilament light chain as a biomarker of Parkinson’s disease progression. Mov. Disord . https://doi.org/10.1002/mds.28206 (2020).
Lindestam Arlehamn, C. S. et al. α-Synuclein-specific T cell reactivity is associated with preclinical and early Parkinson’s disease. Nat. Commun. 11 , 1875 (2020).
Article ADS CAS PubMed PubMed Central Google Scholar
Mollenhauer, B. et al. Baseline predictors for progression 4 years after Parkinson’s disease diagnosis in the De Novo Parkinson Cohort (DeNoPa). Mov. Disord. 34 , 67–77 (2019).
Bartl, M. et al. Blood markers of inflammation, neurodegeneration, and cardiovascular risk in early Parkinson’s disease. Mov. Disord . https://doi.org/10.1002/mds.29257 (2022).
Simuni, T. et al. A biological definition of neuronal α-synuclein disease: towards an integrated staging system for research. Lancet Neurol. 23 , 178–190 (2024).
Mollenhauer, B. et al. Nonmotor and diagnostic findings in subjects with de novo Parkinson disease of the DeNoPa cohort. Neurology 81 , 1226–1234 (2013).
Hällqvist, J. et al. A multiplexed urinary biomarker panel has potential for Alzheimer’s disease diagnosis using targeted proteomics and machine learning. Int. J. Mol. Sci . https://doi.org/10.3390/ijms241813758 (2023).
Hu, W., Ralay Ranaivo, H., Craft, J. M., Van Eldik, L. J. & Watterson, D. M. Validation of the neuroinflammation cycle as a drug discovery target using integrative chemical biology and lead compound development with an Alzheimer’s disease-related mouse model. Curr. Alzheimer Res. 2 , 197–205 (2005).
Notter, T. et al. Translational evaluation of translocator protein as a marker of neuroinflammation in schizophrenia. Mol. Psychiatry 23 , 323–334 (2018).
Jonsson, M., Gerdle, B., Ghafouri, B. & Backryd, E. The inflammatory profile of cerebrospinal fluid, plasma, and saliva from patients with severe neuropathic pain and healthy controls-a pilot study. BMC Neurosci. 22 , 6 (2021).
Article PubMed PubMed Central Google Scholar
Chen, X. et al. Progranulin does not bind tumor necrosis factor (TNF) receptors and is not a direct regulator of TNF-dependent signaling or bioactivity in immune or neuronal cells. J. Neurosci. 33 , 9202–9213 (2013).
Article CAS PubMed PubMed Central Google Scholar
Captur, G. et al. Plasma proteomic signature predicts who will get persistent symptoms following SARS-CoV-2 infection. EBioMedicine 85 , 104293 (2022).
Doykov, I. et al. The long tail of Covid-19’ - The detection of a prolonged inflammatory response after a SARS-CoV-2 infection in asymptomatic and mildly affected patients. F1000Res 9 , 1349 (2020).
Hu, M. T. REM sleep behavior disorder (RBD). Neurobiol. Dis. 143 , 104996 (2020).
Concha-Marambio, L. et al. Accurate detection of α-synuclein seeds in cerebrospinal fluid from isolated rapid eye movement sleep behavior disorder and patients with Parkinson’s disease in the de novo Parkinson (DeNoPa) cohort. Mov. Disord. 38 , 567–578 (2023).
Dayon, L. et al. Proteomes of paired human cerebrospinal fluid and plasma: relation to blood-brain barrier permeability in older adults. J. Proteome Res. 18 , 1162–1174 (2019).
Whelan, C. D. et al. Multiplex proteomics identifies novel CSF and plasma biomarkers of early Alzheimer’s disease. Acta Neuropathol. Commun. 7 , 169 (2019).
Bloem, B. R., Okun, M. S. & Klein, C. Parkinson’s disease. Lancet 397 , 2284–2303 (2021).
Dorsey, E. R., Sherer, T., Okun, M. S. & Bloem, B. R. The emerging evidence of the Parkinson pandemic. J. Parkinsons Dis. 8 , S3–s8 (2018).
Grossauer, A. et al. α-Synuclein seed amplification assays in the diagnosis of synucleinopathies using cerebrospinal fluid-A systematic review and meta-analysis. Mov. Disord. Clin. Pr. 10 , 737–747 (2023).
Article Google Scholar
Okuzumi, A. et al. Propagative α-synuclein seeds as serum biomarkers for synucleinopathies. Nat. Med. 29 , 1448–1455 (2023).
Raffield, L. M. et al. Comparison of proteomic assessment methods in multiple cohort studies. Proteomics 20 , e1900278 (2020).
Hernández, B., Parnell, A. & Pennington, S. R. Why have so few proteomic biomarkers “survived” validation? (Sample size and independent validation considerations). Proteomics 14 , 1587–1592 (2014).
Füzéry, A. K., Levin, J., Chan, M. M. & Chan, D. W. Translation of proteomic biomarkers into FDA approved cancer diagnostics: issues and challenges. Clin. Proteom. 10 , 13 (2013).
Bader, J. M., Albrecht, V. & Mann, M. MS-based proteomics of body fluids: the end of the beginning. Mol. Cell Proteom. 22 , 100577 (2023).
Article CAS Google Scholar
Pan, C. et al. Targeted discovery and validation of plasma biomarkers of Parkinson’s disease. J. Proteome Res. 13 , 4535–4545 (2014).
Qin, X. Y., Zhang, S. P., Cao, C., Loh, Y. P. & Cheng, Y. Aberrations in peripheral inflammatory cytokine levels in Parkinson disease: a systematic review and meta-analysis. JAMA Neurol. 73 , 1316–1324, (2016).
Choi, M. L. & Gandhi, S. Crucial role of protein oligomerization in the pathogenesis of Alzheimer’s and Parkinson’s diseases. FEBS J. 285 , 3631–3644 (2018).
Walter, P. & Ron, D. The unfolded protein response: from stress pathway to homeostatic regulation. Science 334 , 1081–1086 (2011).
Article ADS CAS PubMed Google Scholar
Bertolotti, A., Zhang, Y. H., Hendershot, L. M., Harding, H. P. & Ron, D. Dynamic interaction of BiP and ER stress transducers in the unfolded-protein response. Nat. Cell Biol. 2 , 326–332 (2000).
Colla, E. Linking the endoplasmic reticulum to Parkinson’s disease and alpha-synucleinopathy. Front. Neurosci. 13 , 560 (2019).
Mercado, G., Castillo, V., Soto, P. & Sidhu, A. ER stress and Parkinson’s disease: pathological inputs that converge into the secretory pathway. Brain Res. 1648 , 626–632 (2016).
Loeffler, D. A., Camp, D. M. & Conant, S. B. Complement activation in the Parkinson’s disease substantia nigra: an immunocytochemical study. J. Neuroinflamm 3 , 29 (2006).
Zattoni, M. et al. Serpin signatures in Prion and Alzheimer’s diseases. Mol. Neurobiol. 59 , 3778–3799 (2022).
Seo, M. H. & Yeo, S. Association of increase in Serping1 level with dopaminergic cell reduction in an MPTP-induced Parkinson’s disease mouse model. Brain Res. Bull. 162 , 67–72 (2020).
Anderson, J. P. et al. Phosphorylation of Ser-129 is the dominant pathological modification of alpha-synuclein in familial and sporadic Lewy body disease. J. Biol. Chem. 281 , 29739–29752 (2006).
Fujiwara, H. et al. alpha-Synuclein is phosphorylated in synucleinopathy lesions. Nat. Cell Biol. 4 , 160–164 (2002).
Kim, K. S. et al. Proteolytic cleavage of extracellular alpha-synuclein by plasmin implications for Parkinson disease. J. Biol. Chem. 287 , 24862–24872 (2012).
Reho, P. et al. GRN mutations are associated with Lewy body dementia. Mov. Disord. 37 , 1943–1948 (2022).
Kao, A. W., Mckay, A., Singh, P. P., Brunet, A. & Huang, E. J. Progranulin, lysosomal regulation and neurodegenerative disease. Nat. Rev. Neurosci. 18 , 325–333 (2017).
Mateo, I. et al. Reduced serum progranulin level might be associated with Parkinson’s disease risk. Eur. J. Neurol. 20 , 1571–1573 (2013).
Bachmann-Harildstad, G. Diagnostic values of beta-2 transferrin and beta-trace protein as markers for cerebrospinal fluid fistula. Rhinology 46 , 82–85 (2008).
PubMed Google Scholar
Pediaditakis, I. et al. Modeling alpha-synuclein pathology in a human brain-chip to assess blood-brain barrier disruption. Nat. Commun. 12 , 5907 (2021).
Serafino, A., Giovannini, D., Rossi, S. & Cozzolino, M. Targeting the Wnt/β-catenin pathway in neurodegenerative diseases: recent approaches and current challenges. Expert Opin. Drug Discov. 15 , 803–822 (2020).
Arenas, E. Wnt signaling in midbrain dopaminergic neuron development and regenerative medicine for Parkinson’s disease. J. Mol. Cell Biol. 6 , 42–53 (2014).
L’Episcopo, F. et al. A Wnt1 regulated Frizzled-1/β-Catenin signaling pathway as a candidate regulatory circuit controlling mesencephalic dopaminergic neuron-astrocyte crosstalk: therapeutical relevance for neuron survival and neuroprotection. Mol. Neurodegener. 6 , 49 (2011).
Sweeney, M. D., Sagare, A. P. & Zlokovic, B. V. Blood-brain barrier breakdown in Alzheimer disease and other neurodegenerative disorders. Nat. Rev. Neurol. 14 , 133–150 (2018).
L’Episcopo, F. et al. Wnt/beta-catenin signaling is required to rescue midbrain dopaminergic progenitors and promote neurorepair in ageing mouse model of Parkinson’s disease. Stem Cells 32 , 2147–2163 (2014).
Marchetti, B. Wnt/beta-catenin signaling pathway governs a full program for dopaminergic neuron survival, neurorescue and regeneration in the MPTP mouse model of Parkinson’s disease. Int. J. Mol. Sci. 19 , 3743 (2018).
Marchetti, B. et al. Parkinson’s disease, aging and adult neurogenesis: Wnt/beta-catenin signalling as the key to unlock the mystery of endogenous brain repair. Aging Cell 19 , e1310110 (2020).
L’Episcopo, F. et al. Neural stem cell grafts promote astroglia-driven neurorestoration in the aged Parkinsonian brain via Wnt/beta-catenin signaling. Stem Cells 36 , 1179–1197 (2018).
Serafino, A. et al. Developing drugs that target the Wnt pathway: recent approaches in cancer and neurodegenerative diseases. Expert Opin. Drug Discov. 12 , 169–186 (2017).
Harms, A. S., Ferreira, S. A. & Romero-Ramos, M. Periphery and brain, innate and adaptive immunity in Parkinson’s disease. Acta Neuropathol. 141 , 527–545 (2021).
Dong, M. X. et al. Serum butyrylcholinesterase activity: a biomarker for Parkinson’s disease and related dementia. Biomed. Res. Int. 2017 , 1524107 (2017).
Postuma, R. B. et al. Risk and predictors of dementia and parkinsonism in idiopathic REM sleep behaviour disorder: a multicentre study. Brain 142 , 744–759 (2019).
Zhang, H. et al. Risk factors for phenoconversion in rapid eye movement sleep behavior disorder. Ann. Neurol. 91 , 404–416 (2022).
Palma, J. A. et al. Prevalence of REM sleep behavior disorder in multiple system atrophy: a multicenter study and meta-analysis. Clin. Auton. Res. 25 , 69–75 (2015).
Jennings, D. et al. Imaging prodromal Parkinson disease: the Parkinson Associated Risk Syndrome Study. Neurology 83 , 1739–1746 (2014).
Schade, S. et al. Identifying prodromal NMS in a population-based recruitment strategy: Kassel data of Healthy Brain Ageing. Zenodo (2023).
Schade, S. et al. Acute levodopa challenge test in patients with de novo Parkinson’s disease: data from the DeNoPa cohort. Mov. Disord. Clin. Pr. 4 , 755–762 (2017).
Hummel, T., Sekinger, B., Wolf, S. R., Pauli, E. & Kobal, G. ‘Sniffin’ sticks’: olfactory performance assessed by the combined testing of odor identification, odor discrimination and olfactory threshold. Chem. Senses 22 , 39–52 (1997).
Mollenhauer, B. et al. Monitoring of 30 marker candidates in early Parkinson disease as progression markers. Neurology 87 , 168–177 (2016).
Mollenhauer, B. et al. α-Synuclein and tau concentrations in cerebrospinal fluid of patients presenting with parkinsonism: a cohort study. Lancet Neurol. 10 , 230–240 (2011).
UniProt. BLAST https://www.uniprot.org/blast/ . Accessed January 2024.
MacLean, B. et al. Skyline: an open source document editor for creating and analyzing targeted proteomics experiments. Bioinformatics 26 , 966–968 (2010).
Chambers, M. C. et al. A cross-platform toolkit for mass spectrometry and proteomics. Nat. Biotechnol. 30 , 918–920 (2012).
Seabold, S. & Perktold, J. Statsmodels: econometric and statistical modeling with Python. In Proc. 9th Python in Science Conference (SciPy, 2010).
Virtanen, P. et al. SciPy 1.0: fundamental algorithms for scientific computing in Python. Nat. Methods 17 , 261–272 (2020).
Pedregosa, F. et al. Scikit-learn: machine learning in Python. J. Mach. Learn. Res. 12 , 2825–2830 (2011).
MathSciNet Google Scholar
Hunter, J. D. Matplotlib: A 2D graphics environment. Comput. Sci. Eng. 9 , 90–95 (2007).
Sherman, B. T. et al. DAVID: a web server for functional enrichment analysis and functional annotation of gene lists (2021 update). Nucleic Acids Res. 50 , W216–221, (2022).
Huang Da, W., Sherman, B. T. & Lempicki, R. A. Systematic and integrative analysis of large gene lists using DAVID bioinformatics resources. Nat. Protoc. 4 , 44–57 (2009).
Shannon, P. et al. Cytoscape: a software environment for integrated models of biomolecular interaction networks. Genome Res. 13 , 2498–2504 (2003).
Download references
Acknowledgements
This work was supported by the Michael J Fox Foundation, PDUK, The Peto Foundation, The TMSRG (UCL), The BRC at Great Ormond Street Hospital, and the Horizon 2020 Framework Programme (Grant number 634821, PROPAG-AGING). We thank the PROPAG-AGING consortium, a full list of the members can be found in the supplementary material.
Open Access funding enabled and organized by Projekt DEAL.
Author information
These authors contributed equally: Jenny Hällqvist, Michael Bartl.
These authors jointly supervised this work: Kevin Mills, Brit Mollenhauer.
Authors and Affiliations
UCL Institute of Child Health and Great Ormond Street Hospital, London, UK
Jenny Hällqvist, Ivan Doykov, Justyna Śpiewak, Héloїse Vinette & Wendy E. Heywood
UCL Queen Square Institute of Neurology, Clinical and Movement Neurosciences, London, UK
Jenny Hällqvist & Kevin Mills
Department of Neurology, University Medical Center Goettingen, Goettingen, Germany
Michael Bartl, Mohammed Dakna, Mary Xylaki, Sandrina Weber & Brit Mollenhauer
Institute for Neuroimmunology and Multiple Sclerosis Research, University Medical Center Goettingen, Goettingen, Germany
Michael Bartl
Paracelsus-Elena-Klinik, Kassel, Germany
Sebastian Schade, Maria-Lucia Muntean, Friederike Sixel-Döring, Claudia Trenkwalder & Brit Mollenhauer
Department of Experimental, Diagnostic, and Specialty Medicine (DIMES), University of Bologna, Bologna, Italy
Paolo Garagnani, Chiara Pirazzini & Claudio Franceschi
IRCCS Istituto delle Scienze Neurologiche di Bologna, Bologna, Italy
Maria-Giulia Bacalini
National Hospital for Neurology & Neurosurgery, Queen Square, WC1N3BG, London, UK
Kailash Bhatia & Sebastian Schreglmann
Institute of Diagnostic and Interventional Neuroradiology, University Medical Center Goettingen, Goettingen, Germany
Marielle Ernst
Department of Neurology, Philipps-University, Marburg, Germany
Friederike Sixel-Döring
UCL: Food, Microbiomes and Health Institute Strategic Programme, Quadram Institute Bioscience, Norwich Research Park, Norwich, UK
Héloїse Vinette
Department of Neurosurgery, University Medical Center Goettingen, Goettingen, Germany
Claudia Trenkwalder
You can also search for this author in PubMed Google Scholar
Contributions
J.H., M.B., K.M., and B.M. conceptualised, planned and oversaw all aspects of the study. J.H., K.M., J.S., H.V., M.B. and S. Schreglmann performed and analyzed most of the experiments. S. Schade, S.W. and M.B. consented to the subjects and collected the samples. M.-L.M., F.S.-D. and S. Schade analyzed the sleep lab data and diagnosed the iRBD subjects. J.H. and M.D. performed the statistical data analysis. J.H. applied the machine learning methods and designed the figures. W.H., I.D., C.F., M.-G.B., P.G., C.P., K.B. and M.X. provided substantial contributions to the conception of the work, acquisition and interpretation of the data, particularly for the mass spectrometry setup and the refinement of the targeted panel. S. Schade, S.W., C.T., M.B., B.M., M.-L.M. and F.S.D. conceptualised the clinical study, analyzed the clinical data and reevaluated the diagnosis. M.E. provided substantial contributions to the clinical data analyzes, particularly the imaging patient data in regard to differential diagnosis. J.H., M.B., K.M. and B.M. wrote the manuscript with input and substantial revisions from all authors.
Corresponding authors
Correspondence to Jenny Hällqvist or Michael Bartl .
Ethics declarations
Competing interests.
JH, MD, MX, SW, KB, ME, PG, MGB, CP, KM, ID, WH, JS, HV and CF and have no competing interests to report. MB has received funding from the Deutsche Forschungsgemeinschaft (DFG, German Research Foundation) – 413,501,650. CT has received honoraria for consultancy from Roche, and honoraria for educational lectures from UCB, and has received research funding for the PPMI study from the Michael J. Fox Foundation and funding from the EU (Horizon 2020) and stipends from the (International Parkinson’s and Movement Disorder Society) IPMDS. BM has received honoraria for consultancy from Roche, Biogen, AbbVie, UCB, and Sun Pharma Advanced Research Company. BM is a member of the executive steering committee of the Parkinson Progression Marker Initiative and PI of the Systemic Synuclein Sampling Study of the Michael J. Fox Foundation for Parkinson’s Research and has received research funding from the Deutsche Forschungsgemeinschaft (DFG), EU (Horizon 2020), Parkinson Fonds Deutschland, Deutsche Parkinson Vereinigung, Parkinson’s Foundation and the Michael J. Fox Foundation for Parkinson’s Research. MLM has received honoraria for speaking engagements from Deutsche Parkinson Gesellschaft e.V., and royalties from Gesellschaft fur Medien + Kommunikation mbH + Co. FSD has received honoraria for speaking engagements from AbbVie, Bial, Ever Pharma, Medtronic and royalties from Elsevier and Springer. She served on an advisory board for Zambon and Stada Pharma. FSD participated in Ad Boards for consultation: Abbvie, UCB, Bial, Ono, Roche and got honorary for lecturing: Stada Pharm, AbbVie, Alexion, Bial. S. Schade received institutional salaries supported by the EU Horizon 2020 research and innovation programme under grant agreement No. 863664 and by the Michael J. Fox Foundation for Parkinson’s Research under grant agreement No. MJFF-021923. He is supported by a PPMI Early Stage Investigators Funding Programme fellowship of the Michael J. Fox Foundation for Parkinson’s Research under grant agreement No. MJFF-022656. S. Schreglmann received institutional salaries supported by the EU Horizon 2020 research and innovation programme under grant agreement No. 863664, support from the Advanced Clinician Scientist programme by the Interdisciplinary Centre for Clinical Research, Wuerzburg, Germany, and from the Deutsche Forschungsgemeinschaft (DFG, German Research Foundation) Project-ID 424778381-TRR 295. He is a fellow of the Thiemann Foundation. He serves as a scientific adviser to Elemind Inc.
Peer review
Peer review information.
Nature Communications thanks Kanta Horie and the other, anonymous, reviewers for their contribution to the peer review of this work. A peer review file is available.
Additional information
Publisher’s note Springer Nature remains neutral with regard to jurisdictional claims in published maps and institutional affiliations.
Supplementary information
Supplementary information, peer review file, reporting summary, source data, source data, rights and permissions.
Open Access This article is licensed under a Creative Commons Attribution 4.0 International License, which permits use, sharing, adaptation, distribution and reproduction in any medium or format, as long as you give appropriate credit to the original author(s) and the source, provide a link to the Creative Commons licence, and indicate if changes were made. The images or other third party material in this article are included in the article’s Creative Commons licence, unless indicated otherwise in a credit line to the material. If material is not included in the article’s Creative Commons licence and your intended use is not permitted by statutory regulation or exceeds the permitted use, you will need to obtain permission directly from the copyright holder. To view a copy of this licence, visit http://creativecommons.org/licenses/by/4.0/ .
Reprints and permissions
About this article
Cite this article.
Hällqvist, J., Bartl, M., Dakna, M. et al. Plasma proteomics identify biomarkers predicting Parkinson’s disease up to 7 years before symptom onset. Nat Commun 15 , 4759 (2024). https://doi.org/10.1038/s41467-024-48961-3
Download citation
Received : 06 April 2023
Accepted : 20 May 2024
Published : 18 June 2024
DOI : https://doi.org/10.1038/s41467-024-48961-3
Share this article
Anyone you share the following link with will be able to read this content:
Sorry, a shareable link is not currently available for this article.
Provided by the Springer Nature SharedIt content-sharing initiative
By submitting a comment you agree to abide by our Terms and Community Guidelines . If you find something abusive or that does not comply with our terms or guidelines please flag it as inappropriate.
Quick links
- Explore articles by subject
- Guide to authors
- Editorial policies
Sign up for the Nature Briefing: Translational Research newsletter — top stories in biotechnology, drug discovery and pharma.

Help | Advanced Search
Computer Science > Robotics
Title: towards natural language-driven assembly using foundation models.
Abstract: Large Language Models (LLMs) and strong vision models have enabled rapid research and development in the field of Vision-Language-Action models that enable robotic control. The main objective of these methods is to develop a generalist policy that can control robots with various embodiments. However, in industrial robotic applications such as automated assembly and disassembly, some tasks, such as insertion, demand greater accuracy and involve intricate factors like contact engagement, friction handling, and refined motor skills. Implementing these skills using a generalist policy is challenging because these policies might integrate further sensory data, including force or torque measurements, for enhanced precision. In our method, we present a global control policy based on LLMs that can transfer the control policy to a finite set of skills that are specifically trained to perform high-precision tasks through dynamic context switching. The integration of LLMs into this framework underscores their significance in not only interpreting and processing language inputs but also in enriching the control mechanisms for diverse and intricate robotic operations.
| Subjects: | Robotics (cs.RO); Artificial Intelligence (cs.AI); Computer Vision and Pattern Recognition (cs.CV); Machine Learning (cs.LG) |
| Cite as: | [cs.RO] |
| (or [cs.RO] for this version) |
Submission history
Access paper:.
- HTML (experimental)
- Other Formats
References & Citations
- Google Scholar
- Semantic Scholar
BibTeX formatted citation
Bibliographic and Citation Tools
Code, data and media associated with this article, recommenders and search tools.
- Institution
arXivLabs: experimental projects with community collaborators
arXivLabs is a framework that allows collaborators to develop and share new arXiv features directly on our website.
Both individuals and organizations that work with arXivLabs have embraced and accepted our values of openness, community, excellence, and user data privacy. arXiv is committed to these values and only works with partners that adhere to them.
Have an idea for a project that will add value for arXiv's community? Learn more about arXivLabs .
Information
- Author Services
Initiatives
You are accessing a machine-readable page. In order to be human-readable, please install an RSS reader.
All articles published by MDPI are made immediately available worldwide under an open access license. No special permission is required to reuse all or part of the article published by MDPI, including figures and tables. For articles published under an open access Creative Common CC BY license, any part of the article may be reused without permission provided that the original article is clearly cited. For more information, please refer to https://www.mdpi.com/openaccess .
Feature papers represent the most advanced research with significant potential for high impact in the field. A Feature Paper should be a substantial original Article that involves several techniques or approaches, provides an outlook for future research directions and describes possible research applications.
Feature papers are submitted upon individual invitation or recommendation by the scientific editors and must receive positive feedback from the reviewers.
Editor’s Choice articles are based on recommendations by the scientific editors of MDPI journals from around the world. Editors select a small number of articles recently published in the journal that they believe will be particularly interesting to readers, or important in the respective research area. The aim is to provide a snapshot of some of the most exciting work published in the various research areas of the journal.
Original Submission Date Received: .
- Active Journals
- Find a Journal
- Proceedings Series
- For Authors
- For Reviewers
- For Editors
- For Librarians
- For Publishers
- For Societies
- For Conference Organizers
- Open Access Policy
- Institutional Open Access Program
- Special Issues Guidelines
- Editorial Process
- Research and Publication Ethics
- Article Processing Charges
- Testimonials
- Preprints.org
- SciProfiles
- Encyclopedia
Article Menu

- Subscribe SciFeed
- Recommended Articles
- Google Scholar
- on Google Scholar
- Table of Contents
Find support for a specific problem in the support section of our website.
Please let us know what you think of our products and services.
Visit our dedicated information section to learn more about MDPI.
JSmol Viewer
Towards an all-ireland diamond open access publishing platform: the publishoa.ie project—2022–2024.

- Articles will be open access on publication, accessible free of charge to anybody;
- Application of a clearly described peer review process;
- Author copyright retention;
- Application of creative commons licenses (CC BY 4.0 or similar);
- No Article Processing Charges for authors;
- Support for registration with the DOAJ/DOAB;
- Plan S compliance;
- Book publishing requirements compliance, including e-book formats, ONIX integration, author and reader engagement tools, social sharing, and tools to increase the visibility, accessibility, and impact of authors’ work;
- Compliance with the ‘Principles of Open Scholarly Infrastructure’;
- Impact metrics and archiving—Directory of Open Access Books. Available online: https://doaj.org ; https:// www.doabooks.org/ ; https://openscholarlyinfrastructure.org/ (accessed on 16 March 2024).
- Scholarly publishers have articulated differing requirements for book and journal publishing. PublishOA.ie will, therefore, likely recommend and pilot two platforms (one for books, one for journals) to meet the objectives of the project. This was not anticipated at the outset of the project.
- Publisher engagement: publishers in Ireland are time- and resource-poor, especially in terms of staffing. Book publishers issue a mix of publications, and adoption of open access publishing is only one element of their activity.
- Future proofing has been identified as an issue of concern, encompassing the sustainability of the ongoing funding of both the Digital Repository of Ireland (DRI) and individual institutional repositories, and ‘reference rot’ (broken links), where the article or webpage resource identified by a URL no longer exists or has moved to another site. Reference rot also refers to the case whereby the resource identified has changed over time and evolved into a resource that bears no resemblance to the content originally referenced [ 13 ].
- The all-island mandate for a shared programme will require funding from the separate Governments of the Republic of Ireland and Northern Ireland. Since the UK’s departure from the EU, so-called Brexit, the UK is no longer bound by EU law and directives (since this paper was delivered, the UK rejoined the Horizon Europe research and innovation programme in December 2023) [ 14 ].
- Bibliodiversity: support for smaller publishers will likely be required; the technical challenges of Diamond OA publishing may cause small publishers to outsource or divest themselves of publications to companies dedicated to this kind of publishing.
- Academic author buy-in: PublishOA.ie has identified that there are significant gaps in both knowledge and interest in open access publishing that may be mitigated by further and ongoing education and information.
Conclusions
Data availability statement, conflicts of interest.
| 1 | |
| 2 | . Note the statement that ‘[p]ublishers are committed to delivering on the Open Access agenda, but do require the necessary time, flexibility and funding to do so’. See also UK Research and Innovation (UKRI) policy statement on Open Access. Available online: (accessed on 16 March 2024). |
| 3 | (accessed on 16 March 2024). |
- National Open Research Forum (NORF). National Action Plan for Open Research 2022–2030 ; Ireland’s National Open Research Forum: Dublin, Ireland, 2022; pp. 3–15. [ Google Scholar ]
- Impact 2030: Ireland’s Research and Innovation Strategy. Available online: https://www.gov.ie/en/publication/27c78-impact-2030-irelands-new-research-and-innovation-strategy/ (accessed on 13 March 2024).
- Mahony, J. (Trinity College Dublin, Dublin, Ireland). Overview and Context of Publishing in Ireland 1551–1922. Ph.D. Thesis. 2016; Unpublished . p. 29. [ Google Scholar ]
- Central Statistics Office Ireland. Population and Migration Estimates, April 2023. Available online: https://www.cso.ie/en/releasesandpublications/ep/p-pme/populationandmigrationestimatesapril2023/keyfindings/ (accessed on 16 March 2024).
- UK Population Data: Northern Ireland Population 2024. Available online: https://populationdata.org.uk/northern-ireland-population/ (accessed on 13 March 2024).
- Digital Directory of Irish Publishers. Available online: https://publishoa-ie.moodlecloud.com/mod/data/view.php?id=94 (accessed on 13 March 2024).
- DIAMAS—Developing Institutional Open Access Publishing Models to Advance Scholarly Communication. Available online: https://diamasproject.eu/ (accessed on 13 March 2024).
- Plan S: Diamond Open Access. Available online: https://www.coalition-s.org/diamond-open-access/ (accessed on 14 March 2024).
- Plan S: Diamond Open Access—Technical Guidance and Requirements. Available online: https://www.coalition-s.org/technical-guidance_and_requirements/ (accessed on 14 March 2024).
- The MIT Press Announces New Initiative to Flip Existing Subscription-Based Journals to a Diamond Open Access Model. Available online: https://mitpress.mit.edu/the-mit-press-announces-new-initiative-to-flip-existing-subscription-based-journals-to-a-diamond-open-access-publishing-model/ (accessed on 16 March 2024).
- Research and Innovation: The EU’s Open Science Policy. Available online: https://research-and-innovation.ec.europa.eu/strategy/strategy-2020-2024/our-digital-future/open-science_en (accessed on 14 March 2024).
- UNESCO. Open Access. Available online: https://en.unesco.org/open-access/ (accessed on 16 March 2024).
- da Silva, J.A.T.; Nazarovets, M. Archiving website-based references in academic papers: Problems caused by reference rot, potential solutions and limitations. Learn. Publ. 2023 , 36 , 477–487. [ Google Scholar ] [ CrossRef ]
- European Commission. United Kingdom Joins Horizon Europe Programme. Available online: https://ec.europa.eu/commission/presscorner/detail/en/IP_23_6327 (accessed on 16 March 2024).
Click here to enlarge figure
| The statements, opinions and data contained in all publications are solely those of the individual author(s) and contributor(s) and not of MDPI and/or the editor(s). MDPI and/or the editor(s) disclaim responsibility for any injury to people or property resulting from any ideas, methods, instructions or products referred to in the content. |
Share and Cite
Mahony, J. Towards an All-Ireland Diamond Open Access Publishing Platform: The PublishOA.ie Project—2022–2024. Publications 2024 , 12 , 19. https://doi.org/10.3390/publications12030019
Mahony J. Towards an All-Ireland Diamond Open Access Publishing Platform: The PublishOA.ie Project—2022–2024. Publications . 2024; 12(3):19. https://doi.org/10.3390/publications12030019
Mahony, Jane. 2024. "Towards an All-Ireland Diamond Open Access Publishing Platform: The PublishOA.ie Project—2022–2024" Publications 12, no. 3: 19. https://doi.org/10.3390/publications12030019
Article Metrics
Article access statistics, further information, mdpi initiatives, follow mdpi.
Subscribe to receive issue release notifications and newsletters from MDPI journals
IMAGES
VIDEO
COMMENTS
Your research objectives may evolve slightly as your research progresses, but they should always line up with the research carried out and the actual content of your paper. Research aims. A distinction is often made between research objectives and research aims. A research aim typically refers to a broad statement indicating the general purpose ...
Characteristics of research objectives. Research objectives must start with the word "To" because this helps readers identify the objective in the absence of headings and appropriate sectioning in research papers. 5,6. A good objective is SMART (mostly applicable to specific objectives): Specific—clear about the what, why, when, and how
Examples of Specific Research Objectives: 1. "To examine the effects of rising temperatures on the yield of rice crops during the upcoming growth season.". 2. "To assess changes in rainfall patterns in major agricultural regions over the first decade of the twenty-first century (2000-2010).". 3.
Research Objectives. Research objectives refer to the specific goals or aims of a research study. They provide a clear and concise description of what the researcher hopes to achieve by conducting the research.The objectives are typically based on the research questions and hypotheses formulated at the beginning of the study and are used to guide the research process.
The golden thread simply refers to the collective research aims, research objectives, and research questions for any given project (i.e., a dissertation, thesis, or research paper). These three elements are bundled together because it's extremely important that they align with each other, and that the entire research project aligns with them.
The objectives provide a clear direction and purpose for the study, guiding the researcher in their data collection and analysis. Here are some tips on how to write effective research objective: 1. Be clear and specific. Research objective should be written in a clear and specific manner.
To develop a set of research objectives, you would then break down the various steps involved in meeting said aim. For example: This study will investigate the link between dehydration and the incidence of urinary tract infections (UTIs) in intensive care patients in Australia. To achieve this, the study objectives w ill include:
The writing of effective research aims and objectives can cause confusion and concern to new and experienced researchers and learners. This step in your research journey is usually the first written method used to convey your research idea to your tutor. Therefore, aims and objectives should clearly convey your topic, academic foundation, and ...
A research objective is defined as a clear and concise statement of the specific goals and aims of a research study. It outlines what the researcher intends to accomplish and what they hope to learn or discover through their research. Research objectives are crucial for guiding the research process and ensuring that the study stays focused and ...
Once you've decided on your research objectives, you need to explain them in your paper, at the end of your problem statement. Keep your research objectives clear and concise, and use appropriate verbs to accurately convey the work that you will carry out for each one. Example: Verbs for research objectives I will assess … I will compare …
There are typically three main types of objectives in a research paper: Exploratory Objectives: These objectives are focused on gaining a deeper understanding of a particular phenomenon, topic, or issue. Exploratory research objectives aim to explore and identify new ideas, insights, or patterns that were previously unknown or poorly understood.
Research Objectives Examples in Different Fields. The application of research objectives spans various academic disciplines, each with its unique focus and methodologies. To illustrate how the objectives of the study guide a research paper across different fields, here are some research objective examples:
Summary. One of the most important aspects of a thesis, dissertation or research paper is the correct formulation of the aims and objectives. This is because your aims and objectives will establish the scope, depth and direction that your research will ultimately take. An effective set of aims and objectives will give your research focus and ...
5 Examples of Research Objectives. The following examples of research objectives based on several published studies on various topics demonstrate how the research objectives are written: This study aims to find out if there is a difference in quiz scores between students exposed to direct instruction and flipped classrooms (Webb and Doman, 2016).
Research objective 2: This paper implements surveys and personal interviews to determine first-hand feedback from the youth members and the team leaders. Research objective 3: Aiming to compare and contrast, this study determines the positive outcomes of the unity project work between the branches of the youth movement in Belgium, aiming for ...
Here are three simple steps that you can follow to identify and write your research objectives: 1. Pinpoint the major focus of your research. The first step to writing your research objectives is to pinpoint the major focus of your research project. In this step, make sure to clearly describe what you aim to achieve through your research.
A research paper is a piece of academic writing that provides analysis, interpretation, and argument based on in-depth independent research. About us; Disclaimer; ... Formal and objective: Research papers are written in a formal and objective tone, with an emphasis on clarity, precision, and accuracy. They avoid subjective language or personal ...
Formulating research aim and objectives in an appropriate manner is one of the most important aspects of your thesis. This is because research aim and objectives determine the scope, depth and the overall direction of the research. Research question is the central question of the study that has to be answered on the basis of research findings.
Aim: To understand the contribution that local governments make to national level energy policy. Objectives: Conduct a survey of local politicians to solicit responses. Conduct desk-research of local government websites to create a database of local energy policy.
The development of the research question, including a supportive hypothesis and objectives, is a necessary key step in producing clinically relevant results to be used in evidence-based practice. A well-defined and specific research question is more likely to help guide us in making decisions about study design and population and subsequently ...
An in-depth analysis of information creates space for generating new questions, concepts and understandings. The main objective of research is to explore the unknown and unlock new possibilities. It's an essential component of success. Over the years, businesses have started emphasizing the need for research.
The objective of this paper is to provide step by step guides to analyse quantitative data. A common research topic on diabetes is used to illustrate the approach in data analysis.
Why written objectives need to be really SMART. July 2017. British Journal of Healthcare Management 23 (7):324-336. DOI: 10.12968/bjhc.2017.23.7.324. Authors: Osahon Ogbeiwi. South West Yorkshire ...
Objectives This portion of the course covers key library resources: literature databases, academic journals, scholarly monographs, and primary source collections. We also discuss key library services for undergraduates as well as connecting with librarians who specialize in English studies, and search tips that will help make your research more ...
Paper presented at: International Meeting for Autism Research; May 9, 2009; Chicago, IL. Accessed December 6, 2022. ... Objective To develop an objective performance-based tool to aid in early diagnosis and assessment of autism in children younger than 3 years.
The procurement strategy for a construction project should provide the framework to achieve secondary procurement and socio-economic development objectives [2]. However, little attention has been focused on this in theory and practice. This paper addresses that gap by presenting a case study of the innovative targeting strategy developed and successfully implemented on a New Universities ...
Background: The occupational burnout epidemic is a growing issue, and in the United States, up to 60% of medical students, residents, physicians, and registered nurses experience symptoms. Wearable technologies may provide an opportunity to predict the onset of burnout and other forms of distress using physiological markers. Objective: This study aims to identify physiological biomarkers of ...
Schreglmann received institutional salaries supported by the EU Horizon 2020 research and innovation programme under grant agreement No. 863664, support from the Advanced Clinician Scientist ...
Large Language Models (LLMs) and strong vision models have enabled rapid research and development in the field of Vision-Language-Action models that enable robotic control. The main objective of these methods is to develop a generalist policy that can control robots with various embodiments. However, in industrial robotic applications such as automated assembly and disassembly, some tasks ...
The Government of Ireland has set a target of achieving 100% open access to publicly funded scholarly publications by 2030. As a key element of achieving this objective, the PublishOA.ie project was established to evaluate the feasibility of establishing an all-island [Republic of Ireland and Northern Ireland] digital publishing platform for Diamond Open Access journals and monographs designed ...