9.4 Full Hypothesis Test Examples
Tests on means, example 9.8.
Jeffrey, as an eight-year old, established a mean time of 16.43 seconds for swimming the 25-yard freestyle, with a standard deviation of 0.8 seconds . His dad, Frank, thought that Jeffrey could swim the 25-yard freestyle faster using goggles. Frank bought Jeffrey a new pair of expensive goggles and timed Jeffrey for 15 25-yard freestyle swims . For the 15 swims, Jeffrey's mean time was 16 seconds. Frank thought that the goggles helped Jeffrey to swim faster than the 16.43 seconds. Conduct a hypothesis test using a preset α = 0.05. Assume that the swim times for the 25-yard freestyle are normal.
Set up the Hypothesis Test:
Since the problem is about a mean, this is a test of a single population mean .
H 0 : μ = 16.43 H a : μ < 16.43
For Jeffrey to swim faster, his time will be less than 16.43 seconds. The "<" tells you this is left-tailed.
Determine the distribution needed:
Random variable: X ¯ X ¯ = the mean time to swim the 25-yard freestyle.
Distribution for the test: X ¯ X ¯ is normal (population standard deviation is known: σ = 0.8)
X ¯ ~ N ( μ , σ X n ) X ¯ ~ N ( μ , σ X n ) Therefore, X ¯ ~ N ( 16.43 , 0.8 15 ) X ¯ ~ N ( 16.43 , 0.8 15 )
μ = 16.43 comes from H 0 and not the data. σ = 0.8, and n = 15.
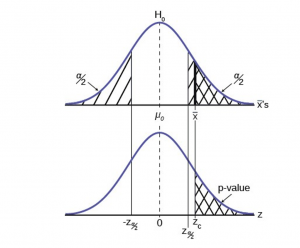
Calculate the p -value using the normal distribution for a mean:
p -value = P ( x ¯ x ¯ < 16) = 0.0187 where the sample mean in the problem is given as 16.
p -value = 0.0187 (This is called the actual level of significance .) The p -value is the area to the left of the sample mean is given as 16.
μ = 16.43 comes from H 0 . Our assumption is μ = 16.43.
Interpretation of the p -value: If H 0 is true , there is a 0.0187 probability (1.87%)that Jeffrey's mean time to swim the 25-yard freestyle is 16 seconds or less. Because a 1.87% chance is small, the mean time of 16 seconds or less is unlikely to have happened randomly. It is a rare event.
Compare α and the p -value:
α = 0.05 p -value = 0.0187 α > p -value
Make a decision: Since α > α > p -value, reject H 0 .
This indicates that you reject the null hypothesis that the mean time to swim the 25-yard freestyle is at least 16.43 seconds.
Conclusion: At the 5% significance level, there is sufficient evidence that Jeffrey's mean time to swim the 25-yard freestyle is less than 16.43 seconds. Thus, based on the sample data, we conclude that Jeffrey swims faster using the new goggles.
The Type I and Type II errors for this problem are as follows: The Type I error is to conclude that Jeffrey swims the 25-yard freestyle, on average, in less than 16.43 seconds when, in fact, he actually swims the 25-yard freestyle, on average, in at least 16.43 seconds. (Reject the null hypothesis when the null hypothesis is true.)
The Type II error is that there is not evidence to conclude that Jeffrey swims the 25-yard freestyle, on average, in less than 16.43 seconds when, in fact, he actually does swim the 25-yard free-style, on average, in less than 16.43 seconds. (Do not reject the null hypothesis when the null hypothesis is false.)
The mean throwing distance of a football for Marco, a high school quarterback, is 40 yards, with a standard deviation of two yards. The team coach tells Marco to adjust his grip to get more distance. The coach records the distances for 20 throws. For the 20 throws, Marco’s mean distance was 45 yards. The coach thought the different grip helped Marco throw farther than 40 yards. Conduct a hypothesis test using a preset α = 0.05. Assume the throw distances for footballs are normal.
First, determine what type of test this is, set up the hypothesis test, find the p -value, sketch the graph, and state your conclusion.

Example 9.9
Jasmine has just begun her new job on the sales force of a very competitive company. In a sample of 16 sales calls it was found that she closed the contract for an average value of 108 dollars with a standard deviation of 12 dollars. Test at 5% significance that the population mean is at least 100 dollars against the alternative that it is less than 100 dollars. Company policy requires that new members of the sales force must exceed an average of $100 per contract during the trial employment period. Can we conclude that Jasmine has met this requirement at the significance level of 95%?
- H 0 : µ ≤ 100 H a : µ > 100 The null and alternative hypothesis are for the parameter µ because the number of dollars of the contracts is a continuous random variable. Also, this is a one-tailed test because the company has only an interested if the number of dollars per contact is below a particular number not "too high" a number. This can be thought of as making a claim that the requirement is being met and thus the claim is in the alternative hypothesis.
- Test statistic: t c = x ¯ − µ 0 s n = 108 − 100 ( 12 16 ) = 2.67 t c = x ¯ − µ 0 s n = 108 − 100 ( 12 16 ) = 2.67
- Critical value: t a = 1.753 t a = 1.753 with n-1 degrees of freedom= 15
The test statistic is a Student's t because the sample size is below 30; therefore, we cannot use the normal distribution. Comparing the calculated value of the test statistic and the critical value of t t ( t a ) ( t a ) at a 5% significance level, we see that the calculated value is in the tail of the distribution. Thus, we conclude that 108 dollars per contract is significantly larger than the hypothesized value of 100 and thus we cannot accept the null hypothesis. There is evidence that supports Jasmine's performance meets company standards.
It is believed that a stock price for a particular company will grow at a rate of $5 per week with a standard deviation of $1. An investor believes the stock won’t grow as quickly. The changes in stock price is recorded for ten weeks and are as follows: $4, $3, $2, $3, $1, $7, $2, $1, $1, $2. Perform a hypothesis test using a 5% level of significance. State the null and alternative hypotheses, state your conclusion, and identify the Type I errors.
Example 9.10
A manufacturer of salad dressings uses machines to dispense liquid ingredients into bottles that move along a filling line. The machine that dispenses salad dressings is working properly when 8 ounces are dispensed. Suppose that the average amount dispensed in a particular sample of 35 bottles is 7.91 ounces with a variance of 0.03 ounces squared, s 2 s 2 . Is there evidence that the machine should be stopped and production wait for repairs? The lost production from a shutdown is potentially so great that management feels that the level of significance in the analysis should be 99%.
Again we will follow the steps in our analysis of this problem.
STEP 1 : Set the Null and Alternative Hypothesis. The random variable is the quantity of fluid placed in the bottles. This is a continuous random variable and the parameter we are interested in is the mean. Our hypothesis therefore is about the mean. In this case we are concerned that the machine is not filling properly. From what we are told it does not matter if the machine is over-filling or under-filling, both seem to be an equally bad error. This tells us that this is a two-tailed test: if the machine is malfunctioning it will be shutdown regardless if it is from over-filling or under-filling. The null and alternative hypotheses are thus:
STEP 2 : Decide the level of significance and draw the graph showing the critical value.
This problem has already set the level of significance at 99%. The decision seems an appropriate one and shows the thought process when setting the significance level. Management wants to be very certain, as certain as probability will allow, that they are not shutting down a machine that is not in need of repair. To draw the distribution and the critical value, we need to know which distribution to use. Because this is a continuous random variable and we are interested in the mean, and the sample size is greater than 30, the appropriate distribution is the normal distribution and the relevant critical value is 2.575 from the normal table or the t-table at 0.005 column and infinite degrees of freedom. We draw the graph and mark these points.
STEP 3 : Calculate sample parameters and the test statistic. The sample parameters are provided, the sample mean is 7.91 and the sample variance is .03 and the sample size is 35. We need to note that the sample variance was provided not the sample standard deviation, which is what we need for the formula. Remembering that the standard deviation is simply the square root of the variance, we therefore know the sample standard deviation, s, is 0.173. With this information we calculate the test statistic as -3.07, and mark it on the graph.
STEP 4 : Compare test statistic and the critical values Now we compare the test statistic and the critical value by placing the test statistic on the graph. We see that the test statistic is in the tail, decidedly greater than the critical value of 2.575. We note that even the very small difference between the hypothesized value and the sample value is still a large number of standard deviations. The sample mean is only 0.08 ounces different from the required level of 8 ounces, but it is 3 plus standard deviations away and thus we cannot accept the null hypothesis.
STEP 5 : Reach a Conclusion
Three standard deviations of a test statistic will guarantee that the test will fail. The probability that anything is within three standard deviations is almost zero. Actually it is 0.0026 on the normal distribution, which is certainly almost zero in a practical sense. Our formal conclusion would be “ At a 99% level of significance we cannot accept the hypothesis that the sample mean came from a distribution with a mean of 8 ounces” Or less formally, and getting to the point, “At a 99% level of significance we conclude that the machine is under filling the bottles and is in need of repair”.
Try It 9.10
A company records the mean time of employees working in a day. The mean comes out to be 475 minutes, with a standard deviation of 45 minutes. A manager recorded times of 20 employees. The times of working were (frequencies are in parentheses) 460(3); 465(2); 470(3); 475(1); 480(6); 485(3); 490(2).
Conduct a hypothesis test using a 2.5% level of significance to determine if the mean time is more than 475 .
Hypothesis Test for Proportions
Just as there were confidence intervals for proportions, or more formally, the population parameter p of the binomial distribution, there is the ability to test hypotheses concerning p .
The population parameter for the binomial is p . The estimated value (point estimate) for p is p′ where p′ = x/n , x is the number of successes in the sample and n is the sample size.
When you perform a hypothesis test of a population proportion p , you take a simple random sample from the population. The conditions for a binomial distribution must be met, which are: there are a certain number n of independent trials meaning random sampling, the outcomes of any trial are binary, success or failure, and each trial has the same probability of a success p . The shape of the binomial distribution needs to be similar to the shape of the normal distribution. To ensure this, the quantities np′ and nq′ must both be greater than five ( np′ > 5 and nq′ > 5). In this case the binomial distribution of a sample (estimated) proportion can be approximated by the normal distribution with μ = np μ = np and σ = npq σ = npq . Remember that q = 1 – p q = 1 – p . There is no distribution that can correct for this small sample bias and thus if these conditions are not met we simply cannot test the hypothesis with the data available at that time. We met this condition when we first were estimating confidence intervals for p .
Again, we begin with the standardizing formula modified because this is the distribution of a binomial.
Substituting p 0 p 0 , the hypothesized value of p , we have:
This is the test statistic for testing hypothesized values of p , where the null and alternative hypotheses take one of the following forms:
The decision rule stated above applies here also: if the calculated value of Z c shows that the sample proportion is "too many" standard deviations from the hypothesized proportion, the null hypothesis cannot be accepted. The decision as to what is "too many" is pre-determined by the analyst depending on the level of significance required in the test.
Example 9.11
The mortgage department of a large bank is interested in the nature of loans of first-time borrowers. This information will be used to tailor their marketing strategy. They believe that 50% of first-time borrowers take out smaller loans than other borrowers. They perform a hypothesis test to determine if the percentage is the same or different from 50% . They sample 100 first-time borrowers and find 53 of these loans are smaller that the other borrowers. For the hypothesis test, they choose a 5% level of significance.
STEP 1 : Set the null and alternative hypothesis.
H 0 : p = 0.50 H a : p ≠ 0.50
The words "is the same or different from" tell you this is a two-tailed test. The Type I and Type II errors are as follows: The Type I error is to conclude that the proportion of borrowers is different from 50% when, in fact, the proportion is actually 50%. (Reject the null hypothesis when the null hypothesis is true). The Type II error is there is not enough evidence to conclude that the proportion of first time borrowers differs from 50% when, in fact, the proportion does differ from 50%. (You fail to reject the null hypothesis when the null hypothesis is false.)
STEP 2 : Decide the level of significance and draw the graph showing the critical value
The level of significance has been set by the problem at the 5% level. Because this is two-tailed test one-half of the alpha value will be in the upper tail and one-half in the lower tail as shown on the graph. The critical value for the normal distribution at the 95% level of confidence is 1.96. This can easily be found on the student’s t-table at the very bottom at infinite degrees of freedom remembering that at infinity the t-distribution is the normal distribution. Of course the value can also be found on the normal table but you have go looking for one-half of 95 (0.475) inside the body of the table and then read out to the sides and top for the number of standard deviations.
STEP 3 : Calculate the sample parameters and critical value of the test statistic.
The test statistic is a normal distribution, Z, for testing proportions and is:
For this case, the sample of 100 found 53 of these loans were smaller than those of other borrowers. The sample proportion, p′ = 53/100= 0.53 The test question, therefore, is : “Is 0.53 significantly different from .50?” Putting these values into the formula for the test statistic we find that 0.53 is only 0.60 standard deviations away from .50. This is barely off of the mean of the standard normal distribution of zero. There is virtually no difference from the sample proportion and the hypothesized proportion in terms of standard deviations.
STEP 4 : Compare the test statistic and the critical value.
The calculated value is well within the critical values of ± 1.96 standard deviations and thus we cannot reject the null hypothesis. To reject the null hypothesis we need significant evident of difference between the hypothesized value and the sample value. In this case the sample value is very nearly the same as the hypothesized value measured in terms of standard deviations.
STEP 5 : Reach a conclusion
The formal conclusion would be “At a 5% level of significance we cannot reject the null hypothesis that 50% of first-time borrowers take out smaller loans than other borrowers.” Notice the length to which the conclusion goes to include all of the conditions that are attached to the conclusion. Statisticians, for all the criticism they receive, are careful to be very specific even when this seems trivial. Statisticians cannot say more than they know, and the data constrain the conclusion to be within the metes and bounds of the data.
Try It 9.11
A teacher believes that 85% of students in the class will want to go on a field trip to the local zoo. The teacher performs a hypothesis test to determine if the percentage is the same or different from 85%. The teacher samples 50 students and 39 reply that they would want to go to the zoo. For the hypothesis test, use a 1% level of significance.
Example 9.12
Suppose a consumer group suspects that the proportion of households that have three or more cell phones is 30%. A cell phone company has reason to believe that the proportion is not 30%. Before they start a big advertising campaign, they conduct a hypothesis test. Their marketing people survey 150 households with the result that 43 of the households have three or more cell phones.
Here is an abbreviate version of the system to solve hypothesis tests applied to a test on a proportions.
Try It 9.12
Marketers believe that 92% of adults in the United States own a cell phone. A cell phone manufacturer believes that number is actually lower. 200 American adults are surveyed, of which, 174 report having cell phones. Use a 5% level of significance. State the null and alternative hypothesis, find the p -value, state your conclusion, and identify the Type I and Type II errors.
Example 9.13
The National Institute of Standards and Technology provides exact data on conductivity properties of materials. Following are conductivity measurements for 11 randomly selected pieces of a particular type of glass.
1.11; 1.07; 1.11; 1.07; 1.12; 1.08; .98; .98; 1.02; .95; .95 Is there convincing evidence that the average conductivity of this type of glass is greater than one? Use a significance level of 0.05.
Let’s follow a four-step process to answer this statistical question.
- H 0 : μ ≤ 1
- H a : μ > 1
- Plan : We are testing a sample mean without a known population standard deviation with less than 30 observations. Therefore, we need to use a Student's-t distribution. Assume the underlying population is normal.
- Do the calculations and draw the graph .
- State the Conclusions : We cannot accept the null hypothesis. It is reasonable to state that the data supports the claim that the average conductivity level is greater than one.
Try It 9.13
The boiling point of a specific liquid is measured for 15 samples, and the boiling points are obtained as follows:
205; 206; 206; 202; 199; 194; 197; 198; 198; 201; 201; 202; 207; 211; 205
Is there convincing evidence that the average boiling point is greater than 200? Use a significance level of 0.1. Assume the population is normal.
Example 9.14
In a study of 420,019 cell phone users, 172 of the subjects developed brain cancer. Test the claim that cell phone users developed brain cancer at a greater rate than that for non-cell phone users (the rate of brain cancer for non-cell phone users is 0.0340%). Since this is a critical issue, use a 0.005 significance level. Explain why the significance level should be so low in terms of a Type I error.
- H 0 : p ≤ 0.00034
- H a : p > 0.00034
If we commit a Type I error, we are essentially accepting a false claim. Since the claim describes cancer-causing environments, we want to minimize the chances of incorrectly identifying causes of cancer.
- We will be testing a sample proportion with x = 172 and n = 420,019. The sample is sufficiently large because we have np' = 420,019(0.00034) = 142.8, nq' = 420,019(0.99966) = 419,876.2, two independent outcomes, and a fixed probability of success p' = 0.00034. Thus we will be able to generalize our results to the population.
Try It 9.14
In a study of 390,000 moisturizer users, 138 of the subjects developed skin diseases. Test the claim that moisturizer users developed skin diseases at a greater rate than that for non-moisturizer users (the rate of skin diseases for non-moisturizer users is 0.041%). Since this is a critical issue, use a 0.005 significance level. Explain why the significance level should be so low in terms of a Type I error.
This book may not be used in the training of large language models or otherwise be ingested into large language models or generative AI offerings without OpenStax's permission.
Want to cite, share, or modify this book? This book uses the Creative Commons Attribution License and you must attribute OpenStax.
Access for free at https://openstax.org/books/introductory-business-statistics-2e/pages/1-introduction
- Authors: Alexander Holmes, Barbara Illowsky, Susan Dean
- Publisher/website: OpenStax
- Book title: Introductory Business Statistics 2e
- Publication date: Dec 13, 2023
- Location: Houston, Texas
- Book URL: https://openstax.org/books/introductory-business-statistics-2e/pages/1-introduction
- Section URL: https://openstax.org/books/introductory-business-statistics-2e/pages/9-4-full-hypothesis-test-examples
© Dec 6, 2023 OpenStax. Textbook content produced by OpenStax is licensed under a Creative Commons Attribution License . The OpenStax name, OpenStax logo, OpenStax book covers, OpenStax CNX name, and OpenStax CNX logo are not subject to the Creative Commons license and may not be reproduced without the prior and express written consent of Rice University.
Hypothesis Testing
Hypothesis testing is a tool for making statistical inferences about the population data. It is an analysis tool that tests assumptions and determines how likely something is within a given standard of accuracy. Hypothesis testing provides a way to verify whether the results of an experiment are valid.
A null hypothesis and an alternative hypothesis are set up before performing the hypothesis testing. This helps to arrive at a conclusion regarding the sample obtained from the population. In this article, we will learn more about hypothesis testing, its types, steps to perform the testing, and associated examples.
What is Hypothesis Testing in Statistics?
Hypothesis testing uses sample data from the population to draw useful conclusions regarding the population probability distribution . It tests an assumption made about the data using different types of hypothesis testing methodologies. The hypothesis testing results in either rejecting or not rejecting the null hypothesis.
Hypothesis Testing Definition
Hypothesis testing can be defined as a statistical tool that is used to identify if the results of an experiment are meaningful or not. It involves setting up a null hypothesis and an alternative hypothesis. These two hypotheses will always be mutually exclusive. This means that if the null hypothesis is true then the alternative hypothesis is false and vice versa. An example of hypothesis testing is setting up a test to check if a new medicine works on a disease in a more efficient manner.
Null Hypothesis
The null hypothesis is a concise mathematical statement that is used to indicate that there is no difference between two possibilities. In other words, there is no difference between certain characteristics of data. This hypothesis assumes that the outcomes of an experiment are based on chance alone. It is denoted as \(H_{0}\). Hypothesis testing is used to conclude if the null hypothesis can be rejected or not. Suppose an experiment is conducted to check if girls are shorter than boys at the age of 5. The null hypothesis will say that they are the same height.
Alternative Hypothesis
The alternative hypothesis is an alternative to the null hypothesis. It is used to show that the observations of an experiment are due to some real effect. It indicates that there is a statistical significance between two possible outcomes and can be denoted as \(H_{1}\) or \(H_{a}\). For the above-mentioned example, the alternative hypothesis would be that girls are shorter than boys at the age of 5.
Hypothesis Testing P Value
In hypothesis testing, the p value is used to indicate whether the results obtained after conducting a test are statistically significant or not. It also indicates the probability of making an error in rejecting or not rejecting the null hypothesis.This value is always a number between 0 and 1. The p value is compared to an alpha level, \(\alpha\) or significance level. The alpha level can be defined as the acceptable risk of incorrectly rejecting the null hypothesis. The alpha level is usually chosen between 1% to 5%.
Hypothesis Testing Critical region
All sets of values that lead to rejecting the null hypothesis lie in the critical region. Furthermore, the value that separates the critical region from the non-critical region is known as the critical value.
Hypothesis Testing Formula
Depending upon the type of data available and the size, different types of hypothesis testing are used to determine whether the null hypothesis can be rejected or not. The hypothesis testing formula for some important test statistics are given below:
- z = \(\frac{\overline{x}-\mu}{\frac{\sigma}{\sqrt{n}}}\). \(\overline{x}\) is the sample mean, \(\mu\) is the population mean, \(\sigma\) is the population standard deviation and n is the size of the sample.
- t = \(\frac{\overline{x}-\mu}{\frac{s}{\sqrt{n}}}\). s is the sample standard deviation.
- \(\chi ^{2} = \sum \frac{(O_{i}-E_{i})^{2}}{E_{i}}\). \(O_{i}\) is the observed value and \(E_{i}\) is the expected value.
We will learn more about these test statistics in the upcoming section.
Types of Hypothesis Testing
Selecting the correct test for performing hypothesis testing can be confusing. These tests are used to determine a test statistic on the basis of which the null hypothesis can either be rejected or not rejected. Some of the important tests used for hypothesis testing are given below.
Hypothesis Testing Z Test
A z test is a way of hypothesis testing that is used for a large sample size (n ≥ 30). It is used to determine whether there is a difference between the population mean and the sample mean when the population standard deviation is known. It can also be used to compare the mean of two samples. It is used to compute the z test statistic. The formulas are given as follows:
- One sample: z = \(\frac{\overline{x}-\mu}{\frac{\sigma}{\sqrt{n}}}\).
- Two samples: z = \(\frac{(\overline{x_{1}}-\overline{x_{2}})-(\mu_{1}-\mu_{2})}{\sqrt{\frac{\sigma_{1}^{2}}{n_{1}}+\frac{\sigma_{2}^{2}}{n_{2}}}}\).
Hypothesis Testing t Test
The t test is another method of hypothesis testing that is used for a small sample size (n < 30). It is also used to compare the sample mean and population mean. However, the population standard deviation is not known. Instead, the sample standard deviation is known. The mean of two samples can also be compared using the t test.
- One sample: t = \(\frac{\overline{x}-\mu}{\frac{s}{\sqrt{n}}}\).
- Two samples: t = \(\frac{(\overline{x_{1}}-\overline{x_{2}})-(\mu_{1}-\mu_{2})}{\sqrt{\frac{s_{1}^{2}}{n_{1}}+\frac{s_{2}^{2}}{n_{2}}}}\).
Hypothesis Testing Chi Square
The Chi square test is a hypothesis testing method that is used to check whether the variables in a population are independent or not. It is used when the test statistic is chi-squared distributed.
One Tailed Hypothesis Testing
One tailed hypothesis testing is done when the rejection region is only in one direction. It can also be known as directional hypothesis testing because the effects can be tested in one direction only. This type of testing is further classified into the right tailed test and left tailed test.
Right Tailed Hypothesis Testing
The right tail test is also known as the upper tail test. This test is used to check whether the population parameter is greater than some value. The null and alternative hypotheses for this test are given as follows:
\(H_{0}\): The population parameter is ≤ some value
\(H_{1}\): The population parameter is > some value.
If the test statistic has a greater value than the critical value then the null hypothesis is rejected

Left Tailed Hypothesis Testing
The left tail test is also known as the lower tail test. It is used to check whether the population parameter is less than some value. The hypotheses for this hypothesis testing can be written as follows:
\(H_{0}\): The population parameter is ≥ some value
\(H_{1}\): The population parameter is < some value.
The null hypothesis is rejected if the test statistic has a value lesser than the critical value.

Two Tailed Hypothesis Testing
In this hypothesis testing method, the critical region lies on both sides of the sampling distribution. It is also known as a non - directional hypothesis testing method. The two-tailed test is used when it needs to be determined if the population parameter is assumed to be different than some value. The hypotheses can be set up as follows:
\(H_{0}\): the population parameter = some value
\(H_{1}\): the population parameter ≠ some value
The null hypothesis is rejected if the test statistic has a value that is not equal to the critical value.

Hypothesis Testing Steps
Hypothesis testing can be easily performed in five simple steps. The most important step is to correctly set up the hypotheses and identify the right method for hypothesis testing. The basic steps to perform hypothesis testing are as follows:
- Step 1: Set up the null hypothesis by correctly identifying whether it is the left-tailed, right-tailed, or two-tailed hypothesis testing.
- Step 2: Set up the alternative hypothesis.
- Step 3: Choose the correct significance level, \(\alpha\), and find the critical value.
- Step 4: Calculate the correct test statistic (z, t or \(\chi\)) and p-value.
- Step 5: Compare the test statistic with the critical value or compare the p-value with \(\alpha\) to arrive at a conclusion. In other words, decide if the null hypothesis is to be rejected or not.
Hypothesis Testing Example
The best way to solve a problem on hypothesis testing is by applying the 5 steps mentioned in the previous section. Suppose a researcher claims that the mean average weight of men is greater than 100kgs with a standard deviation of 15kgs. 30 men are chosen with an average weight of 112.5 Kgs. Using hypothesis testing, check if there is enough evidence to support the researcher's claim. The confidence interval is given as 95%.
Step 1: This is an example of a right-tailed test. Set up the null hypothesis as \(H_{0}\): \(\mu\) = 100.
Step 2: The alternative hypothesis is given by \(H_{1}\): \(\mu\) > 100.
Step 3: As this is a one-tailed test, \(\alpha\) = 100% - 95% = 5%. This can be used to determine the critical value.
1 - \(\alpha\) = 1 - 0.05 = 0.95
0.95 gives the required area under the curve. Now using a normal distribution table, the area 0.95 is at z = 1.645. A similar process can be followed for a t-test. The only additional requirement is to calculate the degrees of freedom given by n - 1.
Step 4: Calculate the z test statistic. This is because the sample size is 30. Furthermore, the sample and population means are known along with the standard deviation.
z = \(\frac{\overline{x}-\mu}{\frac{\sigma}{\sqrt{n}}}\).
\(\mu\) = 100, \(\overline{x}\) = 112.5, n = 30, \(\sigma\) = 15
z = \(\frac{112.5-100}{\frac{15}{\sqrt{30}}}\) = 4.56
Step 5: Conclusion. As 4.56 > 1.645 thus, the null hypothesis can be rejected.
Hypothesis Testing and Confidence Intervals
Confidence intervals form an important part of hypothesis testing. This is because the alpha level can be determined from a given confidence interval. Suppose a confidence interval is given as 95%. Subtract the confidence interval from 100%. This gives 100 - 95 = 5% or 0.05. This is the alpha value of a one-tailed hypothesis testing. To obtain the alpha value for a two-tailed hypothesis testing, divide this value by 2. This gives 0.05 / 2 = 0.025.
Related Articles:
- Probability and Statistics
- Data Handling
Important Notes on Hypothesis Testing
- Hypothesis testing is a technique that is used to verify whether the results of an experiment are statistically significant.
- It involves the setting up of a null hypothesis and an alternate hypothesis.
- There are three types of tests that can be conducted under hypothesis testing - z test, t test, and chi square test.
- Hypothesis testing can be classified as right tail, left tail, and two tail tests.
Examples on Hypothesis Testing
- Example 1: The average weight of a dumbbell in a gym is 90lbs. However, a physical trainer believes that the average weight might be higher. A random sample of 5 dumbbells with an average weight of 110lbs and a standard deviation of 18lbs. Using hypothesis testing check if the physical trainer's claim can be supported for a 95% confidence level. Solution: As the sample size is lesser than 30, the t-test is used. \(H_{0}\): \(\mu\) = 90, \(H_{1}\): \(\mu\) > 90 \(\overline{x}\) = 110, \(\mu\) = 90, n = 5, s = 18. \(\alpha\) = 0.05 Using the t-distribution table, the critical value is 2.132 t = \(\frac{\overline{x}-\mu}{\frac{s}{\sqrt{n}}}\) t = 2.484 As 2.484 > 2.132, the null hypothesis is rejected. Answer: The average weight of the dumbbells may be greater than 90lbs
- Example 2: The average score on a test is 80 with a standard deviation of 10. With a new teaching curriculum introduced it is believed that this score will change. On random testing, the score of 38 students, the mean was found to be 88. With a 0.05 significance level, is there any evidence to support this claim? Solution: This is an example of two-tail hypothesis testing. The z test will be used. \(H_{0}\): \(\mu\) = 80, \(H_{1}\): \(\mu\) ≠ 80 \(\overline{x}\) = 88, \(\mu\) = 80, n = 36, \(\sigma\) = 10. \(\alpha\) = 0.05 / 2 = 0.025 The critical value using the normal distribution table is 1.96 z = \(\frac{\overline{x}-\mu}{\frac{\sigma}{\sqrt{n}}}\) z = \(\frac{88-80}{\frac{10}{\sqrt{36}}}\) = 4.8 As 4.8 > 1.96, the null hypothesis is rejected. Answer: There is a difference in the scores after the new curriculum was introduced.
- Example 3: The average score of a class is 90. However, a teacher believes that the average score might be lower. The scores of 6 students were randomly measured. The mean was 82 with a standard deviation of 18. With a 0.05 significance level use hypothesis testing to check if this claim is true. Solution: The t test will be used. \(H_{0}\): \(\mu\) = 90, \(H_{1}\): \(\mu\) < 90 \(\overline{x}\) = 110, \(\mu\) = 90, n = 6, s = 18 The critical value from the t table is -2.015 t = \(\frac{\overline{x}-\mu}{\frac{s}{\sqrt{n}}}\) t = \(\frac{82-90}{\frac{18}{\sqrt{6}}}\) t = -1.088 As -1.088 > -2.015, we fail to reject the null hypothesis. Answer: There is not enough evidence to support the claim.
go to slide go to slide go to slide

Book a Free Trial Class
FAQs on Hypothesis Testing
What is hypothesis testing.
Hypothesis testing in statistics is a tool that is used to make inferences about the population data. It is also used to check if the results of an experiment are valid.
What is the z Test in Hypothesis Testing?
The z test in hypothesis testing is used to find the z test statistic for normally distributed data . The z test is used when the standard deviation of the population is known and the sample size is greater than or equal to 30.
What is the t Test in Hypothesis Testing?
The t test in hypothesis testing is used when the data follows a student t distribution . It is used when the sample size is less than 30 and standard deviation of the population is not known.
What is the formula for z test in Hypothesis Testing?
The formula for a one sample z test in hypothesis testing is z = \(\frac{\overline{x}-\mu}{\frac{\sigma}{\sqrt{n}}}\) and for two samples is z = \(\frac{(\overline{x_{1}}-\overline{x_{2}})-(\mu_{1}-\mu_{2})}{\sqrt{\frac{\sigma_{1}^{2}}{n_{1}}+\frac{\sigma_{2}^{2}}{n_{2}}}}\).
What is the p Value in Hypothesis Testing?
The p value helps to determine if the test results are statistically significant or not. In hypothesis testing, the null hypothesis can either be rejected or not rejected based on the comparison between the p value and the alpha level.
What is One Tail Hypothesis Testing?
When the rejection region is only on one side of the distribution curve then it is known as one tail hypothesis testing. The right tail test and the left tail test are two types of directional hypothesis testing.
What is the Alpha Level in Two Tail Hypothesis Testing?
To get the alpha level in a two tail hypothesis testing divide \(\alpha\) by 2. This is done as there are two rejection regions in the curve.

Want to create or adapt books like this? Learn more about how Pressbooks supports open publishing practices.
11 Hypothesis Testing with One Sample
Student learning outcomes.
By the end of this chapter, the student should be able to:
- Be able to identify and develop the null and alternative hypothesis
- Identify the consequences of Type I and Type II error.
- Be able to perform an one-tailed and two-tailed hypothesis test using the critical value method
- Be able to perform a hypothesis test using the p-value method
- Be able to write conclusions based on hypothesis tests.
Introduction
Now we are down to the bread and butter work of the statistician: developing and testing hypotheses. It is important to put this material in a broader context so that the method by which a hypothesis is formed is understood completely. Using textbook examples often clouds the real source of statistical hypotheses.
Statistical testing is part of a much larger process known as the scientific method. This method was developed more than two centuries ago as the accepted way that new knowledge could be created. Until then, and unfortunately even today, among some, “knowledge” could be created simply by some authority saying something was so, ipso dicta . Superstition and conspiracy theories were (are?) accepted uncritically.
The scientific method, briefly, states that only by following a careful and specific process can some assertion be included in the accepted body of knowledge. This process begins with a set of assumptions upon which a theory, sometimes called a model, is built. This theory, if it has any validity, will lead to predictions; what we call hypotheses.
As an example, in Microeconomics the theory of consumer choice begins with certain assumption concerning human behavior. From these assumptions a theory of how consumers make choices using indifference curves and the budget line. This theory gave rise to a very important prediction, namely, that there was an inverse relationship between price and quantity demanded. This relationship was known as the demand curve. The negative slope of the demand curve is really just a prediction, or a hypothesis, that can be tested with statistical tools.
Unless hundreds and hundreds of statistical tests of this hypothesis had not confirmed this relationship, the so-called Law of Demand would have been discarded years ago. This is the role of statistics, to test the hypotheses of various theories to determine if they should be admitted into the accepted body of knowledge; how we understand our world. Once admitted, however, they may be later discarded if new theories come along that make better predictions.
Not long ago two scientists claimed that they could get more energy out of a process than was put in. This caused a tremendous stir for obvious reasons. They were on the cover of Time and were offered extravagant sums to bring their research work to private industry and any number of universities. It was not long until their work was subjected to the rigorous tests of the scientific method and found to be a failure. No other lab could replicate their findings. Consequently they have sunk into obscurity and their theory discarded. It may surface again when someone can pass the tests of the hypotheses required by the scientific method, but until then it is just a curiosity. Many pure frauds have been attempted over time, but most have been found out by applying the process of the scientific method.
This discussion is meant to show just where in this process statistics falls. Statistics and statisticians are not necessarily in the business of developing theories, but in the business of testing others’ theories. Hypotheses come from these theories based upon an explicit set of assumptions and sound logic. The hypothesis comes first, before any data are gathered. Data do not create hypotheses; they are used to test them. If we bear this in mind as we study this section the process of forming and testing hypotheses will make more sense.
One job of a statistician is to make statistical inferences about populations based on samples taken from the population. Confidence intervals are one way to estimate a population parameter. Another way to make a statistical inference is to make a decision about the value of a specific parameter. For instance, a car dealer advertises that its new small truck gets 35 miles per gallon, on average. A tutoring service claims that its method of tutoring helps 90% of its students get an A or a B. A company says that women managers in their company earn an average of $60,000 per year.
A statistician will make a decision about these claims. This process is called ” hypothesis testing .” A hypothesis test involves collecting data from a sample and evaluating the data. Then, the statistician makes a decision as to whether or not there is sufficient evidence, based upon analyses of the data, to reject the null hypothesis.
In this chapter, you will conduct hypothesis tests on single means and single proportions. You will also learn about the errors associated with these tests.
Null and Alternative Hypotheses
The actual test begins by considering two hypotheses . They are called the null hypothesis and the alternative hypothesis . These hypotheses contain opposing viewpoints.

Since the null and alternative hypotheses are contradictory, you must examine evidence to decide if you have enough evidence to reject the null hypothesis or not. The evidence is in the form of sample data.
Table 1 presents the various hypotheses in the relevant pairs. For example, if the null hypothesis is equal to some value, the alternative has to be not equal to that value.
NOTE
We want to test whether the mean GPA of students in American colleges is different from 2.0 (out of 4.0). The null and alternative hypotheses are:

We want to test if college students take less than five years to graduate from college, on the average. The null and alternative hypotheses are:
Outcomes and the Type I and Type II Errors
The four possible outcomes in the table are:
Each of the errors occurs with a particular probability. The Greek letters α and β represent the probabilities.

By way of example, the American judicial system begins with the concept that a defendant is “presumed innocent”. This is the status quo and is the null hypothesis. The judge will tell the jury that they can not find the defendant guilty unless the evidence indicates guilt beyond a “reasonable doubt” which is usually defined in criminal cases as 95% certainty of guilt. If the jury cannot accept the null, innocent, then action will be taken, jail time. The burden of proof always lies with the alternative hypothesis. (In civil cases, the jury needs only to be more than 50% certain of wrongdoing to find culpability, called “a preponderance of the evidence”).
The example above was for a test of a mean, but the same logic applies to tests of hypotheses for all statistical parameters one may wish to test.
The following are examples of Type I and Type II errors.
Type I error : Frank thinks that his rock climbing equipment may not be safe when, in fact, it really is safe.
Type II error : Frank thinks that his rock climbing equipment may be safe when, in fact, it is not safe.
Notice that, in this case, the error with the greater consequence is the Type II error. (If Frank thinks his rock climbing equipment is safe, he will go ahead and use it.)
This is a situation described as “accepting a false null”.
Type I error : The emergency crew thinks that the victim is dead when, in fact, the victim is alive. Type II error : The emergency crew does not know if the victim is alive when, in fact, the victim is dead.
The error with the greater consequence is the Type I error. (If the emergency crew thinks the victim is dead, they will not treat him.)
Distribution Needed for Hypothesis Testing
Particular distributions are associated with hypothesis testing.We will perform hypotheses tests of a population mean using a normal distribution or a Student’s t -distribution. (Remember, use a Student’s t -distribution when the population standard deviation is unknown and the sample size is small, where small is considered to be less than 30 observations.) We perform tests of a population proportion using a normal distribution when we can assume that the distribution is normally distributed. We consider this to be true if the sample proportion, p ‘ , times the sample size is greater than 5 and 1- p ‘ times the sample size is also greater then 5. This is the same rule of thumb we used when developing the formula for the confidence interval for a population proportion.
Hypothesis Test for the Mean
Going back to the standardizing formula we can derive the test statistic for testing hypotheses concerning means.

This gives us the decision rule for testing a hypothesis for a two-tailed test:
P-Value Approach
Both decision rules will result in the same decision and it is a matter of preference which one is used.
One and Two-tailed Tests

The claim would be in the alternative hypothesis. The burden of proof in hypothesis testing is carried in the alternative. This is because failing to reject the null, the status quo, must be accomplished with 90 or 95 percent significance that it cannot be maintained. Said another way, we want to have only a 5 or 10 percent probability of making a Type I error, rejecting a good null; overthrowing the status quo.
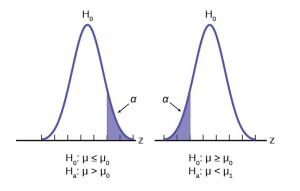
Figure 5 shows the two possible cases and the form of the null and alternative hypothesis that give rise to them.
Effects of Sample Size on Test Statistic

Table 3 summarizes test statistics for varying sample sizes and population standard deviation known and unknown.
A Systematic Approach for Testing A Hypothesis
A systematic approach to hypothesis testing follows the following steps and in this order. This template will work for all hypotheses that you will ever test.
- Set up the null and alternative hypothesis. This is typically the hardest part of the process. Here the question being asked is reviewed. What parameter is being tested, a mean, a proportion, differences in means, etc. Is this a one-tailed test or two-tailed test? Remember, if someone is making a claim it will always be a one-tailed test.
- Decide the level of significance required for this particular case and determine the critical value. These can be found in the appropriate statistical table. The levels of confidence typical for the social sciences are 90, 95 and 99. However, the level of significance is a policy decision and should be based upon the risk of making a Type I error, rejecting a good null. Consider the consequences of making a Type I error.
- Take a sample(s) and calculate the relevant parameters: sample mean, standard deviation, or proportion. Using the formula for the test statistic from above in step 2, now calculate the test statistic for this particular case using the parameters you have just calculated.
- Compare the calculated test statistic and the critical value. Marking these on the graph will give a good visual picture of the situation. There are now only two situations:
a. The test statistic is in the tail: Cannot Accept the null, the probability that this sample mean (proportion) came from the hypothesized distribution is too small to believe that it is the real home of these sample data.
b. The test statistic is not in the tail: Cannot Reject the null, the sample data are compatible with the hypothesized population parameter.
- Reach a conclusion. It is best to articulate the conclusion two different ways. First a formal statistical conclusion such as “With a 95 % level of significance we cannot accept the null hypotheses that the population mean is equal to XX (units of measurement)”. The second statement of the conclusion is less formal and states the action, or lack of action, required. If the formal conclusion was that above, then the informal one might be, “The machine is broken and we need to shut it down and call for repairs”.
All hypotheses tested will go through this same process. The only changes are the relevant formulas and those are determined by the hypothesis required to answer the original question.
Full Hypothesis Test Examples
Tests on means.
Jeffrey, as an eight-year old, established a mean time of 16.43 seconds for swimming the 25-yard freestyle, with a standard deviation of 0.8 seconds . His dad, Frank, thought that Jeffrey could swim the 25-yard freestyle faster using goggles. Frank bought Jeffrey a new pair of expensive goggles and timed Jeffrey for 15 25-yard freestyle swims . For the 15 swims, Jeffrey’s mean time was 16 seconds. Frank thought that the goggles helped Jeffrey to swim faster than the 16.43 seconds. Conduct a hypothesis test using a preset α = 0.05.
Solution – Example 6
Set up the Hypothesis Test:
Since the problem is about a mean, this is a test of a single population mean . Set the null and alternative hypothesis:
In this case there is an implied challenge or claim. This is that the goggles will reduce the swimming time. The effect of this is to set the hypothesis as a one-tailed test. The claim will always be in the alternative hypothesis because the burden of proof always lies with the alternative. Remember that the status quo must be defeated with a high degree of confidence, in this case 95 % confidence. The null and alternative hypotheses are thus:
For Jeffrey to swim faster, his time will be less than 16.43 seconds. The “<” tells you this is left-tailed. Determine the distribution needed:
Distribution for the test statistic:
The sample size is less than 30 and we do not know the population standard deviation so this is a t-test and the proper formula is:

Our step 2, setting the level of significance, has already been determined by the problem, .05 for a 95 % significance level. It is worth thinking about the meaning of this choice. The Type I error is to conclude that Jeffrey swims the 25-yard freestyle, on average, in less than 16.43 seconds when, in fact, he actually swims the 25-yard freestyle, on average, in 16.43 seconds. (Reject the null hypothesis when the null hypothesis is true.) For this case the only concern with a Type I error would seem to be that Jeffery’s dad may fail to bet on his son’s victory because he does not have appropriate confidence in the effect of the goggles.
To find the critical value we need to select the appropriate test statistic. We have concluded that this is a t-test on the basis of the sample size and that we are interested in a population mean. We can now draw the graph of the t-distribution and mark the critical value (Figure 6). For this problem the degrees of freedom are n-1, or 14. Looking up 14 degrees of freedom at the 0.05 column of the t-table we find 1.761. This is the critical value and we can put this on our graph.
Step 3 is the calculation of the test statistic using the formula we have selected.

We find that the calculated test statistic is 2.08, meaning that the sample mean is 2.08 standard deviations away from the hypothesized mean of 16.43.
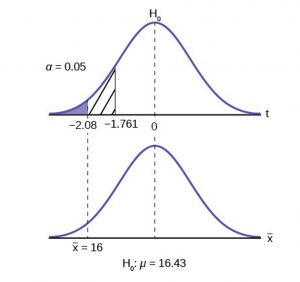
Step 4 has us compare the test statistic and the critical value and mark these on the graph. We see that the test statistic is in the tail and thus we move to step 4 and reach a conclusion. The probability that an average time of 16 minutes could come from a distribution with a population mean of 16.43 minutes is too unlikely for us to accept the null hypothesis. We cannot accept the null.
Step 5 has us state our conclusions first formally and then less formally. A formal conclusion would be stated as: “With a 95% level of significance we cannot accept the null hypothesis that the swimming time with goggles comes from a distribution with a population mean time of 16.43 minutes.” Less formally, “With 95% significance we believe that the goggles improves swimming speed”
If we wished to use the p-value system of reaching a conclusion we would calculate the statistic and take the additional step to find the probability of being 2.08 standard deviations from the mean on a t-distribution. This value is .0187. Comparing this to the α-level of .05 we see that we cannot accept the null. The p-value has been put on the graph as the shaded area beyond -2.08 and it shows that it is smaller than the hatched area which is the alpha level of 0.05. Both methods reach the same conclusion that we cannot accept the null hypothesis.
Jane has just begun her new job as on the sales force of a very competitive company. In a sample of 16 sales calls it was found that she closed the contract for an average value of $108 with a standard deviation of 12 dollars. Test at 5% significance that the population mean is at least $100 against the alternative that it is less than 100 dollars. Company policy requires that new members of the sales force must exceed an average of $100 per contract during the trial employment period. Can we conclude that Jane has met this requirement at the significance level of 95%?
Solution – Example 7
STEP 1 : Set the Null and Alternative Hypothesis.
STEP 2 : Decide the level of significance and draw the graph (Figure 7) showing the critical value.

STEP 3 : Calculate sample parameters and the test statistic.

STEP 4 : Compare test statistic and the critical values
STEP 5 : Reach a Conclusion
The test statistic is a Student’s t because the sample size is below 30; therefore, we cannot use the normal distribution. Comparing the calculated value of the test statistic and the critical value of t ( t a ) at a 5% significance level, we see that the calculated value is in the tail of the distribution. Thus, we conclude that 108 dollars per contract is significantly larger than the hypothesized value of 100 and thus we cannot accept the null hypothesis. There is evidence that supports Jane’s performance meets company standards.

Again we will follow the steps in our analysis of this problem.
Solution – Example 8
STEP 1 : Set the Null and Alternative Hypothesis. The random variable is the quantity of fluid placed in the bottles. This is a continuous random variable and the parameter we are interested in is the mean. Our hypothesis therefore is about the mean. In this case we are concerned that the machine is not filling properly. From what we are told it does not matter if the machine is over-filling or under-filling, both seem to be an equally bad error. This tells us that this is a two-tailed test: if the machine is malfunctioning it will be shutdown regardless if it is from over-filling or under-filling. The null and alternative hypotheses are thus:
STEP 2 : Decide the level of significance and draw the graph showing the critical value.
This problem has already set the level of significance at 99%. The decision seems an appropriate one and shows the thought process when setting the significance level. Management wants to be very certain, as certain as probability will allow, that they are not shutting down a machine that is not in need of repair. To draw the distribution and the critical value, we need to know which distribution to use. Because this is a continuous random variable and we are interested in the mean, and the sample size is greater than 30, the appropriate distribution is the normal distribution and the relevant critical value is 2.575 from the normal table or the t-table at 0.005 column and infinite degrees of freedom. We draw the graph and mark these points (Figure 8).
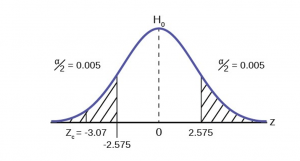
STEP 3 : Calculate sample parameters and the test statistic. The sample parameters are provided, the sample mean is 7.91 and the sample variance is .03 and the sample size is 35. We need to note that the sample variance was provided not the sample standard deviation, which is what we need for the formula. Remembering that the standard deviation is simply the square root of the variance, we therefore know the sample standard deviation, s, is 0.173. With this information we calculate the test statistic as -3.07, and mark it on the graph.

STEP 4 : Compare test statistic and the critical values Now we compare the test statistic and the critical value by placing the test statistic on the graph. We see that the test statistic is in the tail, decidedly greater than the critical value of 2.575. We note that even the very small difference between the hypothesized value and the sample value is still a large number of standard deviations. The sample mean is only 0.08 ounces different from the required level of 8 ounces, but it is 3 plus standard deviations away and thus we cannot accept the null hypothesis.
Three standard deviations of a test statistic will guarantee that the test will fail. The probability that anything is within three standard deviations is almost zero. Actually it is 0.0026 on the normal distribution, which is certainly almost zero in a practical sense. Our formal conclusion would be “ At a 99% level of significance we cannot accept the hypothesis that the sample mean came from a distribution with a mean of 8 ounces” Or less formally, and getting to the point, “At a 99% level of significance we conclude that the machine is under filling the bottles and is in need of repair”.
Media Attributions
- Type1Type2Error
- HypTestFig2
- HypTestFig3
- HypTestPValue
- OneTailTestFig5
- HypTestExam7
- HypTestExam8
Quantitative Analysis for Business Copyright © by Margo Bergman is licensed under a Creative Commons Attribution-NonCommercial-ShareAlike 4.0 International License , except where otherwise noted.
Share This Book

User Preferences
Content preview.
Arcu felis bibendum ut tristique et egestas quis:
- Ut enim ad minim veniam, quis nostrud exercitation ullamco laboris
- Duis aute irure dolor in reprehenderit in voluptate
- Excepteur sint occaecat cupidatat non proident
Keyboard Shortcuts
6a.2 - steps for hypothesis tests, the logic of hypothesis testing section .
A hypothesis, in statistics, is a statement about a population parameter, where this statement typically is represented by some specific numerical value. In testing a hypothesis, we use a method where we gather data in an effort to gather evidence about the hypothesis.
How do we decide whether to reject the null hypothesis?
- If the sample data are consistent with the null hypothesis, then we do not reject it.
- If the sample data are inconsistent with the null hypothesis, but consistent with the alternative, then we reject the null hypothesis and conclude that the alternative hypothesis is true.
Six Steps for Hypothesis Tests Section
In hypothesis testing, there are certain steps one must follow. Below these are summarized into six such steps to conducting a test of a hypothesis.
- Set up the hypotheses and check conditions : Each hypothesis test includes two hypotheses about the population. One is the null hypothesis, notated as \(H_0 \), which is a statement of a particular parameter value. This hypothesis is assumed to be true until there is evidence to suggest otherwise. The second hypothesis is called the alternative, or research hypothesis, notated as \(H_a \). The alternative hypothesis is a statement of a range of alternative values in which the parameter may fall. One must also check that any conditions (assumptions) needed to run the test have been satisfied e.g. normality of data, independence, and number of success and failure outcomes.
- Decide on the significance level, \(\alpha \): This value is used as a probability cutoff for making decisions about the null hypothesis. This alpha value represents the probability we are willing to place on our test for making an incorrect decision in regards to rejecting the null hypothesis. The most common \(\alpha \) value is 0.05 or 5%. Other popular choices are 0.01 (1%) and 0.1 (10%).
- Calculate the test statistic: Gather sample data and calculate a test statistic where the sample statistic is compared to the parameter value. The test statistic is calculated under the assumption the null hypothesis is true and incorporates a measure of standard error and assumptions (conditions) related to the sampling distribution.
- Calculate probability value (p-value), or find the rejection region: A p-value is found by using the test statistic to calculate the probability of the sample data producing such a test statistic or one more extreme. The rejection region is found by using alpha to find a critical value; the rejection region is the area that is more extreme than the critical value. We discuss the p-value and rejection region in more detail in the next section.
- Make a decision about the null hypothesis: In this step, we decide to either reject the null hypothesis or decide to fail to reject the null hypothesis. Notice we do not make a decision where we will accept the null hypothesis.
- State an overall conclusion : Once we have found the p-value or rejection region, and made a statistical decision about the null hypothesis (i.e. we will reject the null or fail to reject the null), we then want to summarize our results into an overall conclusion for our test.
We will follow these six steps for the remainder of this Lesson. In the future Lessons, the steps will be followed but may not be explained explicitly.
Step 1 is a very important step to set up correctly. If your hypotheses are incorrect, your conclusion will be incorrect. In this next section, we practice with Step 1 for the one sample situations.
- Search Search Please fill out this field.
What Is Hypothesis Testing?
- How It Works
4 Step Process
The bottom line.
- Fundamental Analysis
Hypothesis Testing: 4 Steps and Example
:max_bytes(150000):strip_icc():format(webp)/ChristinaMajaski-5c9433ea46e0fb0001d880b1.jpeg "what is an example of a hypothesis testing problem")
Hypothesis testing, sometimes called significance testing, is an act in statistics whereby an analyst tests an assumption regarding a population parameter. The methodology employed by the analyst depends on the nature of the data used and the reason for the analysis.
Hypothesis testing is used to assess the plausibility of a hypothesis by using sample data. Such data may come from a larger population or a data-generating process. The word "population" will be used for both of these cases in the following descriptions.
Key Takeaways
- Hypothesis testing is used to assess the plausibility of a hypothesis by using sample data.
- The test provides evidence concerning the plausibility of the hypothesis, given the data.
- Statistical analysts test a hypothesis by measuring and examining a random sample of the population being analyzed.
- The four steps of hypothesis testing include stating the hypotheses, formulating an analysis plan, analyzing the sample data, and analyzing the result.
How Hypothesis Testing Works
In hypothesis testing, an analyst tests a statistical sample, intending to provide evidence on the plausibility of the null hypothesis. Statistical analysts measure and examine a random sample of the population being analyzed. All analysts use a random population sample to test two different hypotheses: the null hypothesis and the alternative hypothesis.
The null hypothesis is usually a hypothesis of equality between population parameters; e.g., a null hypothesis may state that the population mean return is equal to zero. The alternative hypothesis is effectively the opposite of a null hypothesis. Thus, they are mutually exclusive , and only one can be true. However, one of the two hypotheses will always be true.
The null hypothesis is a statement about a population parameter, such as the population mean, that is assumed to be true.
- State the hypotheses.
- Formulate an analysis plan, which outlines how the data will be evaluated.
- Carry out the plan and analyze the sample data.
- Analyze the results and either reject the null hypothesis, or state that the null hypothesis is plausible, given the data.
Example of Hypothesis Testing
If an individual wants to test that a penny has exactly a 50% chance of landing on heads, the null hypothesis would be that 50% is correct, and the alternative hypothesis would be that 50% is not correct. Mathematically, the null hypothesis is represented as Ho: P = 0.5. The alternative hypothesis is shown as "Ha" and is identical to the null hypothesis, except with the equal sign struck-through, meaning that it does not equal 50%.
A random sample of 100 coin flips is taken, and the null hypothesis is tested. If it is found that the 100 coin flips were distributed as 40 heads and 60 tails, the analyst would assume that a penny does not have a 50% chance of landing on heads and would reject the null hypothesis and accept the alternative hypothesis.
If there were 48 heads and 52 tails, then it is plausible that the coin could be fair and still produce such a result. In cases such as this where the null hypothesis is "accepted," the analyst states that the difference between the expected results (50 heads and 50 tails) and the observed results (48 heads and 52 tails) is "explainable by chance alone."
When Did Hypothesis Testing Begin?
Some statisticians attribute the first hypothesis tests to satirical writer John Arbuthnot in 1710, who studied male and female births in England after observing that in nearly every year, male births exceeded female births by a slight proportion. Arbuthnot calculated that the probability of this happening by chance was small, and therefore it was due to “divine providence.”
What are the Benefits of Hypothesis Testing?
Hypothesis testing helps assess the accuracy of new ideas or theories by testing them against data. This allows researchers to determine whether the evidence supports their hypothesis, helping to avoid false claims and conclusions. Hypothesis testing also provides a framework for decision-making based on data rather than personal opinions or biases. By relying on statistical analysis, hypothesis testing helps to reduce the effects of chance and confounding variables, providing a robust framework for making informed conclusions.
What are the Limitations of Hypothesis Testing?
Hypothesis testing relies exclusively on data and doesn’t provide a comprehensive understanding of the subject being studied. Additionally, the accuracy of the results depends on the quality of the available data and the statistical methods used. Inaccurate data or inappropriate hypothesis formulation may lead to incorrect conclusions or failed tests. Hypothesis testing can also lead to errors, such as analysts either accepting or rejecting a null hypothesis when they shouldn’t have. These errors may result in false conclusions or missed opportunities to identify significant patterns or relationships in the data.
Hypothesis testing refers to a statistical process that helps researchers determine the reliability of a study. By using a well-formulated hypothesis and set of statistical tests, individuals or businesses can make inferences about the population that they are studying and draw conclusions based on the data presented. All hypothesis testing methods have the same four-step process, which includes stating the hypotheses, formulating an analysis plan, analyzing the sample data, and analyzing the result.
Sage. " Introduction to Hypothesis Testing ," Page 4.
Elder Research. " Who Invented the Null Hypothesis? "
Formplus. " Hypothesis Testing: Definition, Uses, Limitations and Examples ."
:max_bytes(150000):strip_icc():format(webp)/z-test.asp-final-81378e9e20704163ba30aad511c16e5d.jpg "what is an example of a hypothesis testing problem")
- Terms of Service
- Editorial Policy
- Privacy Policy
- Your Privacy Choices

- school Campus Bookshelves
- menu_book Bookshelves
- perm_media Learning Objects
- login Login
- how_to_reg Request Instructor Account
- hub Instructor Commons
- Download Page (PDF)
- Download Full Book (PDF)
- Periodic Table
- Physics Constants
- Scientific Calculator
- Reference & Cite
- Tools expand_more
- Readability
selected template will load here
This action is not available.
8.4: Hypothesis Test Examples for Proportions
- Last updated
- Save as PDF
- Page ID 11533

- In a hypothesis test problem, you may see words such as "the level of significance is 1%." The "1%" is the preconceived or preset \(\alpha\).
- The statistician setting up the hypothesis test selects the value of α to use before collecting the sample data.
- If no level of significance is given, a common standard to use is \(\alpha = 0.05\).
- When you calculate the \(p\)-value and draw the picture, the \(p\)-value is the area in the left tail, the right tail, or split evenly between the two tails. For this reason, we call the hypothesis test left, right, or two tailed.
- The alternative hypothesis, \(H_{a}\), tells you if the test is left, right, or two-tailed. It is the key to conducting the appropriate test.
- \(H_{a}\) never has a symbol that contains an equal sign.
- Thinking about the meaning of the \(p\)-value: A data analyst (and anyone else) should have more confidence that he made the correct decision to reject the null hypothesis with a smaller \(p\)-value (for example, 0.001 as opposed to 0.04) even if using the 0.05 level for alpha. Similarly, for a large p -value such as 0.4, as opposed to a \(p\)-value of 0.056 (\(\alpha = 0.05\) is less than either number), a data analyst should have more confidence that she made the correct decision in not rejecting the null hypothesis. This makes the data analyst use judgment rather than mindlessly applying rules.
Full Hypothesis Test Examples
Example \(\PageIndex{7}\)
Joon believes that 50% of first-time brides in the United States are younger than their grooms. She performs a hypothesis test to determine if the percentage is the same or different from 50% . Joon samples 100 first-time brides and 53 reply that they are younger than their grooms. For the hypothesis test, she uses a 1% level of significance.
Set up the hypothesis test:
The 1% level of significance means that α = 0.01. This is a test of a single population proportion .
\(H_{0}: p = 0.50\) \(H_{a}: p \neq 0.50\)
The words "is the same or different from" tell you this is a two-tailed test.
Calculate the distribution needed:
Random variable: \(P′ =\) the percent of of first-time brides who are younger than their grooms.
Distribution for the test: The problem contains no mention of a mean. The information is given in terms of percentages. Use the distribution for P′ , the estimated proportion.
\[P' - N\left(p, \sqrt{\frac{p-q}{n}}\right)\nonumber \]
\[P' - N\left(0.5, \sqrt{\frac{0.5-0.5}{100}}\right)\nonumber \]
where \(p = 0.50, q = 1−p = 0.50\), and \(n = 100\)
Calculate the p -value using the normal distribution for proportions:
\[p\text{-value} = P(p′ < 0.47 or p′ > 0.53) = 0.5485\nonumber \]
where \[x = 53, p' = \frac{x}{n} = \frac{53}{100} = 0.53\nonumber \].
Interpretation of the \(p\text{-value})\: If the null hypothesis is true, there is 0.5485 probability (54.85%) that the sample (estimated) proportion \(p'\) is 0.53 or more OR 0.47 or less (see the graph in Figure).

\(\mu = p = 0.50\) comes from \(H_{0}\), the null hypothesis.
\(p′ = 0.53\). Since the curve is symmetrical and the test is two-tailed, the \(p′\) for the left tail is equal to \(0.50 – 0.03 = 0.47\) where \(\mu = p = 0.50\). (0.03 is the difference between 0.53 and 0.50.)
Compare \(\alpha\) and the \(p\text{-value}\):
Since \(\alpha = 0.01\) and \(p\text{-value} = 0.5485\). \(\alpha < p\text{-value}\).
Make a decision: Since \(\alpha < p\text{-value}\), you cannot reject \(H_{0}\).
Conclusion: At the 1% level of significance, the sample data do not show sufficient evidence that the percentage of first-time brides who are younger than their grooms is different from 50%.
The \(p\text{-value}\) can easily be calculated.
Press STAT and arrow over to TESTS . Press 5:1-PropZTest . Enter .5 for \(p_{0}\), 53 for \(x\) and 100 for \(n\). Arrow down to Prop and arrow to not equals \(p_{0}\). Press ENTER . Arrow down to Calculate and press ENTER . The calculator calculates the \(p\text{-value}\) (\(p = 0.5485\)) and the test statistic (\(z\)-score). Prop not equals .5 is the alternate hypothesis. Do this set of instructions again except arrow to Draw (instead of Calculate ). Press ENTER . A shaded graph appears with \(\(z\) = 0.6\) (test statistic) and \(p = 0.5485\) (\(p\text{-value}\)). Make sure when you use Draw that no other equations are highlighted in \(Y =\) and the plots are turned off.
The Type I and Type II errors are as follows:
The Type I error is to conclude that the proportion of first-time brides who are younger than their grooms is different from 50% when, in fact, the proportion is actually 50%. (Reject the null hypothesis when the null hypothesis is true).
The Type II error is there is not enough evidence to conclude that the proportion of first time brides who are younger than their grooms differs from 50% when, in fact, the proportion does differ from 50%. (Do not reject the null hypothesis when the null hypothesis is false.)
Exercise \(\PageIndex{7}\)
A teacher believes that 85% of students in the class will want to go on a field trip to the local zoo. She performs a hypothesis test to determine if the percentage is the same or different from 85%. The teacher samples 50 students and 39 reply that they would want to go to the zoo. For the hypothesis test, use a 1% level of significance.
First, determine what type of test this is, set up the hypothesis test, find the \(p\text{-value}\), sketch the graph, and state your conclusion.
Since the problem is about percentages, this is a test of single population proportions.
- \(H_{0} : p = 0.85\)
- \(H_{a}: p \neq 0.85\)
- \(p = 0.7554\)

Because \(p > \alpha\), we fail to reject the null hypothesis. There is not sufficient evidence to suggest that the proportion of students that want to go to the zoo is not 85%.
Example \(\PageIndex{8}\)
Suppose a consumer group suspects that the proportion of households that have three cell phones is 30%. A cell phone company has reason to believe that the proportion is not 30%. Before they start a big advertising campaign, they conduct a hypothesis test. Their marketing people survey 150 households with the result that 43 of the households have three cell phones.
Set up the Hypothesis Test:
\(H_{0}: p = 0.30, H_{a}: p \neq 0.30\)
Determine the distribution needed:
The random variable is \(P′ =\) proportion of households that have three cell phones.
The distribution for the hypothesis test is \(P' - N\left(0.30, \sqrt{\frac{(0.30 \cdot 0.70)}{150}}\right)\)
Exercise 9.6.8.2
a. The value that helps determine the \(p\text{-value}\) is \(p′\). Calculate \(p′\).
a. \(p' = \frac{x}{n}\) where \(x\) is the number of successes and \(n\) is the total number in the sample.
\(x = 43, n = 150\)
\(p′ = 43150\)
Exercise 9.6.8.3
b. What is a success for this problem?
b. A success is having three cell phones in a household.
Exercise 9.6.8.4
c. What is the level of significance?
c. The level of significance is the preset \(\alpha\). Since \(\alpha\) is not given, assume that \(\alpha = 0.05\).
Exercise 9.6.8.5
d. Draw the graph for this problem. Draw the horizontal axis. Label and shade appropriately.
Calculate the \(p\text{-value}\).
d. \(p\text{-value} = 0.7216\)
Exercise 9.6.8.6
e. Make a decision. _____________(Reject/Do not reject) \(H_{0}\) because____________.
e. Assuming that \(\alpha = 0.05, \alpha < p\text{-value}\). The decision is do not reject \(H_{0}\) because there is not sufficient evidence to conclude that the proportion of households that have three cell phones is not 30%.
Exercise \(\PageIndex{8}\)
Marketers believe that 92% of adults in the United States own a cell phone. A cell phone manufacturer believes that number is actually lower. 200 American adults are surveyed, of which, 174 report having cell phones. Use a 5% level of significance. State the null and alternative hypothesis, find the p -value, state your conclusion, and identify the Type I and Type II errors.
- \(H_{0}: p = 0.92\)
- \(H_{a}: p < 0.92\)
- \(p\text{-value} = 0.0046\)
Because \(p < 0.05\), we reject the null hypothesis. There is sufficient evidence to conclude that fewer than 92% of American adults own cell phones.
- Type I Error: To conclude that fewer than 92% of American adults own cell phones when, in fact, 92% of American adults do own cell phones (reject the null hypothesis when the null hypothesis is true).
- Type II Error: To conclude that 92% of American adults own cell phones when, in fact, fewer than 92% of American adults own cell phones (do not reject the null hypothesis when the null hypothesis is false).
The next example is a poem written by a statistics student named Nicole Hart. The solution to the problem follows the poem. Notice that the hypothesis test is for a single population proportion. This means that the null and alternate hypotheses use the parameter \(p\). The distribution for the test is normal. The estimated proportion \(p′\) is the proportion of fleas killed to the total fleas found on Fido. This is sample information. The problem gives a preconceived \(\alpha = 0.01\), for comparison, and a 95% confidence interval computation. The poem is clever and humorous, so please enjoy it!
Example \(\PageIndex{9}\)
My dog has so many fleas,
They do not come off with ease. As for shampoo, I have tried many types Even one called Bubble Hype, Which only killed 25% of the fleas, Unfortunately I was not pleased.
I've used all kinds of soap, Until I had given up hope Until one day I saw An ad that put me in awe.
A shampoo used for dogs Called GOOD ENOUGH to Clean a Hog Guaranteed to kill more fleas.
I gave Fido a bath And after doing the math His number of fleas Started dropping by 3's! Before his shampoo I counted 42.
At the end of his bath, I redid the math And the new shampoo had killed 17 fleas. So now I was pleased.
Now it is time for you to have some fun With the level of significance being .01, You must help me figure out
Use the new shampoo or go without?
\(H_{0}: p \leq 0.25\) \(H_{a}: p > 0.25\)
In words, CLEARLY state what your random variable \(\bar{X}\) or \(P′\) represents.
\(P′ =\) The proportion of fleas that are killed by the new shampoo
State the distribution to use for the test.
\[N\left(0.25, \sqrt{\frac{(0.25){1-0.25}}{42}}\right)\nonumber \]
Test Statistic: \(z = 2.3163\)
Calculate the \(p\text{-value}\) using the normal distribution for proportions:
\[p\text{-value} = 0.0103\nonumber \]
In one to two complete sentences, explain what the p -value means for this problem.
If the null hypothesis is true (the proportion is 0.25), then there is a 0.0103 probability that the sample (estimated) proportion is 0.4048 \(\left(\frac{17}{42}\right)\) or more.
Use the previous information to sketch a picture of this situation. CLEARLY, label and scale the horizontal axis and shade the region(s) corresponding to the \(p\text{-value}\).

Indicate the correct decision (“reject” or “do not reject” the null hypothesis), the reason for it, and write an appropriate conclusion, using complete sentences.
Conclusion: At the 1% level of significance, the sample data do not show sufficient evidence that the percentage of fleas that are killed by the new shampoo is more than 25%.
Construct a 95% confidence interval for the true mean or proportion. Include a sketch of the graph of the situation. Label the point estimate and the lower and upper bounds of the confidence interval.

Confidence Interval: (0.26,0.55) We are 95% confident that the true population proportion p of fleas that are killed by the new shampoo is between 26% and 55%.
This test result is not very definitive since the \(p\text{-value}\) is very close to alpha. In reality, one would probably do more tests by giving the dog another bath after the fleas have had a chance to return.
Example \(\PageIndex{11}\)
In a study of 420,019 cell phone users, 172 of the subjects developed brain cancer. Test the claim that cell phone users developed brain cancer at a greater rate than that for non-cell phone users (the rate of brain cancer for non-cell phone users is 0.0340%). Since this is a critical issue, use a 0.005 significance level. Explain why the significance level should be so low in terms of a Type I error.
We will follow the four-step process.
- \(H_{0}: p \leq 0.00034\)
- \(H_{a}: p > 0.00034\)
If we commit a Type I error, we are essentially accepting a false claim. Since the claim describes cancer-causing environments, we want to minimize the chances of incorrectly identifying causes of cancer.
- We will be testing a sample proportion with \(x = 172\) and \(n = 420,019\). The sample is sufficiently large because we have \(np = 420,019(0.00034) = 142.8\), \(nq = 420,019(0.99966) = 419,876.2\), two independent outcomes, and a fixed probability of success \(p = 0.00034\). Thus we will be able to generalize our results to the population.
Figure 9.6.11.
Figure 9.6.12.
- Since the \(p\text{-value} = 0.0073\) is greater than our alpha value \(= 0.005\), we cannot reject the null. Therefore, we conclude that there is not enough evidence to support the claim of higher brain cancer rates for the cell phone users.
Example \(\PageIndex{12}\)
According to the US Census there are approximately 268,608,618 residents aged 12 and older. Statistics from the Rape, Abuse, and Incest National Network indicate that, on average, 207,754 rapes occur each year (male and female) for persons aged 12 and older. This translates into a percentage of sexual assaults of 0.078%. In Daviess County, KY, there were reported 11 rapes for a population of 37,937. Conduct an appropriate hypothesis test to determine if there is a statistically significant difference between the local sexual assault percentage and the national sexual assault percentage. Use a significance level of 0.01.
We will follow the four-step plan.
- We need to test whether the proportion of sexual assaults in Daviess County, KY is significantly different from the national average.
- \(H_{0}: p = 0.00078\)
- \(H_{a}: p \neq 0.00078\)
Figure 9.6.13.
Figure 9.6.14.
- Since the \(p\text{-value}\), \(p = 0.00063\), is less than the alpha level of 0.01, the sample data indicates that we should reject the null hypothesis. In conclusion, the sample data support the claim that the proportion of sexual assaults in Daviess County, Kentucky is different from the national average proportion.
The hypothesis test itself has an established process. This can be summarized as follows:
- Determine \(H_{0}\) and \(H_{a}\). Remember, they are contradictory.
- Determine the random variable.
- Determine the distribution for the test.
- Draw a graph, calculate the test statistic, and use the test statistic to calculate the \(p\text{-value}\). (A z -score and a t -score are examples of test statistics.)
- Compare the preconceived α with the p -value, make a decision (reject or do not reject H 0 ), and write a clear conclusion using English sentences.
Notice that in performing the hypothesis test, you use \(\alpha\) and not \(\beta\). \(\beta\) is needed to help determine the sample size of the data that is used in calculating the \(p\text{-value}\). Remember that the quantity \(1 – \beta\) is called the Power of the Test . A high power is desirable. If the power is too low, statisticians typically increase the sample size while keeping α the same.If the power is low, the null hypothesis might not be rejected when it should be.
- Data from Amit Schitai. Director of Instructional Technology and Distance Learning. LBCC.
- Data from Bloomberg Businessweek . Available online at http://www.businessweek.com/news/2011- 09-15/nyc-smoking-rate-falls-to-record-low-of-14-bloomberg-says.html.
- Data from energy.gov. Available online at http://energy.gov (accessed June 27. 2013).
- Data from Gallup®. Available online at www.gallup.com (accessed June 27, 2013).
- Data from Growing by Degrees by Allen and Seaman.
- Data from La Leche League International. Available online at www.lalecheleague.org/Law/BAFeb01.html.
- Data from the American Automobile Association. Available online at www.aaa.com (accessed June 27, 2013).
- Data from the American Library Association. Available online at www.ala.org (accessed June 27, 2013).
- Data from the Bureau of Labor Statistics. Available online at http://www.bls.gov/oes/current/oes291111.htm .
- Data from the Centers for Disease Control and Prevention. Available online at www.cdc.gov (accessed June 27, 2013)
- Data from the U.S. Census Bureau, available online at quickfacts.census.gov/qfd/states/00000.html (accessed June 27, 2013).
- Data from the United States Census Bureau. Available online at www.census.gov/hhes/socdemo/language/.
- Data from Toastmasters International. Available online at http://toastmasters.org/artisan/deta...eID=429&Page=1 .
- Data from Weather Underground. Available online at www.wunderground.com (accessed June 27, 2013).
- Federal Bureau of Investigations. “Uniform Crime Reports and Index of Crime in Daviess in the State of Kentucky enforced by Daviess County from 1985 to 2005.” Available online at http://www.disastercenter.com/kentucky/crime/3868.htm (accessed June 27, 2013).
- “Foothill-De Anza Community College District.” De Anza College, Winter 2006. Available online at research.fhda.edu/factbook/DA...t_da_2006w.pdf.
- Johansen, C., J. Boice, Jr., J. McLaughlin, J. Olsen. “Cellular Telephones and Cancer—a Nationwide Cohort Study in Denmark.” Institute of Cancer Epidemiology and the Danish Cancer Society, 93(3):203-7. Available online at http://www.ncbi.nlm.nih.gov/pubmed/11158188 (accessed June 27, 2013).
- Rape, Abuse & Incest National Network. “How often does sexual assault occur?” RAINN, 2009. Available online at www.rainn.org/get-information...sexual-assault (accessed June 27, 2013).
Contributors and Attributions
Barbara Illowsky and Susan Dean (De Anza College) with many other contributing authors. Content produced by OpenStax College is licensed under a Creative Commons Attribution License 4.0 license. Download for free at http://cnx.org/contents/[email protected] .
Tutorial Playlist
Statistics tutorial, everything you need to know about the probability density function in statistics, the best guide to understand central limit theorem, an in-depth guide to measures of central tendency : mean, median and mode, the ultimate guide to understand conditional probability.
A Comprehensive Look at Percentile in Statistics
The Best Guide to Understand Bayes Theorem
Everything you need to know about the normal distribution, an in-depth explanation of cumulative distribution function, a complete guide to chi-square test, a complete guide on hypothesis testing in statistics, understanding the fundamentals of arithmetic and geometric progression, the definitive guide to understand spearman’s rank correlation, a comprehensive guide to understand mean squared error, all you need to know about the empirical rule in statistics, the complete guide to skewness and kurtosis, a holistic look at bernoulli distribution.
All You Need to Know About Bias in Statistics
A Complete Guide to Get a Grasp of Time Series Analysis
The Key Differences Between Z-Test Vs. T-Test
The Complete Guide to Understand Pearson's Correlation
A complete guide on the types of statistical studies, everything you need to know about poisson distribution, your best guide to understand correlation vs. regression, the most comprehensive guide for beginners on what is correlation, what is hypothesis testing in statistics types and examples.
Lesson 10 of 24 By Avijeet Biswal

Table of Contents
In today’s data-driven world , decisions are based on data all the time. Hypothesis plays a crucial role in that process, whether it may be making business decisions, in the health sector, academia, or in quality improvement. Without hypothesis & hypothesis tests, you risk drawing the wrong conclusions and making bad decisions. In this tutorial, you will look at Hypothesis Testing in Statistics.
What Is Hypothesis Testing in Statistics?
Hypothesis Testing is a type of statistical analysis in which you put your assumptions about a population parameter to the test. It is used to estimate the relationship between 2 statistical variables.
Let's discuss few examples of statistical hypothesis from real-life -
- A teacher assumes that 60% of his college's students come from lower-middle-class families.
- A doctor believes that 3D (Diet, Dose, and Discipline) is 90% effective for diabetic patients.
Now that you know about hypothesis testing, look at the two types of hypothesis testing in statistics.
Hypothesis Testing Formula
Z = ( x̅ – μ0 ) / (σ /√n)
- Here, x̅ is the sample mean,
- μ0 is the population mean,
- σ is the standard deviation,
- n is the sample size.
How Hypothesis Testing Works?
An analyst performs hypothesis testing on a statistical sample to present evidence of the plausibility of the null hypothesis. Measurements and analyses are conducted on a random sample of the population to test a theory. Analysts use a random population sample to test two hypotheses: the null and alternative hypotheses.
The null hypothesis is typically an equality hypothesis between population parameters; for example, a null hypothesis may claim that the population means return equals zero. The alternate hypothesis is essentially the inverse of the null hypothesis (e.g., the population means the return is not equal to zero). As a result, they are mutually exclusive, and only one can be correct. One of the two possibilities, however, will always be correct.
Your Dream Career is Just Around The Corner!
Null Hypothesis and Alternate Hypothesis
The Null Hypothesis is the assumption that the event will not occur. A null hypothesis has no bearing on the study's outcome unless it is rejected.
H0 is the symbol for it, and it is pronounced H-naught.
The Alternate Hypothesis is the logical opposite of the null hypothesis. The acceptance of the alternative hypothesis follows the rejection of the null hypothesis. H1 is the symbol for it.
Let's understand this with an example.
A sanitizer manufacturer claims that its product kills 95 percent of germs on average.
To put this company's claim to the test, create a null and alternate hypothesis.
H0 (Null Hypothesis): Average = 95%.
Alternative Hypothesis (H1): The average is less than 95%.
Another straightforward example to understand this concept is determining whether or not a coin is fair and balanced. The null hypothesis states that the probability of a show of heads is equal to the likelihood of a show of tails. In contrast, the alternate theory states that the probability of a show of heads and tails would be very different.
Become a Data Scientist with Hands-on Training!
Hypothesis Testing Calculation With Examples
Let's consider a hypothesis test for the average height of women in the United States. Suppose our null hypothesis is that the average height is 5'4". We gather a sample of 100 women and determine that their average height is 5'5". The standard deviation of population is 2.
To calculate the z-score, we would use the following formula:
z = ( x̅ – μ0 ) / (σ /√n)
z = (5'5" - 5'4") / (2" / √100)
z = 0.5 / (0.045)
We will reject the null hypothesis as the z-score of 11.11 is very large and conclude that there is evidence to suggest that the average height of women in the US is greater than 5'4".
Steps of Hypothesis Testing
Step 1: specify your null and alternate hypotheses.
It is critical to rephrase your original research hypothesis (the prediction that you wish to study) as a null (Ho) and alternative (Ha) hypothesis so that you can test it quantitatively. Your first hypothesis, which predicts a link between variables, is generally your alternate hypothesis. The null hypothesis predicts no link between the variables of interest.
Step 2: Gather Data
For a statistical test to be legitimate, sampling and data collection must be done in a way that is meant to test your hypothesis. You cannot draw statistical conclusions about the population you are interested in if your data is not representative.
Step 3: Conduct a Statistical Test
Other statistical tests are available, but they all compare within-group variance (how to spread out the data inside a category) against between-group variance (how different the categories are from one another). If the between-group variation is big enough that there is little or no overlap between groups, your statistical test will display a low p-value to represent this. This suggests that the disparities between these groups are unlikely to have occurred by accident. Alternatively, if there is a large within-group variance and a low between-group variance, your statistical test will show a high p-value. Any difference you find across groups is most likely attributable to chance. The variety of variables and the level of measurement of your obtained data will influence your statistical test selection.
Step 4: Determine Rejection Of Your Null Hypothesis
Your statistical test results must determine whether your null hypothesis should be rejected or not. In most circumstances, you will base your judgment on the p-value provided by the statistical test. In most circumstances, your preset level of significance for rejecting the null hypothesis will be 0.05 - that is, when there is less than a 5% likelihood that these data would be seen if the null hypothesis were true. In other circumstances, researchers use a lower level of significance, such as 0.01 (1%). This reduces the possibility of wrongly rejecting the null hypothesis.
Step 5: Present Your Results
The findings of hypothesis testing will be discussed in the results and discussion portions of your research paper, dissertation, or thesis. You should include a concise overview of the data and a summary of the findings of your statistical test in the results section. You can talk about whether your results confirmed your initial hypothesis or not in the conversation. Rejecting or failing to reject the null hypothesis is a formal term used in hypothesis testing. This is likely a must for your statistics assignments.
Types of Hypothesis Testing
To determine whether a discovery or relationship is statistically significant, hypothesis testing uses a z-test. It usually checks to see if two means are the same (the null hypothesis). Only when the population standard deviation is known and the sample size is 30 data points or more, can a z-test be applied.
A statistical test called a t-test is employed to compare the means of two groups. To determine whether two groups differ or if a procedure or treatment affects the population of interest, it is frequently used in hypothesis testing.
Chi-Square
You utilize a Chi-square test for hypothesis testing concerning whether your data is as predicted. To determine if the expected and observed results are well-fitted, the Chi-square test analyzes the differences between categorical variables from a random sample. The test's fundamental premise is that the observed values in your data should be compared to the predicted values that would be present if the null hypothesis were true.
Hypothesis Testing and Confidence Intervals
Both confidence intervals and hypothesis tests are inferential techniques that depend on approximating the sample distribution. Data from a sample is used to estimate a population parameter using confidence intervals. Data from a sample is used in hypothesis testing to examine a given hypothesis. We must have a postulated parameter to conduct hypothesis testing.
Bootstrap distributions and randomization distributions are created using comparable simulation techniques. The observed sample statistic is the focal point of a bootstrap distribution, whereas the null hypothesis value is the focal point of a randomization distribution.
A variety of feasible population parameter estimates are included in confidence ranges. In this lesson, we created just two-tailed confidence intervals. There is a direct connection between these two-tail confidence intervals and these two-tail hypothesis tests. The results of a two-tailed hypothesis test and two-tailed confidence intervals typically provide the same results. In other words, a hypothesis test at the 0.05 level will virtually always fail to reject the null hypothesis if the 95% confidence interval contains the predicted value. A hypothesis test at the 0.05 level will nearly certainly reject the null hypothesis if the 95% confidence interval does not include the hypothesized parameter.
Simple and Composite Hypothesis Testing
Depending on the population distribution, you can classify the statistical hypothesis into two types.
Simple Hypothesis: A simple hypothesis specifies an exact value for the parameter.
Composite Hypothesis: A composite hypothesis specifies a range of values.
A company is claiming that their average sales for this quarter are 1000 units. This is an example of a simple hypothesis.
Suppose the company claims that the sales are in the range of 900 to 1000 units. Then this is a case of a composite hypothesis.
One-Tailed and Two-Tailed Hypothesis Testing
The One-Tailed test, also called a directional test, considers a critical region of data that would result in the null hypothesis being rejected if the test sample falls into it, inevitably meaning the acceptance of the alternate hypothesis.
In a one-tailed test, the critical distribution area is one-sided, meaning the test sample is either greater or lesser than a specific value.
In two tails, the test sample is checked to be greater or less than a range of values in a Two-Tailed test, implying that the critical distribution area is two-sided.
If the sample falls within this range, the alternate hypothesis will be accepted, and the null hypothesis will be rejected.
Become a Data Scientist With Real-World Experience
Right Tailed Hypothesis Testing
If the larger than (>) sign appears in your hypothesis statement, you are using a right-tailed test, also known as an upper test. Or, to put it another way, the disparity is to the right. For instance, you can contrast the battery life before and after a change in production. Your hypothesis statements can be the following if you want to know if the battery life is longer than the original (let's say 90 hours):
- The null hypothesis is (H0 <= 90) or less change.
- A possibility is that battery life has risen (H1) > 90.
The crucial point in this situation is that the alternate hypothesis (H1), not the null hypothesis, decides whether you get a right-tailed test.
Left Tailed Hypothesis Testing
Alternative hypotheses that assert the true value of a parameter is lower than the null hypothesis are tested with a left-tailed test; they are indicated by the asterisk "<".
Suppose H0: mean = 50 and H1: mean not equal to 50
According to the H1, the mean can be greater than or less than 50. This is an example of a Two-tailed test.
In a similar manner, if H0: mean >=50, then H1: mean <50
Here the mean is less than 50. It is called a One-tailed test.
Type 1 and Type 2 Error
A hypothesis test can result in two types of errors.
Type 1 Error: A Type-I error occurs when sample results reject the null hypothesis despite being true.
Type 2 Error: A Type-II error occurs when the null hypothesis is not rejected when it is false, unlike a Type-I error.
Suppose a teacher evaluates the examination paper to decide whether a student passes or fails.
H0: Student has passed
H1: Student has failed
Type I error will be the teacher failing the student [rejects H0] although the student scored the passing marks [H0 was true].
Type II error will be the case where the teacher passes the student [do not reject H0] although the student did not score the passing marks [H1 is true].
Level of Significance
The alpha value is a criterion for determining whether a test statistic is statistically significant. In a statistical test, Alpha represents an acceptable probability of a Type I error. Because alpha is a probability, it can be anywhere between 0 and 1. In practice, the most commonly used alpha values are 0.01, 0.05, and 0.1, which represent a 1%, 5%, and 10% chance of a Type I error, respectively (i.e. rejecting the null hypothesis when it is in fact correct).
Future-Proof Your AI/ML Career: Top Dos and Don'ts
A p-value is a metric that expresses the likelihood that an observed difference could have occurred by chance. As the p-value decreases the statistical significance of the observed difference increases. If the p-value is too low, you reject the null hypothesis.
Here you have taken an example in which you are trying to test whether the new advertising campaign has increased the product's sales. The p-value is the likelihood that the null hypothesis, which states that there is no change in the sales due to the new advertising campaign, is true. If the p-value is .30, then there is a 30% chance that there is no increase or decrease in the product's sales. If the p-value is 0.03, then there is a 3% probability that there is no increase or decrease in the sales value due to the new advertising campaign. As you can see, the lower the p-value, the chances of the alternate hypothesis being true increases, which means that the new advertising campaign causes an increase or decrease in sales.
Why is Hypothesis Testing Important in Research Methodology?
Hypothesis testing is crucial in research methodology for several reasons:
- Provides evidence-based conclusions: It allows researchers to make objective conclusions based on empirical data, providing evidence to support or refute their research hypotheses.
- Supports decision-making: It helps make informed decisions, such as accepting or rejecting a new treatment, implementing policy changes, or adopting new practices.
- Adds rigor and validity: It adds scientific rigor to research using statistical methods to analyze data, ensuring that conclusions are based on sound statistical evidence.
- Contributes to the advancement of knowledge: By testing hypotheses, researchers contribute to the growth of knowledge in their respective fields by confirming existing theories or discovering new patterns and relationships.
Limitations of Hypothesis Testing
Hypothesis testing has some limitations that researchers should be aware of:
- It cannot prove or establish the truth: Hypothesis testing provides evidence to support or reject a hypothesis, but it cannot confirm the absolute truth of the research question.
- Results are sample-specific: Hypothesis testing is based on analyzing a sample from a population, and the conclusions drawn are specific to that particular sample.
- Possible errors: During hypothesis testing, there is a chance of committing type I error (rejecting a true null hypothesis) or type II error (failing to reject a false null hypothesis).
- Assumptions and requirements: Different tests have specific assumptions and requirements that must be met to accurately interpret results.
After reading this tutorial, you would have a much better understanding of hypothesis testing, one of the most important concepts in the field of Data Science . The majority of hypotheses are based on speculation about observed behavior, natural phenomena, or established theories.
If you are interested in statistics of data science and skills needed for such a career, you ought to explore Simplilearn’s Post Graduate Program in Data Science.
If you have any questions regarding this ‘Hypothesis Testing In Statistics’ tutorial, do share them in the comment section. Our subject matter expert will respond to your queries. Happy learning!
1. What is hypothesis testing in statistics with example?
Hypothesis testing is a statistical method used to determine if there is enough evidence in a sample data to draw conclusions about a population. It involves formulating two competing hypotheses, the null hypothesis (H0) and the alternative hypothesis (Ha), and then collecting data to assess the evidence. An example: testing if a new drug improves patient recovery (Ha) compared to the standard treatment (H0) based on collected patient data.
2. What is hypothesis testing and its types?
Hypothesis testing is a statistical method used to make inferences about a population based on sample data. It involves formulating two hypotheses: the null hypothesis (H0), which represents the default assumption, and the alternative hypothesis (Ha), which contradicts H0. The goal is to assess the evidence and determine whether there is enough statistical significance to reject the null hypothesis in favor of the alternative hypothesis.
Types of hypothesis testing:
- One-sample test: Used to compare a sample to a known value or a hypothesized value.
- Two-sample test: Compares two independent samples to assess if there is a significant difference between their means or distributions.
- Paired-sample test: Compares two related samples, such as pre-test and post-test data, to evaluate changes within the same subjects over time or under different conditions.
- Chi-square test: Used to analyze categorical data and determine if there is a significant association between variables.
- ANOVA (Analysis of Variance): Compares means across multiple groups to check if there is a significant difference between them.
3. What are the steps of hypothesis testing?
The steps of hypothesis testing are as follows:
- Formulate the hypotheses: State the null hypothesis (H0) and the alternative hypothesis (Ha) based on the research question.
- Set the significance level: Determine the acceptable level of error (alpha) for making a decision.
- Collect and analyze data: Gather and process the sample data.
- Compute test statistic: Calculate the appropriate statistical test to assess the evidence.
- Make a decision: Compare the test statistic with critical values or p-values and determine whether to reject H0 in favor of Ha or not.
- Draw conclusions: Interpret the results and communicate the findings in the context of the research question.
4. What are the 2 types of hypothesis testing?
- One-tailed (or one-sided) test: Tests for the significance of an effect in only one direction, either positive or negative.
- Two-tailed (or two-sided) test: Tests for the significance of an effect in both directions, allowing for the possibility of a positive or negative effect.
The choice between one-tailed and two-tailed tests depends on the specific research question and the directionality of the expected effect.
5. What are the 3 major types of hypothesis?
The three major types of hypotheses are:
- Null Hypothesis (H0): Represents the default assumption, stating that there is no significant effect or relationship in the data.
- Alternative Hypothesis (Ha): Contradicts the null hypothesis and proposes a specific effect or relationship that researchers want to investigate.
- Nondirectional Hypothesis: An alternative hypothesis that doesn't specify the direction of the effect, leaving it open for both positive and negative possibilities.
Find our Data Analyst Online Bootcamp in top cities:
About the author.
Avijeet is a Senior Research Analyst at Simplilearn. Passionate about Data Analytics, Machine Learning, and Deep Learning, Avijeet is also interested in politics, cricket, and football.
Recommended Resources
Free eBook: Top Programming Languages For A Data Scientist
Normality Test in Minitab: Minitab with Statistics
Machine Learning Career Guide: A Playbook to Becoming a Machine Learning Engineer
- PMP, PMI, PMBOK, CAPM, PgMP, PfMP, ACP, PBA, RMP, SP, and OPM3 are registered marks of the Project Management Institute, Inc.

Statistics Made Easy
One-Tailed Hypothesis Tests: 3 Example Problems
In statistics, we use hypothesis tests to determine whether some claim about a population parameter is true or not.
Whenever we perform a hypothesis test, we always write a null hypothesis and an alternative hypothesis, which take the following forms:
H 0 (Null Hypothesis): Population parameter = ≤, ≥ some value
H A (Alternative Hypothesis): Population parameter <, >, ≠ some value
There are two types of hypothesis tests:
- Two-tailed test : Alternative hypothesis contains the ≠ sign
- One-tailed test : Alternative hypothesis contains either < or > sign
In a one-tailed test , the alternative hypothesis contains the less than (“<“) or greater than (“>”) sign. This indicates that we’re testing whether or not there is a positive or negative effect.
Check out the following example problems to gain a better understanding of one-tailed tests.
Example 1: Factory Widgets
Suppose it’s assumed that the average weight of a certain widget produced at a factory is 20 grams. However, one engineer believes that a new method produces widgets that weigh less than 20 grams.
To test this, he can perform a one-tailed hypothesis test with the following null and alternative hypotheses:
- H 0 (Null Hypothesis): μ ≥ 20 grams
- H A (Alternative Hypothesis): μ < 20 grams
Note : We can tell this is a one-tailed test because the alternative hypothesis contains the less than ( < ) sign. Specifically, we would call this a left-tailed test because we’re testing if some population parameter is less than a specific value.
To test this, he uses the new method to produce 20 widgets and obtains the following information:
- n = 20 widgets
- x = 19.8 grams
- s = 3.1 grams
Plugging these values into the One Sample t-test Calculator , we obtain the following results:
- t-test statistic: -0.288525
- one-tailed p-value: 0.388
Since the p-value is not less than .05, the engineer fails to reject the null hypothesis.
He does not have sufficient evidence to say that the true mean weight of widgets produced by the new method is less than 20 grams.
Example 2: Plant Growth
Suppose a standard fertilizer has been shown to cause a species of plants to grow by an average of 10 inches. However, one botanist believes a new fertilizer can cause this species of plants to grow by an average of greater than 10 inches.
To test this, she can perform a one-tailed hypothesis test with the following null and alternative hypotheses:
- H 0 (Null Hypothesis): μ ≤ 10 inches
- H A (Alternative Hypothesis): μ > 10 inches
Note : We can tell this is a one-tailed test because the alternative hypothesis contains the greater than ( > ) sign. Specifically, we would call this a right-tailed test because we’re testing if some population parameter is greater than a specific value.
To test this claim, she applies the new fertilizer to a simple random sample of 15 plants and obtains the following information:
- n = 15 plants
- x = 11.4 inches
- s = 2.5 inches
- t-test statistic: 2.1689
- one-tailed p-value: 0.0239
Since the p-value is less than .05, the botanist rejects the null hypothesis.
She has sufficient evidence to conclude that the new fertilizer causes an average increase of greater than 10 inches.
Example 3: Studying Method
A professor currently teaches students to use a studying method that results in an average exam score of 82. However, he believes a new studying method can produce exam scores with an average value greater than 82.
To test this, he can perform a one-tailed hypothesis test with the following null and alternative hypotheses:
- H 0 (Null Hypothesis): μ ≤ 82
- H A (Alternative Hypothesis): μ > 82
To test this claim, the professor has 25 students use the new studying method and then take the exam. He collects the following data on the exam scores for this sample of students:
- t-test statistic: 3.6586
- one-tailed p-value: 0.0006
Since the p-value is less than .05, the professor rejects the null hypothesis.
He has sufficient evidence to conclude that the new studying method produces exam scores with an average score greater than 82.
Additional Resources
The following tutorials provide additional information about hypothesis testing:
Introduction to Hypothesis Testing What is a Directional Hypothesis? When Do You Reject the Null Hypothesis?
Featured Posts

Hey there. My name is Zach Bobbitt. I have a Masters of Science degree in Applied Statistics and I’ve worked on machine learning algorithms for professional businesses in both healthcare and retail. I’m passionate about statistics, machine learning, and data visualization and I created Statology to be a resource for both students and teachers alike. My goal with this site is to help you learn statistics through using simple terms, plenty of real-world examples, and helpful illustrations.
Leave a Reply Cancel reply
Your email address will not be published. Required fields are marked *
Join the Statology Community
I have read and agree to the terms & conditions
- Business Essentials
- Leadership & Management
- Credential of Leadership, Impact, and Management in Business (CLIMB)
- Entrepreneurship & Innovation
- Digital Transformation
- Finance & Accounting
- Business in Society
- For Organizations
- Support Portal
- Media Coverage
- Founding Donors
- Leadership Team

- Harvard Business School →
- HBS Online →
- Business Insights →
Business Insights
Harvard Business School Online's Business Insights Blog provides the career insights you need to achieve your goals and gain confidence in your business skills.
- Career Development
- Communication
- Decision-Making
- Earning Your MBA
- Negotiation
- News & Events
- Productivity
- Staff Spotlight
- Student Profiles
- Work-Life Balance
- AI Essentials for Business
- Alternative Investments
- Business Analytics
- Business Strategy
- Business and Climate Change
- Design Thinking and Innovation
- Digital Marketing Strategy
- Disruptive Strategy
- Economics for Managers
- Entrepreneurship Essentials
- Financial Accounting
- Global Business
- Launching Tech Ventures
- Leadership Principles
- Leadership, Ethics, and Corporate Accountability
- Leading with Finance
- Management Essentials
- Negotiation Mastery
- Organizational Leadership
- Power and Influence for Positive Impact
- Strategy Execution
- Sustainable Business Strategy
- Sustainable Investing
- Winning with Digital Platforms
A Beginner’s Guide to Hypothesis Testing in Business

- 30 Mar 2021
Becoming a more data-driven decision-maker can bring several benefits to your organization, enabling you to identify new opportunities to pursue and threats to abate. Rather than allowing subjective thinking to guide your business strategy, backing your decisions with data can empower your company to become more innovative and, ultimately, profitable.
If you’re new to data-driven decision-making, you might be wondering how data translates into business strategy. The answer lies in generating a hypothesis and verifying or rejecting it based on what various forms of data tell you.
Below is a look at hypothesis testing and the role it plays in helping businesses become more data-driven.
Access your free e-book today.
What Is Hypothesis Testing?
To understand what hypothesis testing is, it’s important first to understand what a hypothesis is.
A hypothesis or hypothesis statement seeks to explain why something has happened, or what might happen, under certain conditions. It can also be used to understand how different variables relate to each other. Hypotheses are often written as if-then statements; for example, “If this happens, then this will happen.”
Hypothesis testing , then, is a statistical means of testing an assumption stated in a hypothesis. While the specific methodology leveraged depends on the nature of the hypothesis and data available, hypothesis testing typically uses sample data to extrapolate insights about a larger population.
Hypothesis Testing in Business
When it comes to data-driven decision-making, there’s a certain amount of risk that can mislead a professional. This could be due to flawed thinking or observations, incomplete or inaccurate data , or the presence of unknown variables. The danger in this is that, if major strategic decisions are made based on flawed insights, it can lead to wasted resources, missed opportunities, and catastrophic outcomes.
The real value of hypothesis testing in business is that it allows professionals to test their theories and assumptions before putting them into action. This essentially allows an organization to verify its analysis is correct before committing resources to implement a broader strategy.
As one example, consider a company that wishes to launch a new marketing campaign to revitalize sales during a slow period. Doing so could be an incredibly expensive endeavor, depending on the campaign’s size and complexity. The company, therefore, may wish to test the campaign on a smaller scale to understand how it will perform.
In this example, the hypothesis that’s being tested would fall along the lines of: “If the company launches a new marketing campaign, then it will translate into an increase in sales.” It may even be possible to quantify how much of a lift in sales the company expects to see from the effort. Pending the results of the pilot campaign, the business would then know whether it makes sense to roll it out more broadly.
Related: 9 Fundamental Data Science Skills for Business Professionals
Key Considerations for Hypothesis Testing
1. alternative hypothesis and null hypothesis.
In hypothesis testing, the hypothesis that’s being tested is known as the alternative hypothesis . Often, it’s expressed as a correlation or statistical relationship between variables. The null hypothesis , on the other hand, is a statement that’s meant to show there’s no statistical relationship between the variables being tested. It’s typically the exact opposite of whatever is stated in the alternative hypothesis.
For example, consider a company’s leadership team that historically and reliably sees $12 million in monthly revenue. They want to understand if reducing the price of their services will attract more customers and, in turn, increase revenue.
In this case, the alternative hypothesis may take the form of a statement such as: “If we reduce the price of our flagship service by five percent, then we’ll see an increase in sales and realize revenues greater than $12 million in the next month.”
The null hypothesis, on the other hand, would indicate that revenues wouldn’t increase from the base of $12 million, or might even decrease.
Check out the video below about the difference between an alternative and a null hypothesis, and subscribe to our YouTube channel for more explainer content.
2. Significance Level and P-Value
Statistically speaking, if you were to run the same scenario 100 times, you’d likely receive somewhat different results each time. If you were to plot these results in a distribution plot, you’d see the most likely outcome is at the tallest point in the graph, with less likely outcomes falling to the right and left of that point.

With this in mind, imagine you’ve completed your hypothesis test and have your results, which indicate there may be a correlation between the variables you were testing. To understand your results' significance, you’ll need to identify a p-value for the test, which helps note how confident you are in the test results.
In statistics, the p-value depicts the probability that, assuming the null hypothesis is correct, you might still observe results that are at least as extreme as the results of your hypothesis test. The smaller the p-value, the more likely the alternative hypothesis is correct, and the greater the significance of your results.
3. One-Sided vs. Two-Sided Testing
When it’s time to test your hypothesis, it’s important to leverage the correct testing method. The two most common hypothesis testing methods are one-sided and two-sided tests , or one-tailed and two-tailed tests, respectively.
Typically, you’d leverage a one-sided test when you have a strong conviction about the direction of change you expect to see due to your hypothesis test. You’d leverage a two-sided test when you’re less confident in the direction of change.

4. Sampling
To perform hypothesis testing in the first place, you need to collect a sample of data to be analyzed. Depending on the question you’re seeking to answer or investigate, you might collect samples through surveys, observational studies, or experiments.
A survey involves asking a series of questions to a random population sample and recording self-reported responses.
Observational studies involve a researcher observing a sample population and collecting data as it occurs naturally, without intervention.
Finally, an experiment involves dividing a sample into multiple groups, one of which acts as the control group. For each non-control group, the variable being studied is manipulated to determine how the data collected differs from that of the control group.

Learn How to Perform Hypothesis Testing
Hypothesis testing is a complex process involving different moving pieces that can allow an organization to effectively leverage its data and inform strategic decisions.
If you’re interested in better understanding hypothesis testing and the role it can play within your organization, one option is to complete a course that focuses on the process. Doing so can lay the statistical and analytical foundation you need to succeed.
Do you want to learn more about hypothesis testing? Explore Business Analytics —one of our online business essentials courses —and download our Beginner’s Guide to Data & Analytics .

About the Author
The Genius Blog
Hypothesis Testing Solved Examples(Questions and Solutions)
Here is a list hypothesis testing exercises and solutions. Try to solve a question by yourself first before you look at the solution.
Question 1 In the population, the average IQ is 100 with a standard deviation of 15. A team of scientists want to test a new medication to see if it has either a positive or negative effect on intelligence, or not effect at all. A sample of 30 participants who have taken the medication has a mean of 140. Did the medication affect intelligence? View Solution to Question 1
A professor wants to know if her introductory statistics class has a good grasp of basic math. Six students are chosen at random from the class and given a math proficiency test. The professor wants the class to be able to score above 70 on the test. The six students get the following scores:62, 92, 75, 68, 83, 95. Can the professor have 90% confidence that the mean score for the class on the test would be above 70. Solution to Question 2
Question 3 In a packaging plant, a machine packs cartons with jars. It is supposed that a new machine would pack faster on the average than the machine currently used. To test the hypothesis, the time it takes each machine to pack ten cartons are recorded. The result in seconds is as follows.
Do the data provide sufficient evidence to conclude that, on the average, the new machine packs faster? Perform the required hypothesis test at the 5% level of significance. Solution to Question 3
Question 4 We want to compare the heights in inches of two groups of individuals. Here are the measurements: X: 175, 168, 168, 190, 156, 181, 182, 175, 174, 179 Y: 120, 180, 125, 188, 130, 190, 110, 185, 112, 188 Solution to Question 4
Question 5 A clinic provides a program to help their clients lose weight and asks a consumer agency to investigate the effectiveness of the program. The agency takes a sample of 15 people, weighing each person in the sample before the program begins and 3 months later. The results a tabulated below
Determine is the program is effective. Solution to Question 5
Question 6 A sample of 20 students were selected and given a diagnostic module prior to studying for a test. And then they were given the test again after completing the module. . The result of the students scores in the test before and after the test is tabulated below.
We want to see if there is significant improvement in the student’s performance due to this teaching method Solution to Question 6
Question 7 A study was performed to test wether cars get better mileage on premium gas than on regular gas. Each of 10 cars was first filled with regular or premium gas, decided by a coin toss, and the mileage for the tank was recorded. The mileage was recorded again for the same cars using other kind of gasoline. Determine wether cars get significantly better mileage with premium gas.
Mileage with regular gas: 16,20,21,22,23,22,27,25,27,28 Mileage with premium gas: 19, 22,24,24,25,25,26,26,28,32 Solution to Question 7
Question 8 An automatic cutter machine must cut steel strips of 1200 mm length. From a preliminary data, we checked that the lengths of the pieces produced by the machine can be considered as normal random variables with a 3mm standard deviation. We want to make sure that the machine is set correctly. Therefore 16 pieces of the products are randomly selected and weight. The figures were in mm: 1193,1196,1198,1195,1198,1199,1204,1193,1203,1201,1196,1200,1191,1196,1198,1191 Examine wether there is any significant deviation from the required size Solution to Question 8
Question 9 Blood pressure reading of ten patients before and after medication for reducing the blood pressure are as follows
Patient: 1,2,3,4,5,6,7,8,9,10 Before treatment: 86,84,78,90,92,77,89,90,90,86 After treatment: 80,80,92,79,92,82,88,89,92,83
Test the null hypothesis of no effect agains the alternate hypothesis that medication is effective. Execute it with Wilcoxon test Solution to Question 9
Question on ANOVA Sussan Sound predicts that students will learn most effectively with a constant background sound, as opposed to an unpredictable sound or no sound at all. She randomly divides 24 students into three groups of 8 each. All students study a passage of text for 30 minutes. Those in group 1 study with background sound at a constant volume in the background. Those in group 2 study with nose that changes volume periodically. Those in group 3 study with no sound at all. After studying, all students take a 10 point multiple choice test over the material. Their scores are tabulated below.
Group1: Constant sound: 7,4,6,8,6,6,2,9 Group 2: Random sound: 5,5,3,4,4,7,2,2 Group 3: No sound at all: 2,4,7,1,2,1,5,5 Solution to Question 10
Question 11 Using the following three groups of data, perform a one-way analysis of variance using α = 0.05.
Solution to Question 11
Question 12 In a packaging plant, a machine packs cartons with jars. It is supposed that a new machine would pack faster on the average than the machine currently used. To test the hypothesis, the time it takes each machine to pack ten cartons are recorded. The result in seconds is as follows.
New Machine: 42,41,41.3,41.8,42.4,42.8,43.2,42.3,41.8,42.7 Old Machine: 42.7,43.6,43.8,43.3,42.5,43.5,43.1,41.7,44,44.1
Perform an F-test to determine if the null hypothesis should be accepted. Solution to Question 12
Question 13 A random sample 500 U.S adults are questioned about their political affiliation and opinion on a tax reform bill. We need to test if the political affiliation and their opinon on a tax reform bill are dependent, at 5% level of significance. The observed contingency table is given below.
Solution to Question 13
Question 14 Can a dice be considered regular which is showing the following frequency distribution during 1000 throws?
Solution to Question 14
Solution to Question 15
Question 16 A newly developed muesli contains five types of seeds (A, B, C, D and E). The percentage of which is 35%, 25%, 20%, 10% and 10% according to the product information. In a randomly selected muesli, the following volume distribution was found.
Lets us decide about the null hypothesis whether the composition of the sample corresponds to the distribution indicated on the packaging at alpha = 0.1 significance level. Solution to Question 16
Question 17 A research team investigated whether there was any significant correlation between the severity of a certain disease runoff and the age of the patients. During the study, data for n = 200 patients were collected and grouped according to the severity of the disease and the age of the patient. The table below shows the result
Let us decided about the correlation between the age of the patients and the severity of disease progression. Solution to Question 17
Question 18 A publisher is interested in determine which of three book cover is most attractive. He interviews 400 people in each of the three states (California, Illinois and New York), and asks each person which of the cover he or she prefers. The number of preference for each cover is as follows:
Do these data indicate that there are regional differences in people’s preferences concerning these covers? Use the 0.05 level of significance. Solution to Question 18
Question 19 Trees planted along the road were checked for which ones are healthy(H) or diseased (D) and the following arrangement of the trees were obtained:
H H H H D D D H H H H H H H D D H H D D D
Test at the = 0.05 significance wether this arrangement may be regarded as random
Solution to Question 19
Question 20 Suppose we flip a coin n = 15 times and come up with the following arrangements
H T T T H H T T T T H H T H H
(H = head, T = tail)
Test at the alpha = 0.05 significance level whether this arrangement may be regarded as random.
Solution to Question 20
kindsonthegenius
You might also like, excel sheets for statistics with formulas for free, hypothesis testing problems – question 5 ( a clinic provides a program to…, hypothesis testing question 21 – wald-wolfowitz run test for large sample (step by step procedure).
I am really impressed with your writing abilities as well as with the structure to your weblog. Is this a paid subject matter or did you modify it yourself?
Either way stay up the excellent high quality writing, it’s uncommon to look a great blog like this one these days..
Below are given the gain in weights (in lbs.) of pigs fed on two diet A and B Dieta 25 32 30 34 24 14 32 24 30 31 35 25 – – DietB 44 34 22 10 47 31 40 30 32 35 18 21 35 29
- Bipolar Disorder
- Therapy Center
- When To See a Therapist
- Types of Therapy
- Best Online Therapy
- Best Couples Therapy
- Best Family Therapy
- Managing Stress
- Sleep and Dreaming
- Understanding Emotions
- Self-Improvement
- Healthy Relationships
- Student Resources
- Personality Types
- Guided Meditations
- Verywell Mind Insights
- 2024 Verywell Mind 25
- Mental Health in the Classroom
- Editorial Process
- Meet Our Review Board
- Crisis Support
How to Write a Great Hypothesis
Hypothesis Definition, Format, Examples, and Tips
Kendra Cherry, MS, is a psychosocial rehabilitation specialist, psychology educator, and author of the "Everything Psychology Book."
:max_bytes(150000):strip_icc():format(webp)/IMG_9791-89504ab694d54b66bbd72cb84ffb860e.jpg "what is an example of a hypothesis testing problem")
Amy Morin, LCSW, is a psychotherapist and international bestselling author. Her books, including "13 Things Mentally Strong People Don't Do," have been translated into more than 40 languages. Her TEDx talk, "The Secret of Becoming Mentally Strong," is one of the most viewed talks of all time.
:max_bytes(150000):strip_icc():format(webp)/VW-MIND-Amy-2b338105f1ee493f94d7e333e410fa76.jpg "what is an example of a hypothesis testing problem")
Verywell / Alex Dos Diaz
- The Scientific Method
Hypothesis Format
Falsifiability of a hypothesis.
- Operationalization
Hypothesis Types
Hypotheses examples.
- Collecting Data
A hypothesis is a tentative statement about the relationship between two or more variables. It is a specific, testable prediction about what you expect to happen in a study. It is a preliminary answer to your question that helps guide the research process.
Consider a study designed to examine the relationship between sleep deprivation and test performance. The hypothesis might be: "This study is designed to assess the hypothesis that sleep-deprived people will perform worse on a test than individuals who are not sleep-deprived."
At a Glance
A hypothesis is crucial to scientific research because it offers a clear direction for what the researchers are looking to find. This allows them to design experiments to test their predictions and add to our scientific knowledge about the world. This article explores how a hypothesis is used in psychology research, how to write a good hypothesis, and the different types of hypotheses you might use.
The Hypothesis in the Scientific Method
In the scientific method , whether it involves research in psychology, biology, or some other area, a hypothesis represents what the researchers think will happen in an experiment. The scientific method involves the following steps:
- Forming a question
- Performing background research
- Creating a hypothesis
- Designing an experiment
- Collecting data
- Analyzing the results
- Drawing conclusions
- Communicating the results
The hypothesis is a prediction, but it involves more than a guess. Most of the time, the hypothesis begins with a question which is then explored through background research. At this point, researchers then begin to develop a testable hypothesis.
Unless you are creating an exploratory study, your hypothesis should always explain what you expect to happen.
In a study exploring the effects of a particular drug, the hypothesis might be that researchers expect the drug to have some type of effect on the symptoms of a specific illness. In psychology, the hypothesis might focus on how a certain aspect of the environment might influence a particular behavior.
Remember, a hypothesis does not have to be correct. While the hypothesis predicts what the researchers expect to see, the goal of the research is to determine whether this guess is right or wrong. When conducting an experiment, researchers might explore numerous factors to determine which ones might contribute to the ultimate outcome.
In many cases, researchers may find that the results of an experiment do not support the original hypothesis. When writing up these results, the researchers might suggest other options that should be explored in future studies.
In many cases, researchers might draw a hypothesis from a specific theory or build on previous research. For example, prior research has shown that stress can impact the immune system. So a researcher might hypothesize: "People with high-stress levels will be more likely to contract a common cold after being exposed to the virus than people who have low-stress levels."
In other instances, researchers might look at commonly held beliefs or folk wisdom. "Birds of a feather flock together" is one example of folk adage that a psychologist might try to investigate. The researcher might pose a specific hypothesis that "People tend to select romantic partners who are similar to them in interests and educational level."
Elements of a Good Hypothesis
So how do you write a good hypothesis? When trying to come up with a hypothesis for your research or experiments, ask yourself the following questions:
- Is your hypothesis based on your research on a topic?
- Can your hypothesis be tested?
- Does your hypothesis include independent and dependent variables?
Before you come up with a specific hypothesis, spend some time doing background research. Once you have completed a literature review, start thinking about potential questions you still have. Pay attention to the discussion section in the journal articles you read . Many authors will suggest questions that still need to be explored.
How to Formulate a Good Hypothesis
To form a hypothesis, you should take these steps:
- Collect as many observations about a topic or problem as you can.
- Evaluate these observations and look for possible causes of the problem.
- Create a list of possible explanations that you might want to explore.
- After you have developed some possible hypotheses, think of ways that you could confirm or disprove each hypothesis through experimentation. This is known as falsifiability.
In the scientific method , falsifiability is an important part of any valid hypothesis. In order to test a claim scientifically, it must be possible that the claim could be proven false.
Students sometimes confuse the idea of falsifiability with the idea that it means that something is false, which is not the case. What falsifiability means is that if something was false, then it is possible to demonstrate that it is false.
One of the hallmarks of pseudoscience is that it makes claims that cannot be refuted or proven false.
The Importance of Operational Definitions
A variable is a factor or element that can be changed and manipulated in ways that are observable and measurable. However, the researcher must also define how the variable will be manipulated and measured in the study.
Operational definitions are specific definitions for all relevant factors in a study. This process helps make vague or ambiguous concepts detailed and measurable.
For example, a researcher might operationally define the variable " test anxiety " as the results of a self-report measure of anxiety experienced during an exam. A "study habits" variable might be defined by the amount of studying that actually occurs as measured by time.
These precise descriptions are important because many things can be measured in various ways. Clearly defining these variables and how they are measured helps ensure that other researchers can replicate your results.
Replicability
One of the basic principles of any type of scientific research is that the results must be replicable.
Replication means repeating an experiment in the same way to produce the same results. By clearly detailing the specifics of how the variables were measured and manipulated, other researchers can better understand the results and repeat the study if needed.
Some variables are more difficult than others to define. For example, how would you operationally define a variable such as aggression ? For obvious ethical reasons, researchers cannot create a situation in which a person behaves aggressively toward others.
To measure this variable, the researcher must devise a measurement that assesses aggressive behavior without harming others. The researcher might utilize a simulated task to measure aggressiveness in this situation.
Hypothesis Checklist
- Does your hypothesis focus on something that you can actually test?
- Does your hypothesis include both an independent and dependent variable?
- Can you manipulate the variables?
- Can your hypothesis be tested without violating ethical standards?
The hypothesis you use will depend on what you are investigating and hoping to find. Some of the main types of hypotheses that you might use include:
- Simple hypothesis : This type of hypothesis suggests there is a relationship between one independent variable and one dependent variable.
- Complex hypothesis : This type suggests a relationship between three or more variables, such as two independent and dependent variables.
- Null hypothesis : This hypothesis suggests no relationship exists between two or more variables.
- Alternative hypothesis : This hypothesis states the opposite of the null hypothesis.
- Statistical hypothesis : This hypothesis uses statistical analysis to evaluate a representative population sample and then generalizes the findings to the larger group.
- Logical hypothesis : This hypothesis assumes a relationship between variables without collecting data or evidence.
A hypothesis often follows a basic format of "If {this happens} then {this will happen}." One way to structure your hypothesis is to describe what will happen to the dependent variable if you change the independent variable .
The basic format might be: "If {these changes are made to a certain independent variable}, then we will observe {a change in a specific dependent variable}."
A few examples of simple hypotheses:
- "Students who eat breakfast will perform better on a math exam than students who do not eat breakfast."
- "Students who experience test anxiety before an English exam will get lower scores than students who do not experience test anxiety."
- "Motorists who talk on the phone while driving will be more likely to make errors on a driving course than those who do not talk on the phone."
- "Children who receive a new reading intervention will have higher reading scores than students who do not receive the intervention."
Examples of a complex hypothesis include:
- "People with high-sugar diets and sedentary activity levels are more likely to develop depression."
- "Younger people who are regularly exposed to green, outdoor areas have better subjective well-being than older adults who have limited exposure to green spaces."
Examples of a null hypothesis include:
- "There is no difference in anxiety levels between people who take St. John's wort supplements and those who do not."
- "There is no difference in scores on a memory recall task between children and adults."
- "There is no difference in aggression levels between children who play first-person shooter games and those who do not."
Examples of an alternative hypothesis:
- "People who take St. John's wort supplements will have less anxiety than those who do not."
- "Adults will perform better on a memory task than children."
- "Children who play first-person shooter games will show higher levels of aggression than children who do not."
Collecting Data on Your Hypothesis
Once a researcher has formed a testable hypothesis, the next step is to select a research design and start collecting data. The research method depends largely on exactly what they are studying. There are two basic types of research methods: descriptive research and experimental research.
Descriptive Research Methods
Descriptive research such as case studies , naturalistic observations , and surveys are often used when conducting an experiment is difficult or impossible. These methods are best used to describe different aspects of a behavior or psychological phenomenon.
Once a researcher has collected data using descriptive methods, a correlational study can examine how the variables are related. This research method might be used to investigate a hypothesis that is difficult to test experimentally.
Experimental Research Methods
Experimental methods are used to demonstrate causal relationships between variables. In an experiment, the researcher systematically manipulates a variable of interest (known as the independent variable) and measures the effect on another variable (known as the dependent variable).
Unlike correlational studies, which can only be used to determine if there is a relationship between two variables, experimental methods can be used to determine the actual nature of the relationship—whether changes in one variable actually cause another to change.
The hypothesis is a critical part of any scientific exploration. It represents what researchers expect to find in a study or experiment. In situations where the hypothesis is unsupported by the research, the research still has value. Such research helps us better understand how different aspects of the natural world relate to one another. It also helps us develop new hypotheses that can then be tested in the future.
Thompson WH, Skau S. On the scope of scientific hypotheses . R Soc Open Sci . 2023;10(8):230607. doi:10.1098/rsos.230607
Taran S, Adhikari NKJ, Fan E. Falsifiability in medicine: what clinicians can learn from Karl Popper [published correction appears in Intensive Care Med. 2021 Jun 17;:]. Intensive Care Med . 2021;47(9):1054-1056. doi:10.1007/s00134-021-06432-z
Eyler AA. Research Methods for Public Health . 1st ed. Springer Publishing Company; 2020. doi:10.1891/9780826182067.0004
Nosek BA, Errington TM. What is replication ? PLoS Biol . 2020;18(3):e3000691. doi:10.1371/journal.pbio.3000691
Aggarwal R, Ranganathan P. Study designs: Part 2 - Descriptive studies . Perspect Clin Res . 2019;10(1):34-36. doi:10.4103/picr.PICR_154_18
Nevid J. Psychology: Concepts and Applications. Wadworth, 2013.
By Kendra Cherry, MSEd Kendra Cherry, MS, is a psychosocial rehabilitation specialist, psychology educator, and author of the "Everything Psychology Book."
with Answer, Solution | Statistical Inference - Hypothesis Testing: Solved Example Problems | 12th Business Maths and Statistics : Chapter 8 : Sampling Techniques and Statistical Inference
Chapter: 12th business maths and statistics : chapter 8 : sampling techniques and statistical inference, hypothesis testing: solved example problems.
Example 8.14
An auto company decided to introduce a new six cylinder car whose mean petrol consumption is claimed to be lower than that of the existing auto engine. It was found that the mean petrol consumption for the 50 cars was 10 km per litre with a standard deviation of 3.5 km per litre. Test at 5% level of significance, whether the claim of the new car petrol consumption is 9.5 km per litre on the average is acceptable.
Population mean μ = 9.5 km
Since population SD is unknown we consider σ = s
The sample is a large sample and so we apply Z-test
Null Hypothesis: There is no significant difference between the sample average and the company’s claim, i.e., H 0 : μ = 9.5
Alternative Hypothesis: There is significant difference between the sample average and the company’s claim, i.e., H 1 : μ ≠ 9.5 (two tailed test)
The level of significance α = 5% = 0.05
Applying the test statistic

Thus the calculated value 1.01 and the significant value or table value Z α /2 = 1.96
Comparing the calculated and table value ,Here Z < Z α /2 i.e., 1.01<1.96.
Inference:Since the calculated value is less than table value i.e., Z < Z α /2 at 5% level of sinificance, the null hypothesis H 0 is accepted. Hence we conclude that the company’s claim that the new car petrol consumption is 9.5 km per litre is acceptable.
Example 8.15
A manufacturer of ball pens claims that a certain pen he manufactures has a mean writing life of 400 pages with a standard deviation of 20 pages. A purchasing agent selects a sample of 100 pens and puts them for test. The mean writing life for the sample was 390 pages. Should the purchasing agent reject the manufactures claim at 1% level?
Population SD σ = 20 pages
The sample is a large sample and so we apply Z -test
Null Hypothesis: There is no significant difference between the sample mean and the population mean of writing life of pen he manufactures, i.e., H 0 : μ = 400
Alternative Hypothesis: There is significant difference between the sample mean and the population mean of writing life of pen he manufactures, i.e., H 1 : μ ≠ 400 (two tailed test)
The level of significance a = 1% = 0.01

Thus the calculated value |Z| = 5 and the significant value or table value Z α /2 = 2.58
Comparing the calculated and table values, we found Z > Z α /2 i.e., 5 > 2.58
Inference: Since the calculated value is greater than table value i.e., Z > Z α /2 at 1% level of significance, the null hypothesis is rejected and Therefore we concluded that μ ≠ 400 and the manufacturer’s claim is rejected at 1% level of significance.
Example 8.16
(i) A sample of 900 members has a mean 3.4 cm and SD 2.61 cm. Is the sample taken from a large population with mean 3.25 cm. and SD 2.62 cm?
(ii) If the population is normal and its mean is unknown, find the 95% and 98% confidence limits of true mean.
Population mean μ= 3.25 cm, Population SD σ = 2.61 cm
Null Hypothesis H 0 : μ = 3.25 cm (the sample has been drawn from the population mean
μ = 3.25 cm and SD σ = 2.61 cm)
Alternative Hypothesis H 1 : μ ≠ 3.25 cm (two tail) i.e., the sample has not been drawn from the population mean μ = 3.25 cm and SD σ = 2.61 cm.
Teststatistic:

∴ Z = 1.724
Thus the calculated and the significant value or table value Z α /2 = 1.96
Comparing the calculated and table values, Z < Z α /2 i.e., 1.724 < 1.96
Inference:Since the calculated value is less than table value i.e., Z > Z α /2 at 5% level of significance, the null hypothesis is accepted. Hence we conclude that the2 data doesn’t provide us any evidence against the null hypothesis. Therefore, the sample has been drawn from the population mean μ = 3.25 cm and SD, σ = 2.61 cm.
(ii) Confidence limits
95% confidential limits for the population mean μ are :
3.4− (1.96× 0.087)≤ μ ≤ 3.4+ (1.96× 0.087)
3.229≤ μ ≤ 3.571
98% confidential limits for the population mean are :
3.4− (2.33× 0.087)≤ μ ≤ 3.4+ (2.33× 0.087)
3.197 ≤ μ≤ 3.603
Therefore,95% confidential limits is (3.229,3.571) and 98% confidential limits is (3.197,3.603).
Example 8.17
The mean weekly sales of soap bars in departmental stores were 146.3 bars per store. After an advertising campaign the mean weekly sales in 400 stores for a typical week increased to 153.7 and showed a standard deviation of 17.2. Was the advertising campaign successful?
Sample size n = 400 stores
Sample SD s = 17.2 bars
Population mean μ = 146.3 bars
Since population SD is unknown we can consider the sample SD s = σ
Null Hypothesis. The advertising campaign is not successful i.e, H 0 : μ = 146.3 (There is no significant difference between the mean weekly sales of soap bars in department stores before and after advertising campaign)
Alternative Hypothesis H 1 : μ > 143.3 (Right tail test). The advertising campaign was successful
Level of significance a = 0.05
Test statistic

∴ Z = 8.605
Comparing the calculated value Z = 8.605 and the significant value or table value Z α = 1.645 . we get 8.605 > 1.645
Inference: Since, the calculated value is much greater than table value i.e., Z > Z α , it is highly significant at 5% level of significance. Hence we reject the null hypothesis H0 and conclude that the advertising campaign was definitely successful in promoting sales.
Example 8.18
The wages of the factory workers are assumed to be normally distributed with mean and variance 25. A random sample of 50 workers gives the total wages equal to ₹ 2,550. Test the hypothesis μ = 52, against the alternative hypothesis μ = 49 at 1% level of significance.
Sample size n = 50 workers

Since alternative hypothesis is of two tailed test we can take | Z | = 1.4142
Critical value at 1% level of significance is Z α /2 = 2.58
Inference: Since the calculated value is less than table value i.e., Z < Za at 1% level of significance, the null hypothesis H 0 is accepted. Therefore, we conclude 2that there is no significant difference between the sample mean and population mean μ= 52 and SD σ = 5.
Example 8.19
An ambulance service claims that it takes on the average 8.9 minutes to reach its destination in emergency calls. To check on this claim, the agency which licenses ambulance services has them timed on 50 emergency calls, getting a mean of 9.3 minutes with a standard deviation of 1.6 minutes. What can they conclude at the level of significance.

Calculated value Z = 1.7676
Critical value at 5% level of significance is Z α /2 = 1.96
Inference: Since the calculated value is less than table value i.e., Z < Z α /2 at 5% level of significance, the null hypothesis is accepted. Therefore we conclude that an ambulance service claims on the average 8.9 minutes to reach its destination in emergency calls.
Related Topics
Privacy Policy , Terms and Conditions , DMCA Policy and Compliant
Copyright © 2018-2024 BrainKart.com; All Rights Reserved. Developed by Therithal info, Chennai.
IMAGES
VIDEO
COMMENTS
Hypothesis testing example. You want to test whether there is a relationship between gender and height. Based on your knowledge of human physiology, you formulate a hypothesis that men are, on average, taller than women. To test this hypothesis, you restate it as: H 0: Men are, on average, not taller than women. H a: Men are, on average, taller ...
Example 1: Biology. Hypothesis tests are often used in biology to determine whether some new treatment, fertilizer, pesticide, chemical, etc. causes increased growth, stamina, immunity, etc. in plants or animals. For example, suppose a biologist believes that a certain fertilizer will cause plants to grow more during a one-month period than ...
If the biologist set her significance level \(\alpha\) at 0.05 and used the critical value approach to conduct her hypothesis test, she would reject the null hypothesis if her test statistic t* were less than -1.6939 (determined using statistical software or a t-table):s-3-3. Since the biologist's test statistic, t* = -4.60, is less than -1.6939, the biologist rejects the null hypothesis.
Set up the Hypothesis Test: Since the problem is about a mean, this is a test of a single population mean. H 0: μ = 16.43 H a: μ < 16.43. For Jeffrey to swim faster, his time will be less than 16.43 seconds. The "<" tells you this is left-tailed. Determine the distribution needed: Random variable: X ¯ X ¯ = the mean time to swim the 25-yard ...
An Introduction to Statistics class in Davies County, KY conducted a hypothesis test at the local high school (a medium sized-approximately 1,200 students-small city demographic) to determine if the local high school's percentage was lower. One hundred fifty students were chosen at random and surveyed.
Example problem: A sample of 200 people has a mean age of 21 with a population standard deviation (σ) of 5. Test the hypothesis that the population mean is 18.9 at α = 0.05. Step 1: State the null hypothesis. In this case, the null hypothesis is that the population mean is 18.9, so we write: H 0: μ = 18.9. Step 2: State the alternative ...
Hypothesis testing is a technique that is used to verify whether the results of an experiment are statistically significant. It involves the setting up of a null hypothesis and an alternate hypothesis. There are three types of tests that can be conducted under hypothesis testing - z test, t test, and chi square test.
Example 3: Public Opinion About President Step 1. Determine the null and alternative hypotheses. Null hypothesis: There is no clear winning opinion on this issue; the proportions who would answer yes or no are each 0.50. Alternative hypothesis: Fewer than 0.50, or 50%, of the population would answer yes to this question.
Hypothesis Testing. Hypothesis Tests, or Statistical Hypothesis Testing, is a technique used to compare two datasets, or a sample from a dataset. It is a statistical inference method so, in the end of the test, you'll draw a conclusion — you'll infer something — about the characteristics of what you're comparing.
In binary hypothesis testing problems, we'll often be presented with two choices which we call hypotheses, and we'll have to decide whether to pick one or the other. The hypotheses are represented by H₀ and H₁ and are called null and alternate hypotheses respectively. In hypothesis testing, we either reject or accept the null hypothesis.
Full Hypothesis Test Examples Tests on Means. Example 6. Jeffrey, ... Set up the Hypothesis Test: Since the problem is about a mean, this is a test of a single population mean. Set the null and alternative hypothesis: In this case there is an implied challenge or claim. This is that the goggles will reduce the swimming time.
Below these are summarized into six such steps to conducting a test of a hypothesis. Set up the hypotheses and check conditions: Each hypothesis test includes two hypotheses about the population. One is the null hypothesis, notated as H 0, which is a statement of a particular parameter value. This hypothesis is assumed to be true until there is ...
Hypothesis testing is an act in statistics whereby an analyst tests an assumption regarding a population parameter. The methodology employed by the analyst depends on the nature of the data used ...
One Sample T Test Hypotheses. A one sample t test has the following hypotheses: Null hypothesis (H 0): The population mean equals the hypothesized value (µ = H 0).; Alternative hypothesis (H A): The population mean does not equal the hypothesized value (µ ≠ H 0).; If the p-value is less than your significance level (e.g., 0.05), you can reject the null hypothesis.
Typically, hypothesis tests take all of the sample data and convert it to a single value, which is known as a test statistic. You're probably already familiar with some test statistics. For example, t-tests calculate t-values. ... Write the null and alternative hypothesis using a 1-tailed and 2-tailed test for each problem. (In paragraph and ...
Developing a hypothesis (with example) Step 1. Ask a question. Writing a hypothesis begins with a research question that you want to answer. The question should be focused, specific, and researchable within the constraints of your project. Example: Research question.
Example 8.4.7. Joon believes that 50% of first-time brides in the United States are younger than their grooms. She performs a hypothesis test to determine if the percentage is the same or different from 50%. Joon samples 100 first-time brides and 53 reply that they are younger than their grooms.
Hypothesis testing is a statistical method used to determine if there is enough evidence in a sample data to draw conclusions about a population. It involves formulating two competing hypotheses, the null hypothesis (H0) and the alternative hypothesis (Ha), and then collecting data to assess the evidence.
In a one-tailed test, the alternative hypothesis contains the less than ("<") or greater than (">") sign. This indicates that we're testing whether or not there is a positive or negative effect. Check out the following example problems to gain a better understanding of one-tailed tests. Example 1: Factory Widgets
A hypothesis or hypothesis statement seeks to explain why something has happened, or what might happen, under certain conditions. It can also be used to understand how different variables relate to each other. Hypotheses are often written as if-then statements; for example, "If this happens, then this will happen.".
View Solution to Question 1. Question 2. A professor wants to know if her introductory statistics class has a good grasp of basic math. Six students are chosen at random from the class and given a math proficiency test. The professor wants the class to be able to score above 70 on the test. The six students get the following scores:62, 92, 75 ...
A hypothesis is a tentative statement about the relationship between two or more variables. It is a specific, testable prediction about what you expect to happen in a study. It is a preliminary answer to your question that helps guide the research process. Consider a study designed to examine the relationship between sleep deprivation and test ...
Statistical Inference : Hypothesis Testing: Solved Example Problems. Example 8.14. An auto company decided to introduce a new six cylinder car whose mean petrol consumption is claimed to be lower than that of the existing auto engine. It was found that the mean petrol consumption for the 50 cars was 10 km per litre with a standard deviation of ...
hypothesis testing in order to make conclusions about whether or not there is a difference in means due to a process, or is it just randomness. Hypothesis testing consists of a statistical test composed of five parts, and is based on proof by contradiction: 1. Define the null hypothesis, H o 2. Develop the alternative hypothesis, H a 3 ...