
Qualitative Data Analysis Methods 101:
The “big 6” methods + examples.
By: Kerryn Warren (PhD) | Reviewed By: Eunice Rautenbach (D.Tech) | May 2020 (Updated April 2023)
Qualitative data analysis methods. Wow, that’s a mouthful.
If you’re new to the world of research, qualitative data analysis can look rather intimidating. So much bulky terminology and so many abstract, fluffy concepts. It certainly can be a minefield!
Don’t worry – in this post, we’ll unpack the most popular analysis methods , one at a time, so that you can approach your analysis with confidence and competence – whether that’s for a dissertation, thesis or really any kind of research project.

What (exactly) is qualitative data analysis?
To understand qualitative data analysis, we need to first understand qualitative data – so let’s step back and ask the question, “what exactly is qualitative data?”.
Qualitative data refers to pretty much any data that’s “not numbers” . In other words, it’s not the stuff you measure using a fixed scale or complex equipment, nor do you analyse it using complex statistics or mathematics.
So, if it’s not numbers, what is it?
Words, you guessed? Well… sometimes , yes. Qualitative data can, and often does, take the form of interview transcripts, documents and open-ended survey responses – but it can also involve the interpretation of images and videos. In other words, qualitative isn’t just limited to text-based data.
So, how’s that different from quantitative data, you ask?
Simply put, qualitative research focuses on words, descriptions, concepts or ideas – while quantitative research focuses on numbers and statistics . Qualitative research investigates the “softer side” of things to explore and describe , while quantitative research focuses on the “hard numbers”, to measure differences between variables and the relationships between them. If you’re keen to learn more about the differences between qual and quant, we’ve got a detailed post over here .

So, qualitative analysis is easier than quantitative, right?
Not quite. In many ways, qualitative data can be challenging and time-consuming to analyse and interpret. At the end of your data collection phase (which itself takes a lot of time), you’ll likely have many pages of text-based data or hours upon hours of audio to work through. You might also have subtle nuances of interactions or discussions that have danced around in your mind, or that you scribbled down in messy field notes. All of this needs to work its way into your analysis.
Making sense of all of this is no small task and you shouldn’t underestimate it. Long story short – qualitative analysis can be a lot of work! Of course, quantitative analysis is no piece of cake either, but it’s important to recognise that qualitative analysis still requires a significant investment in terms of time and effort.
Need a helping hand?
In this post, we’ll explore qualitative data analysis by looking at some of the most common analysis methods we encounter. We’re not going to cover every possible qualitative method and we’re not going to go into heavy detail – we’re just going to give you the big picture. That said, we will of course includes links to loads of extra resources so that you can learn more about whichever analysis method interests you.
Without further delay, let’s get into it.
The “Big 6” Qualitative Analysis Methods
There are many different types of qualitative data analysis, all of which serve different purposes and have unique strengths and weaknesses . We’ll start by outlining the analysis methods and then we’ll dive into the details for each.
The 6 most popular methods (or at least the ones we see at Grad Coach) are:
- Content analysis
- Narrative analysis
- Discourse analysis
- Thematic analysis
- Grounded theory (GT)
- Interpretive phenomenological analysis (IPA)
Let’s take a look at each of them…
QDA Method #1: Qualitative Content Analysis
Content analysis is possibly the most common and straightforward QDA method. At the simplest level, content analysis is used to evaluate patterns within a piece of content (for example, words, phrases or images) or across multiple pieces of content or sources of communication. For example, a collection of newspaper articles or political speeches.
With content analysis, you could, for instance, identify the frequency with which an idea is shared or spoken about – like the number of times a Kardashian is mentioned on Twitter. Or you could identify patterns of deeper underlying interpretations – for instance, by identifying phrases or words in tourist pamphlets that highlight India as an ancient country.
Because content analysis can be used in such a wide variety of ways, it’s important to go into your analysis with a very specific question and goal, or you’ll get lost in the fog. With content analysis, you’ll group large amounts of text into codes , summarise these into categories, and possibly even tabulate the data to calculate the frequency of certain concepts or variables. Because of this, content analysis provides a small splash of quantitative thinking within a qualitative method.
Naturally, while content analysis is widely useful, it’s not without its drawbacks . One of the main issues with content analysis is that it can be very time-consuming , as it requires lots of reading and re-reading of the texts. Also, because of its multidimensional focus on both qualitative and quantitative aspects, it is sometimes accused of losing important nuances in communication.
Content analysis also tends to concentrate on a very specific timeline and doesn’t take into account what happened before or after that timeline. This isn’t necessarily a bad thing though – just something to be aware of. So, keep these factors in mind if you’re considering content analysis. Every analysis method has its limitations , so don’t be put off by these – just be aware of them ! If you’re interested in learning more about content analysis, the video below provides a good starting point.
QDA Method #2: Narrative Analysis
As the name suggests, narrative analysis is all about listening to people telling stories and analysing what that means . Since stories serve a functional purpose of helping us make sense of the world, we can gain insights into the ways that people deal with and make sense of reality by analysing their stories and the ways they’re told.
You could, for example, use narrative analysis to explore whether how something is being said is important. For instance, the narrative of a prisoner trying to justify their crime could provide insight into their view of the world and the justice system. Similarly, analysing the ways entrepreneurs talk about the struggles in their careers or cancer patients telling stories of hope could provide powerful insights into their mindsets and perspectives . Simply put, narrative analysis is about paying attention to the stories that people tell – and more importantly, the way they tell them.
Of course, the narrative approach has its weaknesses , too. Sample sizes are generally quite small due to the time-consuming process of capturing narratives. Because of this, along with the multitude of social and lifestyle factors which can influence a subject, narrative analysis can be quite difficult to reproduce in subsequent research. This means that it’s difficult to test the findings of some of this research.
Similarly, researcher bias can have a strong influence on the results here, so you need to be particularly careful about the potential biases you can bring into your analysis when using this method. Nevertheless, narrative analysis is still a very useful qualitative analysis method – just keep these limitations in mind and be careful not to draw broad conclusions . If you’re keen to learn more about narrative analysis, the video below provides a great introduction to this qualitative analysis method.
QDA Method #3: Discourse Analysis
Discourse is simply a fancy word for written or spoken language or debate . So, discourse analysis is all about analysing language within its social context. In other words, analysing language – such as a conversation, a speech, etc – within the culture and society it takes place. For example, you could analyse how a janitor speaks to a CEO, or how politicians speak about terrorism.
To truly understand these conversations or speeches, the culture and history of those involved in the communication are important factors to consider. For example, a janitor might speak more casually with a CEO in a company that emphasises equality among workers. Similarly, a politician might speak more about terrorism if there was a recent terrorist incident in the country.
So, as you can see, by using discourse analysis, you can identify how culture , history or power dynamics (to name a few) have an effect on the way concepts are spoken about. So, if your research aims and objectives involve understanding culture or power dynamics, discourse analysis can be a powerful method.
Because there are many social influences in terms of how we speak to each other, the potential use of discourse analysis is vast . Of course, this also means it’s important to have a very specific research question (or questions) in mind when analysing your data and looking for patterns and themes, or you might land up going down a winding rabbit hole.
Discourse analysis can also be very time-consuming as you need to sample the data to the point of saturation – in other words, until no new information and insights emerge. But this is, of course, part of what makes discourse analysis such a powerful technique. So, keep these factors in mind when considering this QDA method. Again, if you’re keen to learn more, the video below presents a good starting point.
QDA Method #4: Thematic Analysis
Thematic analysis looks at patterns of meaning in a data set – for example, a set of interviews or focus group transcripts. But what exactly does that… mean? Well, a thematic analysis takes bodies of data (which are often quite large) and groups them according to similarities – in other words, themes . These themes help us make sense of the content and derive meaning from it.
Let’s take a look at an example.
With thematic analysis, you could analyse 100 online reviews of a popular sushi restaurant to find out what patrons think about the place. By reviewing the data, you would then identify the themes that crop up repeatedly within the data – for example, “fresh ingredients” or “friendly wait staff”.
So, as you can see, thematic analysis can be pretty useful for finding out about people’s experiences , views, and opinions . Therefore, if your research aims and objectives involve understanding people’s experience or view of something, thematic analysis can be a great choice.
Since thematic analysis is a bit of an exploratory process, it’s not unusual for your research questions to develop , or even change as you progress through the analysis. While this is somewhat natural in exploratory research, it can also be seen as a disadvantage as it means that data needs to be re-reviewed each time a research question is adjusted. In other words, thematic analysis can be quite time-consuming – but for a good reason. So, keep this in mind if you choose to use thematic analysis for your project and budget extra time for unexpected adjustments.
")
QDA Method #5: Grounded theory (GT)
Grounded theory is a powerful qualitative analysis method where the intention is to create a new theory (or theories) using the data at hand, through a series of “ tests ” and “ revisions ”. Strictly speaking, GT is more a research design type than an analysis method, but we’ve included it here as it’s often referred to as a method.
What’s most important with grounded theory is that you go into the analysis with an open mind and let the data speak for itself – rather than dragging existing hypotheses or theories into your analysis. In other words, your analysis must develop from the ground up (hence the name).
Let’s look at an example of GT in action.
Assume you’re interested in developing a theory about what factors influence students to watch a YouTube video about qualitative analysis. Using Grounded theory , you’d start with this general overarching question about the given population (i.e., graduate students). First, you’d approach a small sample – for example, five graduate students in a department at a university. Ideally, this sample would be reasonably representative of the broader population. You’d interview these students to identify what factors lead them to watch the video.
After analysing the interview data, a general pattern could emerge. For example, you might notice that graduate students are more likely to read a post about qualitative methods if they are just starting on their dissertation journey, or if they have an upcoming test about research methods.
From here, you’ll look for another small sample – for example, five more graduate students in a different department – and see whether this pattern holds true for them. If not, you’ll look for commonalities and adapt your theory accordingly. As this process continues, the theory would develop . As we mentioned earlier, what’s important with grounded theory is that the theory develops from the data – not from some preconceived idea.
So, what are the drawbacks of grounded theory? Well, some argue that there’s a tricky circularity to grounded theory. For it to work, in principle, you should know as little as possible regarding the research question and population, so that you reduce the bias in your interpretation. However, in many circumstances, it’s also thought to be unwise to approach a research question without knowledge of the current literature . In other words, it’s a bit of a “chicken or the egg” situation.
Regardless, grounded theory remains a popular (and powerful) option. Naturally, it’s a very useful method when you’re researching a topic that is completely new or has very little existing research about it, as it allows you to start from scratch and work your way from the ground up .
")
QDA Method #6: Interpretive Phenomenological Analysis (IPA)
Interpretive. Phenomenological. Analysis. IPA . Try saying that three times fast…
Let’s just stick with IPA, okay?
IPA is designed to help you understand the personal experiences of a subject (for example, a person or group of people) concerning a major life event, an experience or a situation . This event or experience is the “phenomenon” that makes up the “P” in IPA. Such phenomena may range from relatively common events – such as motherhood, or being involved in a car accident – to those which are extremely rare – for example, someone’s personal experience in a refugee camp. So, IPA is a great choice if your research involves analysing people’s personal experiences of something that happened to them.
It’s important to remember that IPA is subject – centred . In other words, it’s focused on the experiencer . This means that, while you’ll likely use a coding system to identify commonalities, it’s important not to lose the depth of experience or meaning by trying to reduce everything to codes. Also, keep in mind that since your sample size will generally be very small with IPA, you often won’t be able to draw broad conclusions about the generalisability of your findings. But that’s okay as long as it aligns with your research aims and objectives.
Another thing to be aware of with IPA is personal bias . While researcher bias can creep into all forms of research, self-awareness is critically important with IPA, as it can have a major impact on the results. For example, a researcher who was a victim of a crime himself could insert his own feelings of frustration and anger into the way he interprets the experience of someone who was kidnapped. So, if you’re going to undertake IPA, you need to be very self-aware or you could muddy the analysis.

How to choose the right analysis method
In light of all of the qualitative analysis methods we’ve covered so far, you’re probably asking yourself the question, “ How do I choose the right one? ”
Much like all the other methodological decisions you’ll need to make, selecting the right qualitative analysis method largely depends on your research aims, objectives and questions . In other words, the best tool for the job depends on what you’re trying to build. For example:
- Perhaps your research aims to analyse the use of words and what they reveal about the intention of the storyteller and the cultural context of the time.
- Perhaps your research aims to develop an understanding of the unique personal experiences of people that have experienced a certain event, or
- Perhaps your research aims to develop insight regarding the influence of a certain culture on its members.
As you can probably see, each of these research aims are distinctly different , and therefore different analysis methods would be suitable for each one. For example, narrative analysis would likely be a good option for the first aim, while grounded theory wouldn’t be as relevant.
It’s also important to remember that each method has its own set of strengths, weaknesses and general limitations. No single analysis method is perfect . So, depending on the nature of your research, it may make sense to adopt more than one method (this is called triangulation ). Keep in mind though that this will of course be quite time-consuming.
As we’ve seen, all of the qualitative analysis methods we’ve discussed make use of coding and theme-generating techniques, but the intent and approach of each analysis method differ quite substantially. So, it’s very important to come into your research with a clear intention before you decide which analysis method (or methods) to use.
Start by reviewing your research aims , objectives and research questions to assess what exactly you’re trying to find out – then select a qualitative analysis method that fits. Never pick a method just because you like it or have experience using it – your analysis method (or methods) must align with your broader research aims and objectives.

Let’s recap on QDA methods…
In this post, we looked at six popular qualitative data analysis methods:
- First, we looked at content analysis , a straightforward method that blends a little bit of quant into a primarily qualitative analysis.
- Then we looked at narrative analysis , which is about analysing how stories are told.
- Next up was discourse analysis – which is about analysing conversations and interactions.
- Then we moved on to thematic analysis – which is about identifying themes and patterns.
- From there, we went south with grounded theory – which is about starting from scratch with a specific question and using the data alone to build a theory in response to that question.
- And finally, we looked at IPA – which is about understanding people’s unique experiences of a phenomenon.
Of course, these aren’t the only options when it comes to qualitative data analysis, but they’re a great starting point if you’re dipping your toes into qualitative research for the first time.
If you’re still feeling a bit confused, consider our private coaching service , where we hold your hand through the research process to help you develop your best work.

Psst... there’s more!
This post was based on one of our popular Research Bootcamps . If you're working on a research project, you'll definitely want to check this out ...
You Might Also Like:

84 Comments

This has been very helpful. Thank you.

Thank you madam,

Thank you so much for this information

I wonder it so clear for understand and good for me. can I ask additional query?

Very insightful and useful

Good work done with clear explanations. Thank you.

Thanks so much for the write-up, it’s really good.

Thanks madam . It is very important .

thank you very good

This has been very well explained in simple language . It is useful even for a new researcher.

Great to hear that. Good luck with your qualitative data analysis, Pramod!

This is very useful information. And it was very a clear language structured presentation. Thanks a lot.

Thank you so much.

very informative sequential presentation

Precise explanation of method.

Hi, may we use 2 data analysis methods in our qualitative research?
Thanks for your comment. Most commonly, one would use one type of analysis method, but it depends on your research aims and objectives.

You explained it in very simple language, everyone can understand it. Thanks so much.

Thank you very much, this is very helpful. It has been explained in a very simple manner that even a layman understands

Thank nicely explained can I ask is Qualitative content analysis the same as thematic analysis?
Thanks for your comment. No, QCA and thematic are two different types of analysis. This article might help clarify – https://onlinelibrary.wiley.com/doi/10.1111/nhs.12048

This is my first time to come across a well explained data analysis. so helpful.

I have thoroughly enjoyed your explanation of the six qualitative analysis methods. This is very helpful. Thank you!

Thank you very much, this is well explained and useful

i need a citation of your book.

Thanks a lot , remarkable indeed, enlighting to the best

Hi Derek, What other theories/methods would you recommend when the data is a whole speech?

Keep writing useful artikel.

It is important concept about QDA and also the way to express is easily understandable, so thanks for all.

Thank you, this is well explained and very useful.

Very helpful .Thanks.

Hi there! Very well explained. Simple but very useful style of writing. Please provide the citation of the text. warm regards

The session was very helpful and insightful. Thank you
This was very helpful and insightful. Easy to read and understand

As a professional academic writer, this has been so informative and educative. Keep up the good work Grad Coach you are unmatched with quality content for sure.
Keep up the good work Grad Coach you are unmatched with quality content for sure.

Its Great and help me the most. A Million Thanks you Dr.

It is a very nice work

Very insightful. Please, which of this approach could be used for a research that one is trying to elicit students’ misconceptions in a particular concept ?

This is Amazing and well explained, thanks

great overview

What do we call a research data analysis method that one use to advise or determining the best accounting tool or techniques that should be adopted in a company.

Informative video, explained in a clear and simple way. Kudos

Waoo! I have chosen method wrong for my data analysis. But I can revise my work according to this guide. Thank you so much for this helpful lecture.

This has been very helpful. It gave me a good view of my research objectives and how to choose the best method. Thematic analysis it is.

Very helpful indeed. Thanku so much for the insight.

This was incredibly helpful.

Very helpful.

very educative

Nicely written especially for novice academic researchers like me! Thank you.

choosing a right method for a paper is always a hard job for a student, this is a useful information, but it would be more useful personally for me, if the author provide me with a little bit more information about the data analysis techniques in type of explanatory research. Can we use qualitative content analysis technique for explanatory research ? or what is the suitable data analysis method for explanatory research in social studies?

that was very helpful for me. because these details are so important to my research. thank you very much

I learnt a lot. Thank you

Relevant and Informative, thanks !

Well-planned and organized, thanks much! 🙂

I have reviewed qualitative data analysis in a simplest way possible. The content will highly be useful for developing my book on qualitative data analysis methods. Cheers!

Clear explanation on qualitative and how about Case study

This was helpful. Thank you

This was really of great assistance, it was just the right information needed. Explanation very clear and follow.
Wow, Thanks for making my life easy

This was helpful thanks .

Very helpful…. clear and written in an easily understandable manner. Thank you.

This was so helpful as it was easy to understand. I’m a new to research thank you so much.

so educative…. but Ijust want to know which method is coding of the qualitative or tallying done?

Thank you for the great content, I have learnt a lot. So helpful

precise and clear presentation with simple language and thank you for that.

very informative content, thank you.

You guys are amazing on YouTube on this platform. Your teachings are great, educative, and informative. kudos!

Brilliant Delivery. You made a complex subject seem so easy. Well done.

Beautifully explained.
Thanks a lot

Is there a video the captures the practical process of coding using automated applications?
Thanks for the comment. We don’t recommend using automated applications for coding, as they are not sufficiently accurate in our experience.

content analysis can be qualitative research?

THANK YOU VERY MUCH.

Thank you very much for such a wonderful content

do you have any material on Data collection

What a powerful explanation of the QDA methods. Thank you.

Great explanation both written and Video. i have been using of it on a day to day working of my thesis project in accounting and finance. Thank you very much for your support.

very helpful, thank you so much
Submit a Comment Cancel reply
Your email address will not be published. Required fields are marked *
Save my name, email, and website in this browser for the next time I comment.
- Print Friendly
- AI & NLP
- Churn & Loyalty
- Customer Experience
- Customer Journeys
- Customer Metrics
- Feedback Analysis
- Product Experience
- Product Updates
- Sentiment Analysis
- Surveys & Feedback Collection
- Try Thematic
Welcome to the community

Qualitative Data Analysis: Step-by-Step Guide (Manual vs. Automatic)
When we conduct qualitative methods of research, need to explain changes in metrics or understand people's opinions, we always turn to qualitative data. Qualitative data is typically generated through:
- Interview transcripts
- Surveys with open-ended questions
- Contact center transcripts
- Texts and documents
- Audio and video recordings
- Observational notes
Compared to quantitative data, which captures structured information, qualitative data is unstructured and has more depth. It can answer our questions, can help formulate hypotheses and build understanding.
It's important to understand the differences between quantitative data & qualitative data . But unfortunately, analyzing qualitative data is difficult. While tools like Excel, Tableau and PowerBI crunch and visualize quantitative data with ease, there are a limited number of mainstream tools for analyzing qualitative data . The majority of qualitative data analysis still happens manually.
That said, there are two new trends that are changing this. First, there are advances in natural language processing (NLP) which is focused on understanding human language. Second, there is an explosion of user-friendly software designed for both researchers and businesses. Both help automate the qualitative data analysis process.
In this post we want to teach you how to conduct a successful qualitative data analysis. There are two primary qualitative data analysis methods; manual & automatic. We will teach you how to conduct the analysis manually, and also, automatically using software solutions powered by NLP. We’ll guide you through the steps to conduct a manual analysis, and look at what is involved and the role technology can play in automating this process.
More businesses are switching to fully-automated analysis of qualitative customer data because it is cheaper, faster, and just as accurate. Primarily, businesses purchase subscriptions to feedback analytics platforms so that they can understand customer pain points and sentiment.

We’ll take you through 5 steps to conduct a successful qualitative data analysis. Within each step we will highlight the key difference between the manual, and automated approach of qualitative researchers. Here's an overview of the steps:
The 5 steps to doing qualitative data analysis
- Gathering and collecting your qualitative data
- Organizing and connecting into your qualitative data
- Coding your qualitative data
- Analyzing the qualitative data for insights
- Reporting on the insights derived from your analysis
What is Qualitative Data Analysis?
Qualitative data analysis is a process of gathering, structuring and interpreting qualitative data to understand what it represents.
Qualitative data is non-numerical and unstructured. Qualitative data generally refers to text, such as open-ended responses to survey questions or user interviews, but also includes audio, photos and video.
Businesses often perform qualitative data analysis on customer feedback. And within this context, qualitative data generally refers to verbatim text data collected from sources such as reviews, complaints, chat messages, support centre interactions, customer interviews, case notes or social media comments.
How is qualitative data analysis different from quantitative data analysis?
Understanding the differences between quantitative & qualitative data is important. When it comes to analyzing data, Qualitative Data Analysis serves a very different role to Quantitative Data Analysis. But what sets them apart?
Qualitative Data Analysis dives into the stories hidden in non-numerical data such as interviews, open-ended survey answers, or notes from observations. It uncovers the ‘whys’ and ‘hows’ giving a deep understanding of people’s experiences and emotions.
Quantitative Data Analysis on the other hand deals with numerical data, using statistics to measure differences, identify preferred options, and pinpoint root causes of issues. It steps back to address questions like "how many" or "what percentage" to offer broad insights we can apply to larger groups.
In short, Qualitative Data Analysis is like a microscope, helping us understand specific detail. Quantitative Data Analysis is like the telescope, giving us a broader perspective. Both are important, working together to decode data for different objectives.
Qualitative Data Analysis methods
Once all the data has been captured, there are a variety of analysis techniques available and the choice is determined by your specific research objectives and the kind of data you’ve gathered. Common qualitative data analysis methods include:
Content Analysis
This is a popular approach to qualitative data analysis. Other qualitative analysis techniques may fit within the broad scope of content analysis. Thematic analysis is a part of the content analysis. Content analysis is used to identify the patterns that emerge from text, by grouping content into words, concepts, and themes. Content analysis is useful to quantify the relationship between all of the grouped content. The Columbia School of Public Health has a detailed breakdown of content analysis .
Narrative Analysis
Narrative analysis focuses on the stories people tell and the language they use to make sense of them. It is particularly useful in qualitative research methods where customer stories are used to get a deep understanding of customers’ perspectives on a specific issue. A narrative analysis might enable us to summarize the outcomes of a focused case study.
Discourse Analysis
Discourse analysis is used to get a thorough understanding of the political, cultural and power dynamics that exist in specific situations. The focus of discourse analysis here is on the way people express themselves in different social contexts. Discourse analysis is commonly used by brand strategists who hope to understand why a group of people feel the way they do about a brand or product.
Thematic Analysis
Thematic analysis is used to deduce the meaning behind the words people use. This is accomplished by discovering repeating themes in text. These meaningful themes reveal key insights into data and can be quantified, particularly when paired with sentiment analysis . Often, the outcome of thematic analysis is a code frame that captures themes in terms of codes, also called categories. So the process of thematic analysis is also referred to as “coding”. A common use-case for thematic analysis in companies is analysis of customer feedback.
Grounded Theory
Grounded theory is a useful approach when little is known about a subject. Grounded theory starts by formulating a theory around a single data case. This means that the theory is “grounded”. Grounded theory analysis is based on actual data, and not entirely speculative. Then additional cases can be examined to see if they are relevant and can add to the original grounded theory.

Challenges of Qualitative Data Analysis
While Qualitative Data Analysis offers rich insights, it comes with its challenges. Each unique QDA method has its unique hurdles. Let’s take a look at the challenges researchers and analysts might face, depending on the chosen method.
- Time and Effort (Narrative Analysis): Narrative analysis, which focuses on personal stories, demands patience. Sifting through lengthy narratives to find meaningful insights can be time-consuming, requires dedicated effort.
- Being Objective (Grounded Theory): Grounded theory, building theories from data, faces the challenges of personal biases. Staying objective while interpreting data is crucial, ensuring conclusions are rooted in the data itself.
- Complexity (Thematic Analysis): Thematic analysis involves identifying themes within data, a process that can be intricate. Categorizing and understanding themes can be complex, especially when each piece of data varies in context and structure. Thematic Analysis software can simplify this process.
- Generalizing Findings (Narrative Analysis): Narrative analysis, dealing with individual stories, makes drawing broad challenging. Extending findings from a single narrative to a broader context requires careful consideration.
- Managing Data (Thematic Analysis): Thematic analysis involves organizing and managing vast amounts of unstructured data, like interview transcripts. Managing this can be a hefty task, requiring effective data management strategies.
- Skill Level (Grounded Theory): Grounded theory demands specific skills to build theories from the ground up. Finding or training analysts with these skills poses a challenge, requiring investment in building expertise.
Benefits of qualitative data analysis
Qualitative Data Analysis (QDA) is like a versatile toolkit, offering a tailored approach to understanding your data. The benefits it offers are as diverse as the methods. Let’s explore why choosing the right method matters.
- Tailored Methods for Specific Needs: QDA isn't one-size-fits-all. Depending on your research objectives and the type of data at hand, different methods offer unique benefits. If you want emotive customer stories, narrative analysis paints a strong picture. When you want to explain a score, thematic analysis reveals insightful patterns
- Flexibility with Thematic Analysis: thematic analysis is like a chameleon in the toolkit of QDA. It adapts well to different types of data and research objectives, making it a top choice for any qualitative analysis.
- Deeper Understanding, Better Products: QDA helps you dive into people's thoughts and feelings. This deep understanding helps you build products and services that truly matches what people want, ensuring satisfied customers
- Finding the Unexpected: Qualitative data often reveals surprises that we miss in quantitative data. QDA offers us new ideas and perspectives, for insights we might otherwise miss.
- Building Effective Strategies: Insights from QDA are like strategic guides. They help businesses in crafting plans that match people’s desires.
- Creating Genuine Connections: Understanding people’s experiences lets businesses connect on a real level. This genuine connection helps build trust and loyalty, priceless for any business.
How to do Qualitative Data Analysis: 5 steps
Now we are going to show how you can do your own qualitative data analysis. We will guide you through this process step by step. As mentioned earlier, you will learn how to do qualitative data analysis manually , and also automatically using modern qualitative data and thematic analysis software.
To get best value from the analysis process and research process, it’s important to be super clear about the nature and scope of the question that’s being researched. This will help you select the research collection channels that are most likely to help you answer your question.
Depending on if you are a business looking to understand customer sentiment, or an academic surveying a school, your approach to qualitative data analysis will be unique.
Once you’re clear, there’s a sequence to follow. And, though there are differences in the manual and automatic approaches, the process steps are mostly the same.
The use case for our step-by-step guide is a company looking to collect data (customer feedback data), and analyze the customer feedback - in order to improve customer experience. By analyzing the customer feedback the company derives insights about their business and their customers. You can follow these same steps regardless of the nature of your research. Let’s get started.
Step 1: Gather your qualitative data and conduct research (Conduct qualitative research)
The first step of qualitative research is to do data collection. Put simply, data collection is gathering all of your data for analysis. A common situation is when qualitative data is spread across various sources.
Classic methods of gathering qualitative data
Most companies use traditional methods for gathering qualitative data: conducting interviews with research participants, running surveys, and running focus groups. This data is typically stored in documents, CRMs, databases and knowledge bases. It’s important to examine which data is available and needs to be included in your research project, based on its scope.
Using your existing qualitative feedback
As it becomes easier for customers to engage across a range of different channels, companies are gathering increasingly large amounts of both solicited and unsolicited qualitative feedback.
Most organizations have now invested in Voice of Customer programs , support ticketing systems, chatbot and support conversations, emails and even customer Slack chats.
These new channels provide companies with new ways of getting feedback, and also allow the collection of unstructured feedback data at scale.
The great thing about this data is that it contains a wealth of valubale insights and that it’s already there! When you have a new question about user behavior or your customers, you don’t need to create a new research study or set up a focus group. You can find most answers in the data you already have.
Typically, this data is stored in third-party solutions or a central database, but there are ways to export it or connect to a feedback analysis solution through integrations or an API.
Utilize untapped qualitative data channels
There are many online qualitative data sources you may not have considered. For example, you can find useful qualitative data in social media channels like Twitter or Facebook. Online forums, review sites, and online communities such as Discourse or Reddit also contain valuable data about your customers, or research questions.
If you are considering performing a qualitative benchmark analysis against competitors - the internet is your best friend. Gathering feedback in competitor reviews on sites like Trustpilot, G2, Capterra, Better Business Bureau or on app stores is a great way to perform a competitor benchmark analysis.
Customer feedback analysis software often has integrations into social media and review sites, or you could use a solution like DataMiner to scrape the reviews.

Step 2: Connect & organize all your qualitative data
Now you all have this qualitative data but there’s a problem, the data is unstructured. Before feedback can be analyzed and assigned any value, it needs to be organized in a single place. Why is this important? Consistency!
If all data is easily accessible in one place and analyzed in a consistent manner, you will have an easier time summarizing and making decisions based on this data.
The manual approach to organizing your data
The classic method of structuring qualitative data is to plot all the raw data you’ve gathered into a spreadsheet.
Typically, research and support teams would share large Excel sheets and different business units would make sense of the qualitative feedback data on their own. Each team collects and organizes the data in a way that best suits them, which means the feedback tends to be kept in separate silos.
An alternative and a more robust solution is to store feedback in a central database, like Snowflake or Amazon Redshift .
Keep in mind that when you organize your data in this way, you are often preparing it to be imported into another software. If you go the route of a database, you would need to use an API to push the feedback into a third-party software.
Computer-assisted qualitative data analysis software (CAQDAS)
Traditionally within the manual analysis approach (but not always), qualitative data is imported into CAQDAS software for coding.
In the early 2000s, CAQDAS software was popularised by developers such as ATLAS.ti, NVivo and MAXQDA and eagerly adopted by researchers to assist with the organizing and coding of data.
The benefits of using computer-assisted qualitative data analysis software:
- Assists in the organizing of your data
- Opens you up to exploring different interpretations of your data analysis
- Allows you to share your dataset easier and allows group collaboration (allows for secondary analysis)
However you still need to code the data, uncover the themes and do the analysis yourself. Therefore it is still a manual approach.

Organizing your qualitative data in a feedback repository
Another solution to organizing your qualitative data is to upload it into a feedback repository where it can be unified with your other data , and easily searchable and taggable. There are a number of software solutions that act as a central repository for your qualitative research data. Here are a couple solutions that you could investigate:
- Dovetail: Dovetail is a research repository with a focus on video and audio transcriptions. You can tag your transcriptions within the platform for theme analysis. You can also upload your other qualitative data such as research reports, survey responses, support conversations, and customer interviews. Dovetail acts as a single, searchable repository. And makes it easier to collaborate with other people around your qualitative research.
- EnjoyHQ: EnjoyHQ is another research repository with similar functionality to Dovetail. It boasts a more sophisticated search engine, but it has a higher starting subscription cost.
Organizing your qualitative data in a feedback analytics platform
If you have a lot of qualitative customer or employee feedback, from the likes of customer surveys or employee surveys, you will benefit from a feedback analytics platform. A feedback analytics platform is a software that automates the process of both sentiment analysis and thematic analysis . Companies use the integrations offered by these platforms to directly tap into their qualitative data sources (review sites, social media, survey responses, etc.). The data collected is then organized and analyzed consistently within the platform.
If you have data prepared in a spreadsheet, it can also be imported into feedback analytics platforms.
Once all this rich data has been organized within the feedback analytics platform, it is ready to be coded and themed, within the same platform. Thematic is a feedback analytics platform that offers one of the largest libraries of integrations with qualitative data sources.

Step 3: Coding your qualitative data
Your feedback data is now organized in one place. Either within your spreadsheet, CAQDAS, feedback repository or within your feedback analytics platform. The next step is to code your feedback data so we can extract meaningful insights in the next step.
Coding is the process of labelling and organizing your data in such a way that you can then identify themes in the data, and the relationships between these themes.
To simplify the coding process, you will take small samples of your customer feedback data, come up with a set of codes, or categories capturing themes, and label each piece of feedback, systematically, for patterns and meaning. Then you will take a larger sample of data, revising and refining the codes for greater accuracy and consistency as you go.
If you choose to use a feedback analytics platform, much of this process will be automated and accomplished for you.
The terms to describe different categories of meaning (‘theme’, ‘code’, ‘tag’, ‘category’ etc) can be confusing as they are often used interchangeably. For clarity, this article will use the term ‘code’.
To code means to identify key words or phrases and assign them to a category of meaning. “I really hate the customer service of this computer software company” would be coded as “poor customer service”.
How to manually code your qualitative data
- Decide whether you will use deductive or inductive coding. Deductive coding is when you create a list of predefined codes, and then assign them to the qualitative data. Inductive coding is the opposite of this, you create codes based on the data itself. Codes arise directly from the data and you label them as you go. You need to weigh up the pros and cons of each coding method and select the most appropriate.
- Read through the feedback data to get a broad sense of what it reveals. Now it’s time to start assigning your first set of codes to statements and sections of text.
- Keep repeating step 2, adding new codes and revising the code description as often as necessary. Once it has all been coded, go through everything again, to be sure there are no inconsistencies and that nothing has been overlooked.
- Create a code frame to group your codes. The coding frame is the organizational structure of all your codes. And there are two commonly used types of coding frames, flat, or hierarchical. A hierarchical code frame will make it easier for you to derive insights from your analysis.
- Based on the number of times a particular code occurs, you can now see the common themes in your feedback data. This is insightful! If ‘bad customer service’ is a common code, it’s time to take action.
We have a detailed guide dedicated to manually coding your qualitative data .

Using software to speed up manual coding of qualitative data
An Excel spreadsheet is still a popular method for coding. But various software solutions can help speed up this process. Here are some examples.
- CAQDAS / NVivo - CAQDAS software has built-in functionality that allows you to code text within their software. You may find the interface the software offers easier for managing codes than a spreadsheet.
- Dovetail/EnjoyHQ - You can tag transcripts and other textual data within these solutions. As they are also repositories you may find it simpler to keep the coding in one platform.
- IBM SPSS - SPSS is a statistical analysis software that may make coding easier than in a spreadsheet.
- Ascribe - Ascribe’s ‘Coder’ is a coding management system. Its user interface will make it easier for you to manage your codes.
Automating the qualitative coding process using thematic analysis software
In solutions which speed up the manual coding process, you still have to come up with valid codes and often apply codes manually to pieces of feedback. But there are also solutions that automate both the discovery and the application of codes.
Advances in machine learning have now made it possible to read, code and structure qualitative data automatically. This type of automated coding is offered by thematic analysis software .
Automation makes it far simpler and faster to code the feedback and group it into themes. By incorporating natural language processing (NLP) into the software, the AI looks across sentences and phrases to identify common themes meaningful statements. Some automated solutions detect repeating patterns and assign codes to them, others make you train the AI by providing examples. You could say that the AI learns the meaning of the feedback on its own.
Thematic automates the coding of qualitative feedback regardless of source. There’s no need to set up themes or categories in advance. Simply upload your data and wait a few minutes. You can also manually edit the codes to further refine their accuracy. Experiments conducted indicate that Thematic’s automated coding is just as accurate as manual coding .
Paired with sentiment analysis and advanced text analytics - these automated solutions become powerful for deriving quality business or research insights.
You could also build your own , if you have the resources!
The key benefits of using an automated coding solution
Automated analysis can often be set up fast and there’s the potential to uncover things that would never have been revealed if you had given the software a prescribed list of themes to look for.
Because the model applies a consistent rule to the data, it captures phrases or statements that a human eye might have missed.
Complete and consistent analysis of customer feedback enables more meaningful findings. Leading us into step 4.
Step 4: Analyze your data: Find meaningful insights
Now we are going to analyze our data to find insights. This is where we start to answer our research questions. Keep in mind that step 4 and step 5 (tell the story) have some overlap . This is because creating visualizations is both part of analysis process and reporting.
The task of uncovering insights is to scour through the codes that emerge from the data and draw meaningful correlations from them. It is also about making sure each insight is distinct and has enough data to support it.
Part of the analysis is to establish how much each code relates to different demographics and customer profiles, and identify whether there’s any relationship between these data points.
Manually create sub-codes to improve the quality of insights
If your code frame only has one level, you may find that your codes are too broad to be able to extract meaningful insights. This is where it is valuable to create sub-codes to your primary codes. This process is sometimes referred to as meta coding.
Note: If you take an inductive coding approach, you can create sub-codes as you are reading through your feedback data and coding it.
While time-consuming, this exercise will improve the quality of your analysis. Here is an example of what sub-codes could look like.

You need to carefully read your qualitative data to create quality sub-codes. But as you can see, the depth of analysis is greatly improved. By calculating the frequency of these sub-codes you can get insight into which customer service problems you can immediately address.
Correlate the frequency of codes to customer segments
Many businesses use customer segmentation . And you may have your own respondent segments that you can apply to your qualitative analysis. Segmentation is the practise of dividing customers or research respondents into subgroups.
Segments can be based on:
- Demographic
- And any other data type that you care to segment by
It is particularly useful to see the occurrence of codes within your segments. If one of your customer segments is considered unimportant to your business, but they are the cause of nearly all customer service complaints, it may be in your best interest to focus attention elsewhere. This is a useful insight!
Manually visualizing coded qualitative data
There are formulas you can use to visualize key insights in your data. The formulas we will suggest are imperative if you are measuring a score alongside your feedback.
If you are collecting a metric alongside your qualitative data this is a key visualization. Impact answers the question: “What’s the impact of a code on my overall score?”. Using Net Promoter Score (NPS) as an example, first you need to:
- Calculate overall NPS
- Calculate NPS in the subset of responses that do not contain that theme
- Subtract B from A
Then you can use this simple formula to calculate code impact on NPS .

You can then visualize this data using a bar chart.
You can download our CX toolkit - it includes a template to recreate this.
Trends over time
This analysis can help you answer questions like: “Which codes are linked to decreases or increases in my score over time?”
We need to compare two sequences of numbers: NPS over time and code frequency over time . Using Excel, calculate the correlation between the two sequences, which can be either positive (the more codes the higher the NPS, see picture below), or negative (the more codes the lower the NPS).
Now you need to plot code frequency against the absolute value of code correlation with NPS. Here is the formula:

The visualization could look like this:

These are two examples, but there are more. For a third manual formula, and to learn why word clouds are not an insightful form of analysis, read our visualizations article .
Using a text analytics solution to automate analysis
Automated text analytics solutions enable codes and sub-codes to be pulled out of the data automatically. This makes it far faster and easier to identify what’s driving negative or positive results. And to pick up emerging trends and find all manner of rich insights in the data.
Another benefit of AI-driven text analytics software is its built-in capability for sentiment analysis, which provides the emotive context behind your feedback and other qualitative textual data therein.
Thematic provides text analytics that goes further by allowing users to apply their expertise on business context to edit or augment the AI-generated outputs.
Since the move away from manual research is generally about reducing the human element, adding human input to the technology might sound counter-intuitive. However, this is mostly to make sure important business nuances in the feedback aren’t missed during coding. The result is a higher accuracy of analysis. This is sometimes referred to as augmented intelligence .

Step 5: Report on your data: Tell the story
The last step of analyzing your qualitative data is to report on it, to tell the story. At this point, the codes are fully developed and the focus is on communicating the narrative to the audience.
A coherent outline of the qualitative research, the findings and the insights is vital for stakeholders to discuss and debate before they can devise a meaningful course of action.
Creating graphs and reporting in Powerpoint
Typically, qualitative researchers take the tried and tested approach of distilling their report into a series of charts, tables and other visuals which are woven into a narrative for presentation in Powerpoint.
Using visualization software for reporting
With data transformation and APIs, the analyzed data can be shared with data visualisation software, such as Power BI or Tableau , Google Studio or Looker. Power BI and Tableau are among the most preferred options.
Visualizing your insights inside a feedback analytics platform
Feedback analytics platforms, like Thematic, incorporate visualisation tools that intuitively turn key data and insights into graphs. This removes the time consuming work of constructing charts to visually identify patterns and creates more time to focus on building a compelling narrative that highlights the insights, in bite-size chunks, for executive teams to review.
Using a feedback analytics platform with visualization tools means you don’t have to use a separate product for visualizations. You can export graphs into Powerpoints straight from the platforms.

Conclusion - Manual or Automated?
There are those who remain deeply invested in the manual approach - because it’s familiar, because they’re reluctant to spend money and time learning new software, or because they’ve been burned by the overpromises of AI.
For projects that involve small datasets, manual analysis makes sense. For example, if the objective is simply to quantify a simple question like “Do customers prefer X concepts to Y?”. If the findings are being extracted from a small set of focus groups and interviews, sometimes it’s easier to just read them
However, as new generations come into the workplace, it’s technology-driven solutions that feel more comfortable and practical. And the merits are undeniable. Especially if the objective is to go deeper and understand the ‘why’ behind customers’ preference for X or Y. And even more especially if time and money are considerations.
The ability to collect a free flow of qualitative feedback data at the same time as the metric means AI can cost-effectively scan, crunch, score and analyze a ton of feedback from one system in one go. And time-intensive processes like focus groups, or coding, that used to take weeks, can now be completed in a matter of hours or days.
But aside from the ever-present business case to speed things up and keep costs down, there are also powerful research imperatives for automated analysis of qualitative data: namely, accuracy and consistency.
Finding insights hidden in feedback requires consistency, especially in coding. Not to mention catching all the ‘unknown unknowns’ that can skew research findings and steering clear of cognitive bias.
Some say without manual data analysis researchers won’t get an accurate “feel” for the insights. However, the larger data sets are, the harder it is to sort through the feedback and organize feedback that has been pulled from different places. And, the more difficult it is to stay on course, the greater the risk of drawing incorrect, or incomplete, conclusions grows.
Though the process steps for qualitative data analysis have remained pretty much unchanged since psychologist Paul Felix Lazarsfeld paved the path a hundred years ago, the impact digital technology has had on types of qualitative feedback data and the approach to the analysis are profound.
If you want to try an automated feedback analysis solution on your own qualitative data, you can get started with Thematic .

Community & Marketing
Tyler manages our community of CX, insights & analytics professionals. Tyler's goal is to help unite insights professionals around common challenges.
We make it easy to discover the customer and product issues that matter.
Unlock the value of feedback at scale, in one platform. Try it for free now!
- Questions to ask your Feedback Analytics vendor
- How to end customer churn for good
- Scalable analysis of NPS verbatims
- 5 Text analytics approaches
- How to calculate the ROI of CX
Our experts will show you how Thematic works, how to discover pain points and track the ROI of decisions. To access your free trial, book a personal demo today.
Recent posts
When two major storms wreaked havoc on Auckland and Watercare’s infrastructurem the utility went through a CX crisis. With a massive influx of calls to their support center, Thematic helped them get inisghts from this data to forge a new approach to restore services and satisfaction levels.
Become a qualitative theming pro! Creating a perfect code frame is hard, but thematic analysis software makes the process much easier.
Qualtrics is one of the most well-known and powerful Customer Feedback Management platforms. But even so, it has limitations. We recently hosted a live panel where data analysts from two well-known brands shared their experiences with Qualtrics, and how they extended this platform’s capabilities. Below, we’ll share the
- Search Menu
- Sign in through your institution
- Browse content in Arts and Humanities
- Browse content in Archaeology
- Anglo-Saxon and Medieval Archaeology
- Archaeological Methodology and Techniques
- Archaeology by Region
- Archaeology of Religion
- Archaeology of Trade and Exchange
- Biblical Archaeology
- Contemporary and Public Archaeology
- Environmental Archaeology
- Historical Archaeology
- History and Theory of Archaeology
- Industrial Archaeology
- Landscape Archaeology
- Mortuary Archaeology
- Prehistoric Archaeology
- Underwater Archaeology
- Urban Archaeology
- Zooarchaeology
- Browse content in Architecture
- Architectural Structure and Design
- History of Architecture
- Residential and Domestic Buildings
- Theory of Architecture
- Browse content in Art
- Art Subjects and Themes
- History of Art
- Industrial and Commercial Art
- Theory of Art
- Biographical Studies
- Byzantine Studies
- Browse content in Classical Studies
- Classical Literature
- Classical Reception
- Classical History
- Classical Philosophy
- Classical Mythology
- Classical Art and Architecture
- Classical Oratory and Rhetoric
- Greek and Roman Papyrology
- Greek and Roman Archaeology
- Greek and Roman Epigraphy
- Greek and Roman Law
- Late Antiquity
- Religion in the Ancient World
- Digital Humanities
- Browse content in History
- Colonialism and Imperialism
- Diplomatic History
- Environmental History
- Genealogy, Heraldry, Names, and Honours
- Genocide and Ethnic Cleansing
- Historical Geography
- History by Period
- History of Emotions
- History of Agriculture
- History of Education
- History of Gender and Sexuality
- Industrial History
- Intellectual History
- International History
- Labour History
- Legal and Constitutional History
- Local and Family History
- Maritime History
- Military History
- National Liberation and Post-Colonialism
- Oral History
- Political History
- Public History
- Regional and National History
- Revolutions and Rebellions
- Slavery and Abolition of Slavery
- Social and Cultural History
- Theory, Methods, and Historiography
- Urban History
- World History
- Browse content in Language Teaching and Learning
- Language Learning (Specific Skills)
- Language Teaching Theory and Methods
- Browse content in Linguistics
- Applied Linguistics
- Cognitive Linguistics
- Computational Linguistics
- Forensic Linguistics
- Grammar, Syntax and Morphology
- Historical and Diachronic Linguistics
- History of English
- Language Evolution
- Language Reference
- Language Variation
- Language Families
- Language Acquisition
- Lexicography
- Linguistic Anthropology
- Linguistic Theories
- Linguistic Typology
- Phonetics and Phonology
- Psycholinguistics
- Sociolinguistics
- Translation and Interpretation
- Writing Systems
- Browse content in Literature
- Bibliography
- Children's Literature Studies
- Literary Studies (Romanticism)
- Literary Studies (American)
- Literary Studies (Modernism)
- Literary Studies (Asian)
- Literary Studies (European)
- Literary Studies (Eco-criticism)
- Literary Studies - World
- Literary Studies (1500 to 1800)
- Literary Studies (19th Century)
- Literary Studies (20th Century onwards)
- Literary Studies (African American Literature)
- Literary Studies (British and Irish)
- Literary Studies (Early and Medieval)
- Literary Studies (Fiction, Novelists, and Prose Writers)
- Literary Studies (Gender Studies)
- Literary Studies (Graphic Novels)
- Literary Studies (History of the Book)
- Literary Studies (Plays and Playwrights)
- Literary Studies (Poetry and Poets)
- Literary Studies (Postcolonial Literature)
- Literary Studies (Queer Studies)
- Literary Studies (Science Fiction)
- Literary Studies (Travel Literature)
- Literary Studies (War Literature)
- Literary Studies (Women's Writing)
- Literary Theory and Cultural Studies
- Mythology and Folklore
- Shakespeare Studies and Criticism
- Browse content in Media Studies
- Browse content in Music
- Applied Music
- Dance and Music
- Ethics in Music
- Ethnomusicology
- Gender and Sexuality in Music
- Medicine and Music
- Music Cultures
- Music and Media
- Music and Culture
- Music and Religion
- Music Education and Pedagogy
- Music Theory and Analysis
- Musical Scores, Lyrics, and Libretti
- Musical Structures, Styles, and Techniques
- Musicology and Music History
- Performance Practice and Studies
- Race and Ethnicity in Music
- Sound Studies
- Browse content in Performing Arts
- Browse content in Philosophy
- Aesthetics and Philosophy of Art
- Epistemology
- Feminist Philosophy
- History of Western Philosophy
- Metaphysics
- Moral Philosophy
- Non-Western Philosophy
- Philosophy of Language
- Philosophy of Mind
- Philosophy of Perception
- Philosophy of Action
- Philosophy of Law
- Philosophy of Religion
- Philosophy of Science
- Philosophy of Mathematics and Logic
- Practical Ethics
- Social and Political Philosophy
- Browse content in Religion
- Biblical Studies
- Christianity
- East Asian Religions
- History of Religion
- Judaism and Jewish Studies
- Qumran Studies
- Religion and Education
- Religion and Health
- Religion and Politics
- Religion and Science
- Religion and Law
- Religion and Art, Literature, and Music
- Religious Studies
- Browse content in Society and Culture
- Cookery, Food, and Drink
- Cultural Studies
- Customs and Traditions
- Ethical Issues and Debates
- Hobbies, Games, Arts and Crafts
- Lifestyle, Home, and Garden
- Natural world, Country Life, and Pets
- Popular Beliefs and Controversial Knowledge
- Sports and Outdoor Recreation
- Technology and Society
- Travel and Holiday
- Visual Culture
- Browse content in Law
- Arbitration
- Browse content in Company and Commercial Law
- Commercial Law
- Company Law
- Browse content in Comparative Law
- Systems of Law
- Competition Law
- Browse content in Constitutional and Administrative Law
- Government Powers
- Judicial Review
- Local Government Law
- Military and Defence Law
- Parliamentary and Legislative Practice
- Construction Law
- Contract Law
- Browse content in Criminal Law
- Criminal Procedure
- Criminal Evidence Law
- Sentencing and Punishment
- Employment and Labour Law
- Environment and Energy Law
- Browse content in Financial Law
- Banking Law
- Insolvency Law
- History of Law
- Human Rights and Immigration
- Intellectual Property Law
- Browse content in International Law
- Private International Law and Conflict of Laws
- Public International Law
- IT and Communications Law
- Jurisprudence and Philosophy of Law
- Law and Society
- Law and Politics
- Browse content in Legal System and Practice
- Courts and Procedure
- Legal Skills and Practice
- Primary Sources of Law
- Regulation of Legal Profession
- Medical and Healthcare Law
- Browse content in Policing
- Criminal Investigation and Detection
- Police and Security Services
- Police Procedure and Law
- Police Regional Planning
- Browse content in Property Law
- Personal Property Law
- Study and Revision
- Terrorism and National Security Law
- Browse content in Trusts Law
- Wills and Probate or Succession
- Browse content in Medicine and Health
- Browse content in Allied Health Professions
- Arts Therapies
- Clinical Science
- Dietetics and Nutrition
- Occupational Therapy
- Operating Department Practice
- Physiotherapy
- Radiography
- Speech and Language Therapy
- Browse content in Anaesthetics
- General Anaesthesia
- Neuroanaesthesia
- Clinical Neuroscience
- Browse content in Clinical Medicine
- Acute Medicine
- Cardiovascular Medicine
- Clinical Genetics
- Clinical Pharmacology and Therapeutics
- Dermatology
- Endocrinology and Diabetes
- Gastroenterology
- Genito-urinary Medicine
- Geriatric Medicine
- Infectious Diseases
- Medical Toxicology
- Medical Oncology
- Pain Medicine
- Palliative Medicine
- Rehabilitation Medicine
- Respiratory Medicine and Pulmonology
- Rheumatology
- Sleep Medicine
- Sports and Exercise Medicine
- Community Medical Services
- Critical Care
- Emergency Medicine
- Forensic Medicine
- Haematology
- History of Medicine
- Browse content in Medical Skills
- Clinical Skills
- Communication Skills
- Nursing Skills
- Surgical Skills
- Medical Ethics
- Browse content in Medical Dentistry
- Oral and Maxillofacial Surgery
- Paediatric Dentistry
- Restorative Dentistry and Orthodontics
- Surgical Dentistry
- Medical Statistics and Methodology
- Browse content in Neurology
- Clinical Neurophysiology
- Neuropathology
- Nursing Studies
- Browse content in Obstetrics and Gynaecology
- Gynaecology
- Occupational Medicine
- Ophthalmology
- Otolaryngology (ENT)
- Browse content in Paediatrics
- Neonatology
- Browse content in Pathology
- Chemical Pathology
- Clinical Cytogenetics and Molecular Genetics
- Histopathology
- Medical Microbiology and Virology
- Patient Education and Information
- Browse content in Pharmacology
- Psychopharmacology
- Browse content in Popular Health
- Caring for Others
- Complementary and Alternative Medicine
- Self-help and Personal Development
- Browse content in Preclinical Medicine
- Cell Biology
- Molecular Biology and Genetics
- Reproduction, Growth and Development
- Primary Care
- Professional Development in Medicine
- Browse content in Psychiatry
- Addiction Medicine
- Child and Adolescent Psychiatry
- Forensic Psychiatry
- Learning Disabilities
- Old Age Psychiatry
- Psychotherapy
- Browse content in Public Health and Epidemiology
- Epidemiology
- Public Health
- Browse content in Radiology
- Clinical Radiology
- Interventional Radiology
- Nuclear Medicine
- Radiation Oncology
- Reproductive Medicine
- Browse content in Surgery
- Cardiothoracic Surgery
- Gastro-intestinal and Colorectal Surgery
- General Surgery
- Neurosurgery
- Paediatric Surgery
- Peri-operative Care
- Plastic and Reconstructive Surgery
- Surgical Oncology
- Transplant Surgery
- Trauma and Orthopaedic Surgery
- Vascular Surgery
- Browse content in Science and Mathematics
- Browse content in Biological Sciences
- Aquatic Biology
- Biochemistry
- Bioinformatics and Computational Biology
- Developmental Biology
- Ecology and Conservation
- Evolutionary Biology
- Genetics and Genomics
- Microbiology
- Molecular and Cell Biology
- Natural History
- Plant Sciences and Forestry
- Research Methods in Life Sciences
- Structural Biology
- Systems Biology
- Zoology and Animal Sciences
- Browse content in Chemistry
- Analytical Chemistry
- Computational Chemistry
- Crystallography
- Environmental Chemistry
- Industrial Chemistry
- Inorganic Chemistry
- Materials Chemistry
- Medicinal Chemistry
- Mineralogy and Gems
- Organic Chemistry
- Physical Chemistry
- Polymer Chemistry
- Study and Communication Skills in Chemistry
- Theoretical Chemistry
- Browse content in Computer Science
- Artificial Intelligence
- Computer Architecture and Logic Design
- Game Studies
- Human-Computer Interaction
- Mathematical Theory of Computation
- Programming Languages
- Software Engineering
- Systems Analysis and Design
- Virtual Reality
- Browse content in Computing
- Business Applications
- Computer Games
- Computer Security
- Computer Networking and Communications
- Digital Lifestyle
- Graphical and Digital Media Applications
- Operating Systems
- Browse content in Earth Sciences and Geography
- Atmospheric Sciences
- Environmental Geography
- Geology and the Lithosphere
- Maps and Map-making
- Meteorology and Climatology
- Oceanography and Hydrology
- Palaeontology
- Physical Geography and Topography
- Regional Geography
- Soil Science
- Urban Geography
- Browse content in Engineering and Technology
- Agriculture and Farming
- Biological Engineering
- Civil Engineering, Surveying, and Building
- Electronics and Communications Engineering
- Energy Technology
- Engineering (General)
- Environmental Science, Engineering, and Technology
- History of Engineering and Technology
- Mechanical Engineering and Materials
- Technology of Industrial Chemistry
- Transport Technology and Trades
- Browse content in Environmental Science
- Applied Ecology (Environmental Science)
- Conservation of the Environment (Environmental Science)
- Environmental Sustainability
- Environmentalist Thought and Ideology (Environmental Science)
- Management of Land and Natural Resources (Environmental Science)
- Natural Disasters (Environmental Science)
- Nuclear Issues (Environmental Science)
- Pollution and Threats to the Environment (Environmental Science)
- Social Impact of Environmental Issues (Environmental Science)
- History of Science and Technology
- Browse content in Materials Science
- Ceramics and Glasses
- Composite Materials
- Metals, Alloying, and Corrosion
- Nanotechnology
- Browse content in Mathematics
- Applied Mathematics
- Biomathematics and Statistics
- History of Mathematics
- Mathematical Education
- Mathematical Finance
- Mathematical Analysis
- Numerical and Computational Mathematics
- Probability and Statistics
- Pure Mathematics
- Browse content in Neuroscience
- Cognition and Behavioural Neuroscience
- Development of the Nervous System
- Disorders of the Nervous System
- History of Neuroscience
- Invertebrate Neurobiology
- Molecular and Cellular Systems
- Neuroendocrinology and Autonomic Nervous System
- Neuroscientific Techniques
- Sensory and Motor Systems
- Browse content in Physics
- Astronomy and Astrophysics
- Atomic, Molecular, and Optical Physics
- Biological and Medical Physics
- Classical Mechanics
- Computational Physics
- Condensed Matter Physics
- Electromagnetism, Optics, and Acoustics
- History of Physics
- Mathematical and Statistical Physics
- Measurement Science
- Nuclear Physics
- Particles and Fields
- Plasma Physics
- Quantum Physics
- Relativity and Gravitation
- Semiconductor and Mesoscopic Physics
- Browse content in Psychology
- Affective Sciences
- Clinical Psychology
- Cognitive Psychology
- Cognitive Neuroscience
- Criminal and Forensic Psychology
- Developmental Psychology
- Educational Psychology
- Evolutionary Psychology
- Health Psychology
- History and Systems in Psychology
- Music Psychology
- Neuropsychology
- Organizational Psychology
- Psychological Assessment and Testing
- Psychology of Human-Technology Interaction
- Psychology Professional Development and Training
- Research Methods in Psychology
- Social Psychology
- Browse content in Social Sciences
- Browse content in Anthropology
- Anthropology of Religion
- Human Evolution
- Medical Anthropology
- Physical Anthropology
- Regional Anthropology
- Social and Cultural Anthropology
- Theory and Practice of Anthropology
- Browse content in Business and Management
- Business Ethics
- Business History
- Business Strategy
- Business and Technology
- Business and Government
- Business and the Environment
- Comparative Management
- Corporate Governance
- Corporate Social Responsibility
- Entrepreneurship
- Health Management
- Human Resource Management
- Industrial and Employment Relations
- Industry Studies
- Information and Communication Technologies
- International Business
- Knowledge Management
- Management and Management Techniques
- Operations Management
- Organizational Theory and Behaviour
- Pensions and Pension Management
- Public and Nonprofit Management
- Strategic Management
- Supply Chain Management
- Browse content in Criminology and Criminal Justice
- Criminal Justice
- Criminology
- Forms of Crime
- International and Comparative Criminology
- Youth Violence and Juvenile Justice
- Development Studies
- Browse content in Economics
- Agricultural, Environmental, and Natural Resource Economics
- Asian Economics
- Behavioural Finance
- Behavioural Economics and Neuroeconomics
- Econometrics and Mathematical Economics
- Economic History
- Economic Methodology
- Economic Systems
- Economic Development and Growth
- Financial Markets
- Financial Institutions and Services
- General Economics and Teaching
- Health, Education, and Welfare
- History of Economic Thought
- International Economics
- Labour and Demographic Economics
- Law and Economics
- Macroeconomics and Monetary Economics
- Microeconomics
- Public Economics
- Urban, Rural, and Regional Economics
- Welfare Economics
- Browse content in Education
- Adult Education and Continuous Learning
- Care and Counselling of Students
- Early Childhood and Elementary Education
- Educational Equipment and Technology
- Educational Strategies and Policy
- Higher and Further Education
- Organization and Management of Education
- Philosophy and Theory of Education
- Schools Studies
- Secondary Education
- Teaching of a Specific Subject
- Teaching of Specific Groups and Special Educational Needs
- Teaching Skills and Techniques
- Browse content in Environment
- Applied Ecology (Social Science)
- Climate Change
- Conservation of the Environment (Social Science)
- Environmentalist Thought and Ideology (Social Science)
- Natural Disasters (Environment)
- Social Impact of Environmental Issues (Social Science)
- Browse content in Human Geography
- Cultural Geography
- Economic Geography
- Political Geography
- Browse content in Interdisciplinary Studies
- Communication Studies
- Museums, Libraries, and Information Sciences
- Browse content in Politics
- African Politics
- Asian Politics
- Chinese Politics
- Comparative Politics
- Conflict Politics
- Elections and Electoral Studies
- Environmental Politics
- European Union
- Foreign Policy
- Gender and Politics
- Human Rights and Politics
- Indian Politics
- International Relations
- International Organization (Politics)
- International Political Economy
- Irish Politics
- Latin American Politics
- Middle Eastern Politics
- Political Behaviour
- Political Economy
- Political Institutions
- Political Theory
- Political Methodology
- Political Communication
- Political Philosophy
- Political Sociology
- Politics and Law
- Politics of Development
- Public Policy
- Public Administration
- Quantitative Political Methodology
- Regional Political Studies
- Russian Politics
- Security Studies
- State and Local Government
- UK Politics
- US Politics
- Browse content in Regional and Area Studies
- African Studies
- Asian Studies
- East Asian Studies
- Japanese Studies
- Latin American Studies
- Middle Eastern Studies
- Native American Studies
- Scottish Studies
- Browse content in Research and Information
- Research Methods
- Browse content in Social Work
- Addictions and Substance Misuse
- Adoption and Fostering
- Care of the Elderly
- Child and Adolescent Social Work
- Couple and Family Social Work
- Developmental and Physical Disabilities Social Work
- Direct Practice and Clinical Social Work
- Emergency Services
- Human Behaviour and the Social Environment
- International and Global Issues in Social Work
- Mental and Behavioural Health
- Social Justice and Human Rights
- Social Policy and Advocacy
- Social Work and Crime and Justice
- Social Work Macro Practice
- Social Work Practice Settings
- Social Work Research and Evidence-based Practice
- Welfare and Benefit Systems
- Browse content in Sociology
- Childhood Studies
- Community Development
- Comparative and Historical Sociology
- Economic Sociology
- Gender and Sexuality
- Gerontology and Ageing
- Health, Illness, and Medicine
- Marriage and the Family
- Migration Studies
- Occupations, Professions, and Work
- Organizations
- Population and Demography
- Race and Ethnicity
- Social Theory
- Social Movements and Social Change
- Social Research and Statistics
- Social Stratification, Inequality, and Mobility
- Sociology of Religion
- Sociology of Education
- Sport and Leisure
- Urban and Rural Studies
- Browse content in Warfare and Defence
- Defence Strategy, Planning, and Research
- Land Forces and Warfare
- Military Administration
- Military Life and Institutions
- Naval Forces and Warfare
- Other Warfare and Defence Issues
- Peace Studies and Conflict Resolution
- Weapons and Equipment

- < Previous chapter
- Next chapter >
29 Qualitative Data Analysis Strategies
Johnny Saldaña, School of Theatre and Film, Arizona State University
- Published: 02 September 2020
- Cite Icon Cite
- Permissions Icon Permissions
This chapter provides an overview of selected qualitative data analysis strategies with a particular focus on codes and coding. Preparatory strategies for a qualitative research study and data management are first outlined. Six coding methods are then profiled using comparable interview data: process coding, in vivo coding, descriptive coding, values coding, dramaturgical coding, and versus coding. Strategies for constructing themes and assertions from the data follow. Analytic memo writing is woven throughout as a method for generating additional analytic insight. Next, display and arts-based strategies are provided, followed by recommended qualitative data analytic software programs and a discussion on verifying the researcher’s analytic findings.
Qualitative Data Analysis Strategies
Anthropologist Clifford Geertz ( 1983 ) charmingly mused, “Life is just a bowl of strategies” (p. 25). Strategy , as I use it here, refers to a carefully considered plan or method to achieve a particular goal. The goal in this case is to develop a write-up of your analytic work with the qualitative data you have been given and collected as part of a study. The plans and methods you might employ to achieve that goal are what this article profiles.
Some may perceive strategy as an inappropriate, if not manipulative, word, suggesting formulaic or regimented approaches to inquiry. I assure you that is not my intent. My use of strategy is dramaturgical in nature: Strategies are actions that characters in plays take to overcome obstacles to achieve their objectives. Actors portraying these characters rely on action verbs to generate belief within themselves and to motivate them as they interpret their lines and move appropriately on stage.
What I offer is a qualitative researcher’s array of actions from which to draw to overcome the obstacles to thinking to achieve an analysis of your data. But unlike the prescripted text of a play in which the obstacles, strategies, and outcomes have been predetermined by the playwright, your work must be improvisational—acting, reacting, and interacting with data on a moment-by-moment basis to determine what obstacles stand in your way and thus what strategies you should take to reach your goals.
Another intriguing quote to keep in mind comes from research methodologist Robert E. Stake ( 1995 ), who posited, “Good research is not about good methods as much as it is about good thinking” (p. 19). In other words, strategies can take you only so far. You can have a box full of tools, but if you do not know how to use them well or use them creatively, the collection seems rather purposeless. One of the best ways we learn is by doing . So, pick up one or more of these strategies (in the form of verbs) and take analytic action with your data. Also keep in mind that these are discussed in the order in which they may typically occur, although humans think cyclically, iteratively, and reverberatively, and each research project has its unique contexts and needs. Be prepared for your mind to jump purposefully and/or idiosyncratically from one strategy to another throughout the study.
Qualitative Data Analysis Strategy: To Foresee
To foresee in qualitative data analysis (QDA) is to reflect beforehand on what forms of data you will most likely need and collect, which thus informs what types of data analytic strategies you anticipate using. Analysis, in a way, begins even before you collect data (Saldaña & Omasta, 2018 ). As you design your research study in your mind and on a text editing page, one strategy is to consider what types of data you may need to help inform and answer your central and related research questions. Interview transcripts, participant observation field notes, documents, artifacts, photographs, video recordings, and so on are not only forms of data but also foundations for how you may plan to analyze them. A participant interview, for example, suggests that you will transcribe all or relevant portions of the recording and use both the transcription and the recording itself as sources for data analysis. Any analytic memos (discussed later) you make about your impressions of the interview also become data to analyze. Even the computing software you plan to employ will be relevant to data analysis because it may help or hinder your efforts.
As your research design formulates, compose one to two paragraphs that outline how your QDA may proceed. This will necessitate that you have some background knowledge of the vast array of methods available to you. Thus, surveying the literature is vital preparatory work.
Qualitative Data Analysis Strategy: To Survey
To survey in QDA is to look for and consider the applicability of the QDA literature in your field that may provide useful guidance for your forthcoming data analytic work. General sources in QDA will provide a good starting point for acquainting you with the data analysis strategies available for the variety of methodologies or genres in qualitative inquiry (e.g., ethnography, phenomenology, case study, arts-based research, mixed methods). One of the most accessible (and humorous) is Galman’s ( 2013 ) The Good, the Bad, and the Data , and one of the most richly detailed is Frederick J. Wertz et al.’s ( 2011 ) Five Ways of Doing Qualitative Analysis . The author’s core texts for this chapter come from The Coding Manual for Qualitative Researchers (Saldaña, 2016 ) and Qualitative Research: Analyzing Life (Saldaña & Omasta, 2018 ).
If your study’s methodology or approach is grounded theory, for example, then a survey of methods works by authors such as Barney G. Glaser, Anselm L. Strauss, Juliet Corbin, and, in particular, the prolific Kathy Charmaz ( 2014 ) may be expected. But there has been a recent outpouring of additional book publications in grounded theory by Birks and Mills ( 2015 ), Bryant ( 2017 ), Bryant and Charmaz ( 2019 ), and Stern and Porr ( 2011 ), plus the legacy of thousands of articles and chapters across many disciplines that have addressed grounded theory in their studies.
Fields such as education, psychology, social work, healthcare, and others also have their own QDA methods literature in the form of texts and journals, as well as international conferences and workshops for members of the profession. It is important to have had some university coursework and/or mentorship in qualitative research to suitably prepare you for the intricacies of QDA, and you must acknowledge that the emergent nature of qualitative inquiry may require you to adopt analysis strategies that differ from what you originally planned.
Qualitative Data Analysis Strategy: To Collect
To collect in QDA is to receive the data given to you by participants and those data you actively gather to inform your study. Qualitative data analysis is concurrent with data collection and management. As interviews are transcribed, field notes are fleshed out, and documents are filed, the researcher uses opportunities to carefully read the corpus and make preliminary notations directly on the data documents by highlighting, bolding, italicizing, or noting in some way any particularly interesting or salient portions. As these data are initially reviewed, the researcher also composes supplemental analytic memos that include first impressions, reminders for follow-up, preliminary connections, and other thinking matters about the phenomena at work.
Some of the most common fieldwork tools you might use to collect data are notepads, pens and pencils; file folders for hard-copy documents; a laptop, tablet, or desktop with text editing software (Microsoft Word and Excel are most useful) and Internet access; and a digital camera and voice recorder (functions available on many electronic devices such as smartphones). Some fieldworkers may even employ a digital video camera to record social action, as long as participant permissions have been secured. But everything originates from the researcher. Your senses are immersed in the cultural milieu you study, taking in and holding onto relevant details, or significant trivia , as I call them. You become a human camera, zooming out to capture the broad landscape of your field site one day and then zooming in on a particularly interesting individual or phenomenon the next. Your analysis is only as good as the data you collect.
Fieldwork can be an overwhelming experience because so many details of social life are happening in front of you. Take a holistic approach to your entrée, but as you become more familiar with the setting and participants, actively focus on things that relate to your research topic and questions. Keep yourself open to the intriguing, surprising, and disturbing (Sunstein & Chiseri-Strater, 2012 , p. 115), because these facets enrich your study by making you aware of the unexpected.
Qualitative Data Analysis Strategy: To Feel
To feel in QDA is to gain deep emotional insight into the social worlds you study and what it means to be human. Virtually everything we do has an accompanying emotion(s), and feelings are both reactions and stimuli for action. Others’ emotions clue you to their motives, values, attitudes, beliefs, worldviews, identities, and other subjective perceptions and interpretations. Acknowledge that emotional detachment is not possible in field research. Attunement to the emotional experiences of your participants plus sympathetic and empathetic responses to the actions around you are necessary in qualitative endeavors. Your own emotional responses during fieldwork are also data because they document the tacit and visceral. It is important during such analytic reflection to assess why your emotional reactions were as they were. But it is equally important not to let emotions alone steer the course of your study. A proper balance must be found between feelings and facts.
Qualitative Data Analysis Strategy: To Organize
To organize in QDA is to maintain an orderly repository of data for easy access and analysis. Even in the smallest of qualitative studies, a large amount of data will be collected across time. Prepare both a hard drive and hard-copy folders for digital data and paperwork, and back up all materials for security from loss. I recommend that each data unit (e.g., one interview transcript, one document, one day’s worth of field notes) have its own file, with subfolders specifying the data forms and research study logistics (e.g., interviews, field notes, documents, institutional review board correspondence, calendar).
For small-scale qualitative studies, I have found it quite useful to maintain one large master file with all participant and field site data copied and combined with the literature review and accompanying researcher analytic memos. This master file is used to cut and paste related passages together, deleting what seems unnecessary as the study proceeds and eventually transforming the document into the final report itself. Cosmetic devices such as font style, font size, rich text (italicizing, bolding, underlining, etc.), and color can help you distinguish between different data forms and highlight significant passages. For example, descriptive, narrative passages of field notes are logged in regular font. “Quotations, things spoken by participants, are logged in bold font.” Observer’s comments, such as the researcher’s subjective impressions or analytic jottings, are set in italics.
Qualitative Data Analysis Strategy: To Jot
To jot in QDA is to write occasional, brief notes about your thinking or reminders for follow-up. A jot is a phrase or brief sentence that will fit on a standard-size sticky note. As data are brought and documented together, take some initial time to review their contents and jot some notes about preliminary patterns, participant quotes that seem vivid, anomalies in the data, and so forth.
As you work on a project, keep something to write with or to voice record with you at all times to capture your fleeting thoughts. You will most likely find yourself thinking about your research when you are not working exclusively on the project, and a “mental jot” may occur to you as you ruminate on logistical or analytic matters. Document the thought in some way for later retrieval and elaboration as an analytic memo.
Qualitative Data Analysis Strategy: To Prioritize
To prioritize in QDA is to determine which data are most significant in your corpus and which tasks are most necessary. During fieldwork, massive amounts of data in various forms may be collected, and your mind can be easily overwhelmed by the magnitude of the quantity, its richness, and its management. Decisions will need to be made about the most pertinent data because they help answer your research questions or emerge as salient pieces of evidence. As a sweeping generalization, approximately one half to two thirds of what you collect may become unnecessary as you proceed toward the more formal stages of QDA.
To prioritize in QDA is also to determine what matters most in your assembly of codes, categories, patterns, themes, assertions, propositions, and concepts. Return to your research purpose and questions to keep you framed for what the focus should be.
Qualitative Data Analysis Strategy: To Analyze
To analyze in QDA is to observe and discern patterns within data and to construct meanings that seem to capture their essences and essentials. Just as there are a variety of genres, elements, and styles of qualitative research, so too are there a variety of methods available for QDA. Analytic choices are most often based on what methods will harmonize with your genre selection and conceptual framework, what will generate the most sufficient answers to your research questions, and what will best represent and present the project’s findings.
Analysis can range from the factual to the conceptual to the interpretive. Analysis can also range from a straightforward descriptive account to an emergently constructed grounded theory to an evocatively composed short story. A qualitative research project’s outcomes may range from rigorously achieved, insightful answers to open-ended, evocative questions; from rich descriptive detail to a bullet-point list of themes; and from third-person, objective reportage to first-person, emotion-laden poetry. Just as there are multiple destinations in qualitative research, there are multiple pathways and journeys along the way.
Analysis is accelerated as you take cognitive ownership of your data. By reading and rereading the corpus, you gain intimate familiarity with its contents and begin to notice significant details as well as make new connections and insights about their meanings. Patterns, categories, themes, and their interrelationships become more evident the more you know the subtleties of the database.
Since qualitative research’s design, fieldwork, and data collection are most often provisional, emergent, and evolutionary processes, you reflect on and analyze the data as you gather them and proceed through the project. If preplanned methods are not working, you change them to secure the data you need. There is generally a postfieldwork period when continued reflection and more systematic data analysis occur, concurrent with or followed by additional data collection, if needed, and the more formal write-up of the study, which is in itself an analytic act. Through field note writing, interview transcribing, analytic memo writing, and other documentation processes, you gain cognitive ownership of your data; and the intuitive, tacit, synthesizing capabilities of your brain begin sensing patterns, making connections, and seeing the bigger picture. The purpose and outcome of data analysis is to reveal to others through fresh insights what we have observed and discovered about the human condition. Fortunately, there are heuristics for reorganizing and reflecting on your qualitative data to help you achieve that goal.
Qualitative Data Analysis Strategy: To Pattern
To pattern in QDA is to detect similarities within and regularities among the data you have collected. The natural world is filled with patterns because we, as humans, have constructed them as such. Stars in the night sky are not just a random assembly; our ancestors pieced them together to form constellations like the Big Dipper. A collection of flowers growing wild in a field has a pattern, as does an individual flower’s patterns of leaves and petals. Look at the physical objects humans have created and notice how pattern oriented we are in our construction, organization, and decoration. Look around you in your environment and notice how many patterns are evident on your clothing, in a room, and on most objects themselves. Even our sometimes mundane daily and long-term human actions are reproduced patterns in the form of routines, rituals, rules, roles, and relationships (Saldaña & Omasta, 2018 ).
This human propensity for pattern-making follows us into QDA. From the vast array of interview transcripts, field notes, documents, and other forms of data, there is this instinctive, hardwired need to bring order to the collection—not just to reorganize it but to look for and construct patterns out of it. The discernment of patterns is one of the first steps in the data analytic process, and the methods described next are recommended ways to construct them.
Qualitative Data Analysis Strategy: To Code
To code in QDA is to assign a truncated, symbolic meaning to each datum for purposes of qualitative analysis—primarily patterning and categorizing. Coding is a heuristic—a method of discovery—to the meanings of individual sections of data. These codes function as a way of patterning, classifying, and later reorganizing them into emergent categories for further analysis. Different types of codes exist for different types of research genres and qualitative data analytic approaches, but this chapter will focus on only a few selected methods. First, a code can be defined as follows:
A code in qualitative data analysis is most often a word or short phrase that symbolically assigns a summative, salient, essence-capturing, and/or evocative attribute for a portion of language-based or visual data. The data can consist of interview transcripts, participant observation field notes, journals, documents, open-ended survey responses, drawings, artifacts, photographs, video, Internet sites, e-mail correspondence, academic and fictional literature, and so on. The portion of data coded … can range in magnitude from a single word to a full paragraph, an entire page of text or a stream of moving images.… Just as a title represents and captures a book or film or poem’s primary content and essence, so does a code represent and capture a datum’s primary content and essence. (Saldaña, 2016 , p. 4)
One helpful precoding task is to divide or parse long selections of field note or interview transcript data into shorter stanzas . Stanza division unitizes or “chunks” the corpus into more manageable paragraph-like units for coding assignments and analysis. The transcript sample that follows illustrates one possible way of inserting line breaks between self-standing passages of interview text for easier readability.
Process Coding
As a first coding example, the following interview excerpt about an employed, single, lower middle-class adult male’s spending habits during a difficult economic period in the United States is coded in the right-hand margin in capital letters. The superscript numbers match the beginning of the datum unit with its corresponding code. This method is called process coding (Charmaz, 2014 ), and it uses gerunds (“-ing” words) exclusively to represent action suggested by the data. Processes can consist of observable human actions (e.g., BUYING BARGAINS), mental or internal processes (e.g., THINKING TWICE), and more conceptual ideas (e.g., APPRECIATING WHAT YOU’VE GOT). Notice that the interviewer’s (I) portions are not coded, just the participant’s (P). A code is applied each time the subtopic of the interview shifts—even within a stanza—and the same codes can (and should) be used more than once if the subtopics are similar. The central research question driving this qualitative study is, “In what ways are middle-class Americans influenced and affected by an economic recession?”
Different researchers analyzing this same piece of data may develop completely different codes, depending on their personal lenses, filters, and angles. The previous codes are only one person’s interpretation of what is happening in the data, not a definitive list. The process codes have transformed the raw data units into new symbolic representations for analysis. A listing of the codes applied to this interview transcript, in the order they appear, reads:
BUYING BARGAINS
QUESTIONING A PURCHASE
THINKING TWICE
STOCKING UP
REFUSING SACRIFICE
PRIORITIZING
FINDING ALTERNATIVES
LIVING CHEAPLY
NOTICING CHANGES
STAYING INFORMED
MAINTAINING HEALTH
PICKING UP THE TAB
APPRECIATING WHAT YOU’VE GOT
Coding the data is the first step in this approach to QDA, and categorization is just one of the next possible steps.
Qualitative Data Analysis Strategy: To Categorize
To categorize in QDA is to cluster similar or comparable codes into groups for pattern construction and further analysis. Humans categorize things in innumerable ways. Think of an average apartment or house’s layout. The rooms of a dwelling have been constructed or categorized by their builders and occupants according to function. A kitchen is designated as an area to store and prepare food and to store the cooking and dining materials, such as pots, pans, and utensils. A bedroom is designated for sleeping, a closet for clothing storage, a bathroom for bodily functions and hygiene, and so on. Each room is like a category in which related and relevant patterns of human action occur. There are exceptions now and then, such as eating breakfast in bed rather than in a dining area or living in a small studio apartment in which most possessions are contained within one large room (but nonetheless are most often organized and clustered into subcategories according to function and optimal use of space).
The point is that the patterns of social action we designate into categories during QDA are not perfectly bounded. Category construction is our best attempt to cluster the most seemingly alike things into the most seemingly appropriate groups. Categorizing is reorganizing and reordering the vast array of data from a study because it is from these smaller, larger, and meaning-rich units that we can better grasp the particular features of each one and the categories’ possible interrelationships with one another.
One analytic strategy with a list of codes is to classify them into similar clusters. The same codes share the same category, but it is also possible that a single code can merit its own group if you feel it is unique enough. After the codes have been classified, a category label is applied to each grouping. Sometimes a code can also double as a category name if you feel it best summarizes the totality of the cluster. Like coding, categorizing is an interpretive act, because there can be different ways of separating and collecting codes that seem to belong together. The cut-and-paste functions of text editing software are most useful for exploring which codes share something in common.
Below is my categorization of the 15 codes generated from the interview transcript presented earlier. Like the gerunds for process codes, the categories have also been labeled as “-ing” words to connote action. And there was no particular reason why 15 codes resulted in three categories—there could have been less or even more, but this is how the array came together after my reflections on which codes seemed to belong together. The category labels are ways of answering why they belong together. For at-a-glance differentiation, I place codes in CAPITAL LETTERS and categories in upper- and lowercase Bold Font :
Category 1: Thinking Strategically
Category 2: Spending Strategically
Category 3: Living Strategically
Notice that the three category labels share a common word: strategically . Where did this word come from? It came from analytic reflection on the original data, the codes, and the process of categorizing the codes and generating their category labels. It was the analyst’s choice based on the interpretation of what primary action was happening. Your categories generated from your coded data do not need to share a common word or phrase, but I find that this technique, when appropriate, helps build a sense of unity to the initial analytic scheme.
The three categories— Thinking Strategically, Spending Strategically , and Living Strategically —are then reflected on for how they might interact and interplay. This is where the next major facet of data analysis, analytic memos, enters the scheme. But a necessary section on the basic principles of interrelationship and analytic reasoning must precede that discussion.
Qualitative Data Analysis Strategy: To Interrelate
To interrelate in QDA is to propose connections within, between, and among the constituent elements of analyzed data. One task of QDA is to explore the ways our patterns and categories interact and interplay. I use these terms to suggest the qualitative equivalent of statistical correlation, but interaction and interplay are much more than a simple relationship. They imply interrelationship . Interaction refers to reverberative connections—for example, how one or more categories might influence and affect the others, how categories operate concurrently, or whether there is some kind of domino effect to them. Interplay refers to the structural and processual nature of categories—for example, whether some type of sequential order, hierarchy, or taxonomy exists; whether any overlaps occur; whether there is superordinate and subordinate arrangement; and what types of organizational frameworks or networks might exist among them. The positivist construct of cause and effect becomes influences and affects in QDA.
There can even be patterns of patterns and categories of categories if your mind thinks conceptually and abstractly enough. Our minds can intricately connect multiple phenomena, but only if the data and their analyses support the constructions. We can speculate about interaction and interplay all we want, but it is only through a more systematic investigation of the data—in other words, good thinking—that we can plausibly establish any possible interrelationships.
Qualitative Data Analysis Strategy: To Reason
To reason in QDA is to think in ways that lead to summative findings, causal probabilities, and evaluative conclusions. Unlike quantitative research, with its statistical formulas and established hypothesis-testing protocols, qualitative research has no standardized methods of data analysis. Rest assured, there are recommended guidelines from the field’s scholars and a legacy of analysis strategies from which to draw. But the primary heuristics (or methods of discovery) you apply during a study are retroductive, inductive, substructive, abductive , and deductive reasoning.
Retroduction is historic reconstruction, working backward to figure out how the current conditions came to exist. Induction is what we experientially explore and infer to be transferable from the particular to the general, based on an examination of the evidence and an accumulation of knowledge. Substruction takes things apart to more carefully examine the constituent elements of the whole. Abduction is surmising from a range of possibilities that which is most likely, those explanatory hunches of plausibility based on clues. Deduction is what we generally draw and conclude from established facts and evidence.
It is not always necessary to know the names of these five ways of reasoning as you proceed through analysis. In fact, you will more than likely reverberate quickly from one to another depending on the task at hand. But what is important to remember about reasoning is:
to examine the evidence carefully and make reasonable inferences;
to base your conclusions primarily on the participants’ experiences, not just your own;
not to take the obvious for granted, because sometimes the expected will not happen;
your hunches can be right and, at other times, quite wrong; and
to logically yet imaginatively think about what is going on and how it all comes together.
Futurists and inventors propose three questions when they think about creating new visions for the world: What is possible (induction)? What is plausible (abduction)? What is preferable (deduction)? These same three questions might be posed as you proceed through QDA and particularly through analytic memo writing, which is substructive and retroductive reflection on your analytic work thus far.
Qualitative Data Analysis Strategy: To Memo
To memo in QDA is to reflect in writing on the nuances, inferences, meanings, and transfer of coded and categorized data plus your analytic processes. Like field note writing, perspectives vary among practitioners as to the methods for documenting the researcher’s analytic insights and subjective experiences. Some advise that such reflections should be included in field notes as relevant to the data. Others advise that a separate researcher’s journal should be maintained for recording these impressions. And still others advise that these thoughts be documented as separate analytic memos. I prescribe the latter as a method because it is generated by and directly connected to the data themselves.
An analytic memo is a “think piece” of reflective free writing, a narrative that sets in words your interpretations of the data. Coding and categorizing are heuristics to detect some of the possible patterns and interrelationships at work within the corpus, and an analytic memo further articulates your retroductive, inductive, substructive, abductive, and deductive thinking processes on what things may mean. Though the metaphor is a bit flawed and limiting, think of codes and their consequent categories as separate jigsaw puzzle pieces and their integration into an analytic memo as the trial assembly of the complete picture.
What follows is an example of an analytic memo based on the earlier process coded and categorized interview transcript. It is intended not as the final write-up for a publication, but as an open-ended reflection on the phenomena and processes suggested by the data and their analysis thus far. As the study proceeds, however, initial and substantive analytic memos can be revisited and revised for eventual integration into the final report. Note how the memo is dated and given a title for future and further categorization, how participant quotes are occasionally included for evidentiary support, and how the category names are bolded and the codes kept in capital letters to show how they integrate or weave into the thinking:
April 14, 2017 EMERGENT CATEGORIES: A STRATEGIC AMALGAM There’s a popular saying: “Smart is the new rich.” This participant is Thinking Strategically about his spending through such tactics as THINKING TWICE and QUESTIONING A PURCHASE before he decides to invest in a product. There’s a heightened awareness of both immediate trends and forthcoming economic bad news that positively affects his Spending Strategically . However, he seems unaware that there are even more ways of LIVING CHEAPLY by FINDING ALTERNATIVES. He dines at all-you-can-eat restaurants as a way of STOCKING UP on meals, but doesn’t state that he could bring lunch from home to work, possibly saving even more money. One of his “bad habits” is cigarettes, which he refuses to give up; but he doesn’t seem to realize that by quitting smoking he could save even more money, not to mention possible health care costs. He balks at the idea of paying $2.00 for a soft drink, but doesn’t mind paying $6.00–$7.00 for a pack of cigarettes. Penny-wise and pound-foolish. Addictions skew priorities. Living Strategically , for this participant during “scary times,” appears to be a combination of PRIORITIZING those things which cannot be helped, such as pet care and personal dental care; REFUSING SACRIFICE for maintaining personal creature-comforts; and FINDING ALTERNATIVES to high costs and excessive spending. Living Strategically is an amalgam of thinking and action-oriented strategies.
There are several recommended topics for analytic memo writing throughout the qualitative study. Memos are opportunities to reflect on and write about:
A descriptive summary of the data;
How the researcher personally relates to the participants and/or the phenomenon;
The participants’ actions, reactions, and interactions;
The participants’ routines, rituals, rules, roles, and relationships;
What is surprising, intriguing, or disturbing (Sunstein & Chiseri-Strater, 2012 , p. 115);
Code choices and their operational definitions;
Emergent patterns, categories, themes, concepts, assertions, and propositions;
The possible networks and processes (links, connections, overlaps, flows) among the codes, patterns, categories, themes, concepts, assertions, and propositions;
An emergent or related existent theory;
Any problems with the study;
Any personal or ethical dilemmas with the study;
Future directions for the study;
The analytic memos generated thus far (i.e., metamemos);
Tentative answers to the study’s research questions; and
The final report for the study. (adapted from Saldaña & Omasta, 2018 , p. 54)
Since writing is analysis, analytic memos expand on the inferential meanings of the truncated codes, categories, and patterns as a transitional stage into a more coherent narrative with hopefully rich social insight.
Qualitative Data Analysis Strategy: To Code—A Different Way
The first example of coding illustrated process coding, a way of exploring general social action among humans. But sometimes a researcher works with an individual case study in which the language is unique or with someone the researcher wishes to honor by maintaining the authenticity of his or her speech in the analysis. These reasons suggest that a more participant-centered form of coding may be more appropriate.
In Vivo Coding
A second frequently applied method of coding is called in vivo coding. The root meaning of in vivo is “in that which is alive”; it refers to a code based on the actual language used by the participant (Strauss, 1987 ). The words or phrases in the data record you select as codes are those that seem to stand out as significant or summative of what is being said.
Using the same transcript of the male participant living in difficult economic times, in vivo codes are listed in the right-hand column. I recommend that in vivo codes be placed in quotation marks as a way of designating that the code is extracted directly from the data record. Note that instead of 15 codes generated from process coding, the total number of in vivo codes is 30. This is not to suggest that there should be specific numbers or ranges of codes used for particular methods. In vivo codes, however, tend to be applied more frequently to data. Again, the interviewer’s questions and prompts are not coded, just the participant’s responses:
The 30 in vivo codes are then extracted from the transcript and could be listed in the order they appear, but this time they are placed in alphabetical order as a heuristic to prepare them for analytic action and reflection:
“ALL-YOU-CAN-EAT”
“ANOTHER DING IN MY WALLET”
“BAD HABITS”
“CHEAP AND FILLING”
“COUPLE OF THOUSAND”
“DON’T REALLY NEED”
“HAVEN’T CHANGED MY HABITS”
“HIGH MAINTENANCE”
“INSURANCE IS JUST WORTHLESS”
“IT ALL ADDS UP”
“LIVED KIND OF CHEAP”
“NOT A BIG SPENDER”
“NOT AS BAD OFF”
“NOT PUTTING AS MUCH INTO SAVINGS”
“PICK UP THE TAB”
“SCARY TIMES”
“SKYROCKETED”
“SPENDING MORE”
“THE LITTLE THINGS”
“THINK TWICE”
“TWO-FOR-ONE”
Even though no systematic categorization has been conducted with the codes thus far, an analytic memo of first impressions can still be composed:
March 19, 2017 CODE CHOICES: THE EVERYDAY LANGUAGE OF ECONOMICS After eyeballing the in vivo codes list, I noticed that variants of “CHEAP” appear most often. I recall a running joke between me and a friend of mine when we were shopping for sales. We’d say, “We’re not ‘cheap,’ we’re frugal .” There’s no formal economic or business language in this transcript—no terms such as “recession” or “downsizing”—just the everyday language of one person trying to cope during “SCARY TIMES” with “ANOTHER DING IN MY WALLET.” The participant notes that he’s always “LIVED KIND OF CHEAP” and is “NOT A BIG SPENDER” and, due to his employment, “NOT AS BAD OFF” as others in the country. Yet even with his middle class status, he’s still feeling the monetary pinch, dining at inexpensive “ALL-YOU-CAN-EAT” restaurants and worried about the rising price of peanut butter, observing that he’s “NOT PUTTING AS MUCH INTO SAVINGS” as he used to. Of all the codes, “ANOTHER DING IN MY WALLET” stands out to me, particularly because on the audio recording he sounded bitter and frustrated. It seems that he’s so concerned about “THE LITTLE THINGS” because of high veterinary and dental charges. The only way to cope with a “COUPLE OF THOUSAND” dollars worth of medical expenses is to find ways of trimming the excess in everyday facets of living: “IT ALL ADDS UP.”
Like process coding, in vivo codes could be clustered into similar categories, but another simple data analytic strategy is also possible.
Qualitative Data Analysis Strategy: To Outline
To outline in QDA is to hierarchically, processually, and/or temporally assemble such things as codes, categories, themes, assertions, propositions, and concepts into a coherent, text-based display. Traditional outlining formats and content provide not only templates for writing a report but also templates for analytic organization. This principle can be found in several computer-assisted qualitative data analysis software (CAQDAS) programs through their use of such functions as “hierarchies,” “trees,” and “nodes,” for example. Basic outlining is simply a way of arranging primary, secondary, and subsecondary items into a patterned display. For example, an organized listing of things in a home might consist of the following:
Large appliances
Refrigerator
Stove-top oven
Microwave oven
Small appliances
Coffee maker
Dining room
In QDA, outlining may include descriptive nouns or topics but, depending on the study, it may also involve processes or phenomena in extended passages, such as in vivo codes or themes.
The complexity of what we learn in the field can be overwhelming, and outlining is a way of organizing and ordering that complexity so that it does not become complicated. The cut-and-paste and tab functions of a text editing page enable you to arrange and rearrange the salient items from your preliminary coded analytic work into a more streamlined flow. By no means do I suggest that the intricate messiness of life can always be organized into neatly formatted arrangements, but outlining is an analytic act that stimulates deep reflection on both the interconnectedness and the interrelationships of what we study. As an example, here are the 30 in vivo codes generated from the initial transcript analysis, arranged in such a way as to construct five major categories:
Now that the codes have been rearranged into an outline format, an analytic memo is composed to expand on the rationale and constructed meanings in progress:
March 19, 2017 NETWORKS: EMERGENT CATEGORIES The five major categories I constructed from the in vivo codes are: “SCARY TIMES,” “PRIORTY,” “ANOTHER DING IN MY WALLET,” “THE LITTLE THINGS,” and “LIVED KIND OF CHEAP.” One of the things that hit me today was that the reason he may be pinching pennies on smaller purchases is that he cannot control the larger ones he has to deal with. Perhaps the only way we can cope with or seem to have some sense of agency over major expenses is to cut back on the smaller ones that we can control. $1,000 for a dental bill? Skip lunch for a few days a week. Insulin medication to buy for a pet? Don’t buy a soft drink from a vending machine. Using this reasoning, let me try to interrelate and weave the categories together as they relate to this particular participant: During these scary economic times, he prioritizes his spending because there seems to be just one ding after another to his wallet. A general lifestyle of living cheaply and keeping an eye out for how to save money on the little things compensates for those major expenses beyond his control.
Qualitative Data Analysis Strategy: To Code—In Even More Ways
The process and in vivo coding examples thus far have demonstrated only two specific methods of 33 documented approaches (Saldaña, 2016 ). Which one(s) you choose for your analysis depends on such factors as your conceptual framework, the genre of qualitative research for your project, the types of data you collect, and so on. The following sections present four additional approaches available for coding qualitative data that you may find useful as starting points.
Descriptive Coding
Descriptive codes are primarily nouns that simply summarize the topic of a datum. This coding approach is particularly useful when you have different types of data gathered for one study, such as interview transcripts, field notes, open-ended survey responses, documents, and visual materials such as photographs. Descriptive codes not only help categorize but also index the data corpus’s basic contents for further analytic work. An example of an interview portion coded descriptively, taken from the participant living in tough economic times, follows to illustrate how the same data can be coded in multiple ways:
For initial analysis, descriptive codes are clustered into similar categories to detect such patterns as frequency (i.e., categories with the largest number of codes) and interrelationship (i.e., categories that seem to connect in some way). Keep in mind that descriptive coding should be used sparingly with interview transcript data because other coding methods will reveal richer participant dynamics.
Values Coding
Values coding identifies the values, attitudes, and beliefs of a participant, as shared by the individual and/or interpreted by the analyst. This coding method infers the “heart and mind” of an individual or group’s worldview as to what is important, perceived as true, maintained as opinion, and felt strongly. The three constructs are coded separately but are part of a complex interconnected system.
Briefly, a value (V) is what we attribute as important, be it a person, thing, or idea. An attitude (A) is the evaluative way we think and feel about ourselves, others, things, or ideas. A belief (B) is what we think and feel as true or necessary, formed from our “personal knowledge, experiences, opinions, prejudices, morals, and other interpretive perceptions of the social world” (Saldaña, 2016 , p. 132). Values coding explores intrapersonal, interpersonal, and cultural constructs, or ethos . It is an admittedly slippery task to code this way because it is sometimes difficult to discern what is a value, attitude, or belief since they are intricately interrelated. But the depth you can potentially obtain is rich. An example of values coding follows:
For analysis, categorize the codes for each of the three different constructs together (i.e., all values in one group, attitudes in a second group, and beliefs in a third group). Analytic memo writing about the patterns and possible interrelationships may reveal a more detailed and intricate worldview of the participant.
Dramaturgical Coding
Dramaturgical coding perceives life as performance and its participants as characters in a social drama. Codes are assigned to the data (i.e., a “play script”) that analyze the characters in action, reaction, and interaction. Dramaturgical coding of participants examines their objectives (OBJ) or wants, needs, and motives; the conflicts (CON) or obstacles they face as they try to achieve their objectives; the tactics (TAC) or strategies they employ to reach their objectives; their attitudes (ATT) toward others and their given circumstances; the particular emotions (EMO) they experience throughout; and their subtexts (SUB), or underlying and unspoken thoughts. The following is an example of dramaturgically coded data:
Not included in this particular interview excerpt are the emotions the participant may have experienced or talked about. His later line, “that’s another ding in my wallet,” would have been coded EMO: BITTER. A reader may not have inferred that specific emotion from seeing the line in print. But the interviewer, present during the event and listening carefully to the audio recording during transcription, noted that feeling in his tone of voice.
For analysis, group similar codes together (e.g., all objectives in one group, all conflicts in another group, all tactics in a third group) or string together chains of how participants deal with their circumstances to overcome their obstacles through tactics:
OBJ: SAVING MEAL MONEY → TAC: SKIPPING MEALS + COUPONS
Dramaturgical coding is particularly useful as preliminary work for narrative inquiry story development or arts-based research representations such as performance ethnography. The method explores how the individuals or groups manage problem solving in their daily lives.
Versus Coding
Versus (VS) coding identifies the conflicts, struggles, and power issues observed in social action, reaction, and interaction as an X VS Y code, such as MEN VS WOMEN, CONSERVATIVES VS LIBERALS, FAITH VS LOGIC, and so on. Conflicts are rarely this dichotomous; they are typically nuanced and much more complex. But humans tend to perceive these struggles with an US VS THEM mindset. The codes can range from the observable to the conceptual and can be applied to data that show humans in tension with others, themselves, or ideologies.
What follows are examples of versus codes applied to the case study participant’s descriptions of his major medical expenses:
As an initial analytic tactic, group the versus codes into one of three categories: the Stakeholders , their Perceptions and/or Actions , and the Issues at stake. Examine how the three interrelate and identify the central ideological conflict at work as an X VS Y category. Analytic memos and the final write-up can detail the nuances of the issues.
Remember that what has been profiled in this section is a broad brushstroke description of just a few basic coding processes, several of which can be compatibly mixed and matched within a single analysis (see Saldaña’s 2016 The Coding Manual for Qualitative Researchers for a complete discussion). Certainly with additional data, more in-depth analysis can occur, but coding is only one approach to extracting and constructing preliminary meanings from the data corpus. What now follows are additional methods for qualitative analysis.
Qualitative Data Analysis Strategy: To Theme
To theme in QDA is to construct summative, phenomenological meanings from data through extended passages of text. Unlike codes, which are most often single words or short phrases that symbolically represent a datum, themes are extended phrases or sentences that summarize the manifest (apparent) and latent (underlying) meanings of data (Auerbach & Silverstein, 2003 ; Boyatzis, 1998 ). Themes, intended to represent the essences and essentials of humans’ lived experiences, can also be categorized or listed in superordinate and subordinate outline formats as an analytic tactic.
Below is the interview transcript example used in the previous coding sections. (Hopefully you are not too fatigued at this point with the transcript, but it is important to know how inquiry with the same data set can be approached in several different ways.) During the investigation of the ways middle-class Americans are influenced and affected by an economic recession, the researcher noticed that participants’ stories exhibited facets of what he labeled economic intelligence , or EI (based on the formerly developed theories of Howard Gardner’s multiple intelligences and Daniel Goleman’s emotional intelligence). Notice how theming interprets what is happening through the use of two distinct phrases—ECONOMIC INTELLIGENCE IS (i.e., manifest or apparent meanings) and ECONOMIC INTELLIGENCE MEANS (i.e., latent or underlying meanings):
Unlike the 15 process codes and 30 in vivo codes in the previous examples, there are now 14 themes to work with. They could be listed in the order they appear, but one initial heuristic is to group them separately by “is” and “means” statements to detect any possible patterns (discussed later):
EI IS TAKING ADVANTAGE OF UNEXPECTED OPPORTUNITY
EI IS BUYING CHEAP
EI IS SAVING A FEW DOLLARS NOW AND THEN
EI IS SETTING PRIORITIES
EI IS FINDING CHEAPER FORMS OF ENTERTAINMENT
EI IS NOTICING PERSONAL AND NATIONAL ECONOMIC TRENDS
EI IS TAKING CARE OF ONE’S OWN HEALTH
EI MEANS THINKING BEFORE YOU ACT
EI MEANS SACRIFICE
EI MEANS KNOWING YOUR FLAWS
EI MEANS LIVING AN INEXPENSIVE LIFESTYLE
EI MEANS YOU CANNOT CONTROL EVERYTHING
EI MEANS KNOWING YOUR LUCK
There are several ways to categorize the themes as preparation for analytic memo writing. The first is to arrange them in outline format with superordinate and subordinate levels, based on how the themes seem to take organizational shape and structure. Simply cutting and pasting the themes in multiple arrangements on a text editing page eventually develops a sense of order to them. For example:
A second approach is to categorize the themes into similar clusters and to develop different category labels or theoretical constructs . A theoretical construct is an abstraction that transforms the central phenomenon’s themes into broader applications but can still use “is” and “means” as prompts to capture the bigger picture at work:
Theoretical Construct 1: EI Means Knowing the Unfortunate Present
Supporting Themes:
Theoretical Construct 2: EI Is Cultivating a Small Fortune
Theoretical Construct 3: EI Means a Fortunate Future
What follows is an analytic memo generated from the cut-and-paste arrangement of themes into “is” and “means” statements, into an outline, and into theoretical constructs:
March 19, 2017 EMERGENT THEMES: FORTUNE/FORTUNATELY/UNFORTUNATELY I first reorganized the themes by listing them in two groups: “is” and “means.” The “is” statements seemed to contain positive actions and constructive strategies for economic intelligence. The “means” statements held primarily a sense of caution and restriction with a touch of negativity thrown in. The first outline with two major themes, LIVING AN INEXPENSIVE LIFESTYLE and YOU CANNOT CONTROL EVERYTHING also had this same tone. This reminded me of the old children’s picture book, Fortunately/Unfortunately , and the themes of “fortune” as a motif for the three theoretical constructs came to mind. Knowing the Unfortunate Present means knowing what’s (most) important and what’s (mostly) uncontrollable in one’s personal economic life. Cultivating a Small Fortune consists of those small money-saving actions that, over time, become part of one’s lifestyle. A Fortunate Future consists of heightened awareness of trends and opportunities at micro and macro levels, with the understanding that health matters can idiosyncratically affect one’s fortune. These three constructs comprise this particular individual’s EI—economic intelligence.
Again, keep in mind that the examples for coding and theming were from one small interview transcript excerpt. The number of codes and their categorization would increase, given a longer interview and/or multiple interviews to analyze. But the same basic principles apply: codes and themes relegated into patterned and categorized forms are heuristics—stimuli for good thinking through the analytic memo-writing process on how everything plausibly interrelates. Methodologists vary in the number of recommended final categories that result from analysis, ranging anywhere from three to seven, with traditional grounded theorists prescribing one central or core category from coded work.
Qualitative Data Analysis Strategy: To Assert
To assert in QDA is to put forward statements that summarize particular fieldwork and analytic observations that the researcher believes credibly represent and transcend the experiences. Educational anthropologist Frederick Erickson ( 1986 ) wrote a significant and influential chapter on qualitative methods that outlined heuristics for assertion development . Assertions are declarative statements of summative synthesis, supported by confirming evidence from the data and revised when disconfirming evidence or discrepant cases require modification of the assertions. These summative statements are generated from an interpretive review of the data corpus and then supported and illustrated through narrative vignettes—reconstructed stories from field notes, interview transcripts, or other data sources that provide a vivid profile as part of the evidentiary warrant.
Coding or theming data can certainly precede assertion development as a way of gaining intimate familiarity with the data, but Erickson’s ( 1986 ) methods are a more admittedly intuitive yet systematic heuristic for analysis. Erickson promotes analytic induction and exploration of and inferences about the data, based on an examination of the evidence and an accumulation of knowledge. The goal is not to look for “proof” to support the assertions, but to look for plausibility of inference-laden observations about the local and particular social world under investigation.
Assertion development is the writing of general statements, plus subordinate yet related ones called subassertions and a major statement called a key assertion that represents the totality of the data. One also looks for key linkages between them, meaning that the key assertion links to its related assertions, which then link to their respective subassertions. Subassertions can include particulars about any discrepant related cases or specify components of their parent assertions.
Excerpts from the interview transcript of our case study will be used to illustrate assertion development at work. By now, you should be quite familiar with the contents, so I will proceed directly to the analytic example. First, there is a series of thematically related statements the participant makes:
“Buy one package of chicken, get the second one free. Now that was a bargain. And I got some.”
“With Sweet Tomatoes I get those coupons for a few bucks off for lunch, so that really helps.”
“I don’t go to movies anymore. I rent DVDs from Netflix or Redbox or watch movies online—so much cheaper than paying over ten or twelve bucks for a movie ticket.”
Assertions can be categorized into low-level and high-level inferences . Low-level inferences address and summarize what is happening within the particulars of the case or field site—the micro . High-level inferences extend beyond the particulars to speculate on what it means in the more general social scheme of things—the meso or macro . A reasonable low-level assertion about the three statements above collectively might read, The participant finds several small ways to save money during a difficult economic period . A high-level inference that transcends the case to the meso level might read, Selected businesses provide alternatives and opportunities to buy products and services at reduced rates during a recession to maintain consumer spending.
Assertions are instantiated (i.e., supported) by concrete instances of action or participant testimony, whose patterns lead to more general description outside the specific field site. The author’s interpretive commentary can be interspersed throughout the report, but the assertions should be supported with the evidentiary warrant . A few assertions and subassertions based on the case interview transcript might read as follows (and notice how high-level assertions serve as the paragraphs’ topic sentences):
Selected businesses provide alternatives and opportunities to buy products and services at reduced rates during a recession to maintain consumer spending. Restaurants, for example, need to find ways during difficult economic periods when potential customers may be opting to eat inexpensively at home rather than spending more money by dining out. Special offers can motivate cash-strapped clientele to patronize restaurants more frequently. An adult male dealing with such major expenses as underinsured dental care offers: “With Sweet Tomatoes I get those coupons for a few bucks off for lunch, so that really helps.” The film and video industries also seem to be suffering from a double-whammy during the current recession: less consumer spending on higher-priced entertainment, resulting in a reduced rate of movie theater attendance (recently 39 percent of the American population, according to a CNN report); coupled with a media technology and business revolution that provides consumers less costly alternatives through video rentals and Internet viewing: “I don’t go to movies anymore. I rent DVDs from Netflix or Redbox or watch movies online—so much cheaper than paying over ten or twelve bucks for a movie ticket.”
To clarify terminology, any assertion that has an if–then or predictive structure to it is called a proposition since it proposes a conditional event. For example, this assertion is also a proposition: “Special offers can motivate cash-strapped clientele to patronize restaurants more frequently.” Propositions are the building blocks of hypothesis testing in the field and for later theory construction. Research not only documents human action but also can sometimes formulate statements that predict it. This provides a transferable and generalizable quality in our findings to other comparable settings and contexts. And to clarify terminology further, all propositions are assertions, but not all assertions are propositions.
Particularizability —the search for specific and unique dimensions of action at a site and/or the specific and unique perspectives of an individual participant—is not intended to filter out trivial excess but to magnify the salient characteristics of local meaning. Although generalizable knowledge is difficult to formulate in qualitative inquiry since each naturalistic setting will contain its own unique set of social and cultural conditions, there will be some aspects of social action that are plausibly universal or “generic” across settings and perhaps even across time.
To work toward this, Erickson advocates that the interpretive researcher look for “concrete universals” by studying actions at a particular site in detail and then comparing those actions to actions at other sites that have also been studied in detail. The exhibit or display of these generalizable features is to provide a synoptic representation, or a view of the whole. What the researcher attempts to uncover is what is both particular and general at the site of interest, preferably from the perspective of the participants. It is from the detailed analysis of actions at a specific site that these universals can be concretely discerned, rather than abstractly constructed as in grounded theory.
In sum, assertion development is a qualitative data analytic strategy that relies on the researcher’s intense review of interview transcripts, field notes, documents, and other data to inductively formulate, with reasonable certainty, composite statements that credibly summarize and interpret participant actions and meanings and their possible representation of and transfer into broader social contexts and issues.
Qualitative Data Analysis Strategy: To Display
To display in QDA is to visually present the processes and dynamics of human or conceptual action represented in the data. Qualitative researchers use not only language but also illustrations to both analyze and display the phenomena and processes at work in the data. Tables, charts, matrices, flow diagrams, and other models and graphics help both you and your readers cognitively and conceptually grasp the essence and essentials of your findings. As you have seen thus far, even simple outlining of codes, categories, and themes is one visual tactic for organizing the scope of the data. Rich text, font, and format features such as italicizing, bolding, capitalizing, indenting, and bullet pointing provide simple emphasis to selected words and phrases within the longer narrative.
Think display was a phrase coined by methodologists Miles and Huberman ( 1994 ) to encourage the researcher to think visually as data were collected and analyzed. The magnitude of text can be essentialized into graphics for at-a-glance review. Bins in various shapes and lines of various thicknesses, along with arrows suggesting pathways and direction, render the study a portrait of action. Bins can include the names of codes, categories, concepts, processes, key participants, and/or groups.
As a simple example, Figure 29.1 illustrates the three categories’ interrelationship derived from process coding. It displays what could be the apex of this interaction, LIVING STRATEGICALLY, and its connections to THINKING STRATEGICALLY, which influences and affects SPENDING STRATEGICALLY.
Three categories’ interrelationship derived from process coding.
Figure 29.2 represents a slightly more complex (if not playful) model, based on the five major in vivo codes/categories generated from analysis. The graphic is used as a way of initially exploring the interrelationship and flow from one category to another. The use of different font styles, font sizes, and line and arrow thicknesses is intended to suggest the visual qualities of the participant’s language and his dilemmas—a way of heightening in vivo coding even further.
In vivo categories in rich text display
Accompanying graphics are not always necessary for a qualitative report. They can be very helpful for the researcher during the analytic stage as a heuristic for exploring how major ideas interrelate, but illustrations are generally included in published work when they will help supplement and clarify complex processes for readers. Photographs of the field setting or the participants (and only with their written permission) also provide evidentiary reality to the write-up and help your readers get a sense of being there.
Qualitative Data Analysis Strategy: To Narrate
To narrate in QDA is to create an evocative literary representation and presentation of the data in the form of creative nonfiction. All research reports are stories of one kind or another. But there is yet another approach to QDA that intentionally documents the research experience as story, in its traditional literary sense. Narrative inquiry serves to plot and story-line the participant’s experiences into what might be initially perceived as a fictional short story or novel. But the story is carefully crafted and creatively written to provide readers with an almost omniscient perspective about the participants’ worldview. The transformation of the corpus from database to creative nonfiction ranges from systematic transcript analysis to open-ended literary composition. The narrative, however, should be solidly grounded in and emerge from the data as a plausible rendering of social life.
The following is a narrative vignette based on interview transcript selections from the participant living through tough economic times:
Jack stood in front of the soft drink vending machine at work and looked almost worriedly at the selections. With both hands in his pants pockets, his fingers jingled the few coins he had inside them as he contemplated whether he could afford the purchase. Two dollars for a twenty-ounce bottle of Diet Coke. Two dollars. “I can practically get a two-liter bottle for that same price at the grocery store,” he thought. Then Jack remembered the upcoming dental surgery he needed—that would cost one thousand dollars—and the bottle of insulin and syringes he needed to buy for his diabetic, high maintenance cat—almost two hundred dollars. He sighed, took his hands out of his pockets, and walked away from the vending machine. He was skipping lunch that day anyway so he could stock up on dinner later at the cheap-but-filling all-you-can-eat Chinese buffet. He could get his Diet Coke there.
Narrative inquiry representations, like literature, vary in tone, style, and point of view. The common goal, however, is to create an evocative portrait of participants through the aesthetic power of literary form. A story does not always have to have a moral explicitly stated by its author. The reader reflects on personal meanings derived from the piece and how the specific tale relates to one’s self and the social world.
Qualitative Data Analysis Strategy: To Poeticize
To poeticize in QDA is to create an evocative literary representation and presentation of the data in poetic form. One approach to analyzing or documenting analytic findings is to strategically truncate interview transcripts, field notes, and other pertinent data into poetic structures. Like coding, poetic constructions capture the essence and essentials of data in a creative, evocative way. The elegance of the format attests to the power of carefully chosen language to represent and convey complex human experience.
In vivo codes (codes based on the actual words used by participants themselves) can provide imagery, symbols, and metaphors for rich category, theme, concept, and assertion development, in addition to evocative content for arts-based interpretations of the data. Poetic inquiry takes note of what words and phrases seem to stand out from the data corpus as rich material for reinterpretation. Using some of the participant’s own language from the interview transcript illustrated previously, a poetic reconstruction or “found poetry” might read as follows:
Scary Times Scary times … spending more (another ding in my wallet) a couple of thousand (another ding in my wallet) insurance is just worthless (another ding in my wallet) pick up the tab (another ding in my wallet) not putting as much into savings (another ding in my wallet) It all adds up. Think twice: don’t really need skip Think twice, think cheap: coupons bargains two-for-one free Think twice, think cheaper: stock up all-you-can-eat (cheap—and filling) It all adds up.
Anna Deavere Smith, a verbatim theatre performer, attests that people speak in forms of “organic poetry” in everyday life. Thus, in vivo codes can provide core material for poetic representation and presentation of lived experiences, potentially transforming the routine and mundane into the epic. Some researchers also find the genre of poetry to be the most effective way to compose original work that reflects their own fieldwork experiences and autoethnographic stories.
Qualitative Data Analysis Strategy: To Compute
To compute in QDA is to employ specialized software programs for qualitative data management and analysis. The acronym for computer-assisted qualitative data analysis software is CAQDAS. There are diverse opinions among practitioners in the field about the utility of such specialized programs for qualitative data management and analysis. The software, unlike statistical computation, does not actually analyze data for you at higher conceptual levels. These CAQDAS software packages serve primarily as a repository for your data (both textual and visual) that enables you to code them, and they can perform such functions as calculating the number of times a particular word or phrase appears in the data corpus (a particularly useful function for content analysis) and can display selected facets after coding, such as possible interrelationships. Basic software such as Microsoft Word and Excel provides utilities that can store and, with some preformatting and strategic entry, organize qualitative data to enable the researcher’s analytic review. The following Internet addresses are listed to help in exploring selected CAQDAS packages and obtaining demonstration/trial software; video tutorials are available on the companies’ websites and on YouTube:
ATLAS.ti: http://www.atlasti.com
Dedoose: http://www.dedoose.com
HyperRESEARCH: http://www.researchware.com
MAXQDA: http://www.maxqda.com
NVivo: http://www.qsrinternational.com
QDA Miner: http://www.provalisresearch.com
Quirkos: http://www.quirkos.com
Transana: http://www.transana.com
V-Note: http://www.v-note.org
Some qualitative researchers attest that the software is indispensable for qualitative data management, especially for large-scale studies. Others feel that the learning curve of most CAQDAS programs is too lengthy to be of pragmatic value, especially for small-scale studies. From my own experience, if you have an aptitude for picking up quickly on the scripts and syntax of software programs, explore one or more of the packages listed. If you are a novice to qualitative research, though, I recommend working manually or “by hand” for your first project so you can focus exclusively on the data and not on the software.
Qualitative Data Analysis Strategy: To Verify
To verify in QDA is to administer an audit of “quality control” to your analysis. After your data analysis and the development of key findings, you may be thinking to yourself, “Did I get it right?” “Did I learn anything new?” Reliability and validity are terms and constructs of the positivist quantitative paradigm that refer to the replicability and accuracy of measures. But in the qualitative paradigm, other constructs are more appropriate.
Credibility and trustworthiness (Lincoln & Guba, 1985 ) are two factors to consider when collecting and analyzing the data and presenting your findings. In our qualitative research projects, we must present a convincing story to our audiences that we “got it right” methodologically. In other words, the amount of time we spent in the field, the number of participants we interviewed, the analytic methods we used, the thinking processes evident to reach our conclusions, and so on should be “just right” to assure the reader that we have conducted our jobs soundly. But remember that we can never conclusively prove something; we can only, at best, convincingly suggest. Research is an act of persuasion.
Credibility in a qualitative research report can be established in several ways. First, citing the key writers of related works in your literature review is essential. Seasoned researchers will sometimes assess whether a novice has “done her homework” by reviewing the bibliography or references. You need not list everything that seminal writers have published about a topic, but their names should appear at least once as evidence that you know the field’s key figures and their work.
Credibility can also be established by specifying the particular data analysis methods you employed (e.g., “Interview transcripts were taken through two cycles of process coding, resulting in three primary categories”), through corroboration of data analysis with the participants themselves (e.g., “I asked my participants to read and respond to a draft of this report for their confirmation of accuracy and recommendations for revision”), or through your description of how data and findings were substantiated (e.g., “Data sources included interview transcripts, participant observation field notes, and participant response journals to gather multiple perspectives about the phenomenon”).
Data scientist W. Edwards Deming is attributed with offering this cautionary advice about making a convincing argument: “Without data, you’re just another person with an opinion.” Thus, researchers can also support their findings with relevant, specific evidence by quoting participants directly and/or including field note excerpts from the data corpus. These serve both as illustrative examples for readers and to present more credible testimony of what happened in the field.
Trustworthiness, or providing credibility to the writing, is when we inform the reader of our research processes. Some make the case by stating the duration of fieldwork (e.g., “Forty-five clock hours were spent in the field”; “The study extended over a 10-month period”). Others put forth the amounts of data they gathered (e.g., “Sixteen individuals were interviewed”; “My field notes totaled 157 pages”). Sometimes trustworthiness is established when we are up front or confessional with the analytic or ethical dilemmas we encountered (e.g., “It was difficult to watch the participant’s teaching effectiveness erode during fieldwork”; “Analysis was stalled until I recoded the entire data corpus with a new perspective”).
The bottom line is that credibility and trustworthiness are matters of researcher honesty and integrity . Anyone can write that he worked ethically, rigorously, and reflexively, but only the writer will ever know the truth. There is no shame if something goes wrong with your research. In fact, it is more than likely the rule, not the exception. Work and write transparently to achieve credibility and trustworthiness with your readers.
The length of this chapter does not enable me to expand on other QDA strategies such as to conceptualize, theorize, and write. Yet there are even more subtle thinking strategies to employ throughout the research enterprise, such as to synthesize, problematize, and create. Each researcher has his or her own ways of working, and deep reflexivity (another strategy) on your own methodology and methods as a qualitative inquirer throughout fieldwork and writing provides you with metacognitive awareness of data analysis processes and possibilities.
Data analysis is one of the most elusive practices in qualitative research, perhaps because it is a backstage, behind-the-scenes, in-your-head enterprise. It is not that there are no models to follow. It is just that each project is contextual and case specific. The unique data you collect from your unique research design must be approached with your unique analytic signature. It truly is a learning-by-doing process, so accept that and leave yourself open to discovery and insight as you carefully scrutinize the data corpus for patterns, categories, themes, concepts, assertions, propositions, and possibly new theories through strategic analysis.
Auerbach, C. F. , & Silverstein, L. B. ( 2003 ). Qualitative data: An introduction to coding and analysis . New York, NY: New York University Press.
Google Scholar
Google Preview
Birks, M. , & Mills, J. ( 2015 ). Grounded theory: A practical guide (2nd ed.). London, England: Sage.
Boyatzis, R. E. ( 1998 ). Transforming qualitative information: Thematic analysis and code development . Thousand Oaks, CA: Sage.
Bryant, A. ( 2017 ). Grounded theory and grounded theorizing: Pragmatism in research practice. New York, NY: Oxford.
Bryant, A. , & Charmaz, K. (Eds.). ( 2019 ). The Sage handbook of current developments in grounded theory . London, England: Sage.
Charmaz, K. ( 2014 ). Constructing grounded theory: A practical guide through qualitative analysis (2nd ed.). London, England: Sage.
Erickson, F. ( 1986 ). Qualitative methods in research on teaching. In M. C. Wittrock (Ed.), Handbook of research on teaching (3rd ed., pp. 119–161). New York, NY: Macmillan.
Galman, S. C. ( 2013 ). The good, the bad, and the data: Shane the lone ethnographer’s basic guide to qualitative data analysis. Walnut Creek, CA: Left Coast Press.
Geertz, C. ( 1983 ). Local knowledge: Further essays in interpretive anthropology . New York, NY: Basic Books.
Lincoln, Y. S. , & Guba, E. G. ( 1985 ). Naturalistic inquiry . Newbury Park, CA: Sage.
Miles, M. B. , & Huberman, A. M. ( 1994 ). Qualitative data analysis (2nd ed.). Thousand Oaks, CA: Sage.
Saldaña, J. ( 2016 ). The coding manual for qualitative researchers (3rd ed.). London, England: Sage.
Saldaña, J. , & Omasta, M. ( 2018 ). Qualitative research: Analyzing life . Thousand Oaks, CA: Sage.
Stake, R. E. ( 1995 ). The art of case study research . Thousand Oaks, CA: Sage.
Stern, P. N. , & Porr, C. J. ( 2011 ). Essentials of accessible grounded theory . Walnut Creek, CA: Left Coast Press.
Strauss, A. L. ( 1987 ). Qualitative analysis for social scientists . Cambridge, England: Cambridge University Press.
Sunstein, B. S. , & Chiseri-Strater, E. ( 2012 ). FieldWorking: Reading and writing research (4th ed.). Boston, MA: Bedford/St. Martin’s.
Wertz, F. J. , Charmaz, K. , McMullen, L. M. , Josselson, R. , Anderson, R. , & McSpadden, E. ( 2011 ). Five ways of doing qualitative analysis: Phenomenological psychology, grounded theory, discourse analysis, narrative research, and intuitive inquiry . New York, NY: Guilford Press.
- About Oxford Academic
- Publish journals with us
- University press partners
- What we publish
- New features
- Open access
- Institutional account management
- Rights and permissions
- Get help with access
- Accessibility
- Advertising
- Media enquiries
- Oxford University Press
- Oxford Languages
- University of Oxford
Oxford University Press is a department of the University of Oxford. It furthers the University's objective of excellence in research, scholarship, and education by publishing worldwide
- Copyright © 2024 Oxford University Press
- Cookie settings
- Cookie policy
- Privacy policy
- Legal notice
Qualitative Data Analysis
Qualitative data refers to non-numeric information such as interview transcripts, notes, video and audio recordings, images and text documents. Qualitative data analysis can be divided into the following five categories:
1. Content analysis . This refers to the process of categorizing verbal or behavioural data to classify, summarize and tabulate the data.
2. Narrative analysis . This method involves the reformulation of stories presented by respondents taking into account context of each case and different experiences of each respondent. In other words, narrative analysis is the revision of primary qualitative data by researcher.
3. Discourse analysis . A method of analysis of naturally occurring talk and all types of written text.
4. Framework analysis . This is more advanced method that consists of several stages such as familiarization, identifying a thematic framework, coding, charting, mapping and interpretation.
5. Grounded theory . This method of qualitative data analysis starts with an analysis of a single case to formulate a theory. Then, additional cases are examined to see if they contribute to the theory.
Qualitative data analysis can be conducted through the following three steps:
Step 1: Developing and Applying Codes . Coding can be explained as categorization of data. A ‘code’ can be a word or a short phrase that represents a theme or an idea. All codes need to be assigned meaningful titles. A wide range of non-quantifiable elements such as events, behaviours, activities, meanings etc. can be coded.
There are three types of coding:
- Open coding . The initial organization of raw data to try to make sense of it.
- Axial coding . Interconnecting and linking the categories of codes.
- Selective coding . Formulating the story through connecting the categories.
Coding can be done manually or using qualitative data analysis software such as
NVivo, Atlas ti 6.0, HyperRESEARCH 2.8, Max QDA and others.
When using manual coding you can use folders, filing cabinets, wallets etc. to gather together materials that are examples of similar themes or analytic ideas. Manual method of coding in qualitative data analysis is rightly considered as labour-intensive, time-consuming and outdated.
In computer-based coding, on the other hand, physical files and cabinets are replaced with computer based directories and files. When choosing software for qualitative data analysis you need to consider a wide range of factors such as the type and amount of data you need to analyse, time required to master the software and cost considerations.
Moreover, it is important to get confirmation from your dissertation supervisor prior to application of any specific qualitative data analysis software.
The following table contains examples of research titles, elements to be coded and identification of relevant codes:
Qualitative data coding
Step 2: Identifying themes, patterns and relationships . Unlike quantitative methods , in qualitative data analysis there are no universally applicable techniques that can be applied to generate findings. Analytical and critical thinking skills of researcher plays significant role in data analysis in qualitative studies. Therefore, no qualitative study can be repeated to generate the same results.
Nevertheless, there is a set of techniques that you can use to identify common themes, patterns and relationships within responses of sample group members in relation to codes that have been specified in the previous stage.
Specifically, the most popular and effective methods of qualitative data interpretation include the following:
- Word and phrase repetitions – scanning primary data for words and phrases most commonly used by respondents, as well as, words and phrases used with unusual emotions;
- Primary and secondary data comparisons – comparing the findings of interview/focus group/observation/any other qualitative data collection method with the findings of literature review and discussing differences between them;
- Search for missing information – discussions about which aspects of the issue was not mentioned by respondents, although you expected them to be mentioned;
- Metaphors and analogues – comparing primary research findings to phenomena from a different area and discussing similarities and differences.
Step 3: Summarizing the data . At this last stage you need to link research findings to hypotheses or research aim and objectives. When writing data analysis chapter, you can use noteworthy quotations from the transcript in order to highlight major themes within findings and possible contradictions.
It is important to note that the process of qualitative data analysis described above is general and different types of qualitative studies may require slightly different methods of data analysis.
My e-book, The Ultimate Guide to Writing a Dissertation in Business Studies: a step by step approach contains a detailed, yet simple explanation of qualitative data analysis methods . The e-book explains all stages of the research process starting from the selection of the research area to writing personal reflection. Important elements of dissertations such as research philosophy, research approach, research design, methods of data collection and data analysis are explained in simple words. John Dudovskiy


The Ultimate Guide to Qualitative Research - Part 2: Handling Qualitative Data

- Handling qualitative data
- Transcripts
- Field notes
- Survey data and responses
- Visual and audio data
- Data organization
- Data coding
- Coding frame
- Auto and smart coding
- Organizing codes
- Introduction
What is qualitative data analysis?
Qualitative data analysis methods, how do you analyze qualitative data, content analysis, thematic analysis.
- Thematic analysis vs. content analysis
- Narrative research
Phenomenological research
Discourse analysis, grounded theory.
- Deductive reasoning
- Inductive reasoning
- Inductive vs. deductive reasoning
- Qualitative data interpretation
- Qualitative analysis software
Qualitative data analysis
Analyzing qualitative data is the next step after you have completed the use of qualitative data collection methods . The qualitative analysis process aims to identify themes and patterns that emerge across the data.

In simplified terms, qualitative research methods involve non-numerical data collection followed by an explanation based on the attributes of the data . For example, if you are asked to explain in qualitative terms a thermal image displayed in multiple colors, then you would explain the color differences rather than the heat's numerical value. If you have a large amount of data (e.g., of group discussions or observations of real-life situations), the next step is to transcribe and prepare the raw data for subsequent analysis.
Researchers can conduct studies fully based on qualitative methodology, or researchers can preface a quantitative research study with a qualitative study to identify issues that were not originally envisioned but are important to the study. Quantitative researchers may also collect and analyze qualitative data following their quantitative analyses to better understand the meanings behind their statistical results.
Conducting qualitative research can especially help build an understanding of how and why certain outcomes were achieved (in addition to what was achieved). For example, qualitative data analysis is often used for policy and program evaluation research since it can answer certain important questions more efficiently and effectively than quantitative approaches.

Qualitative data analysis can also answer important questions about the relevance, unintended effects, and impact of programs, such as:
- Were expectations reasonable?
- Did processes operate as expected?
- Were key players able to carry out their duties?
- Were there any unintended effects of the program?
The importance of qualitative data analysis
Qualitative approaches have the advantage of allowing for more diversity in responses and the capacity to adapt to new developments or issues during the research process itself. While qualitative analysis of data can be demanding and time-consuming to conduct, many fields of research utilize qualitative software tools that have been specifically developed to provide more succinct, cost-efficient, and timely results.
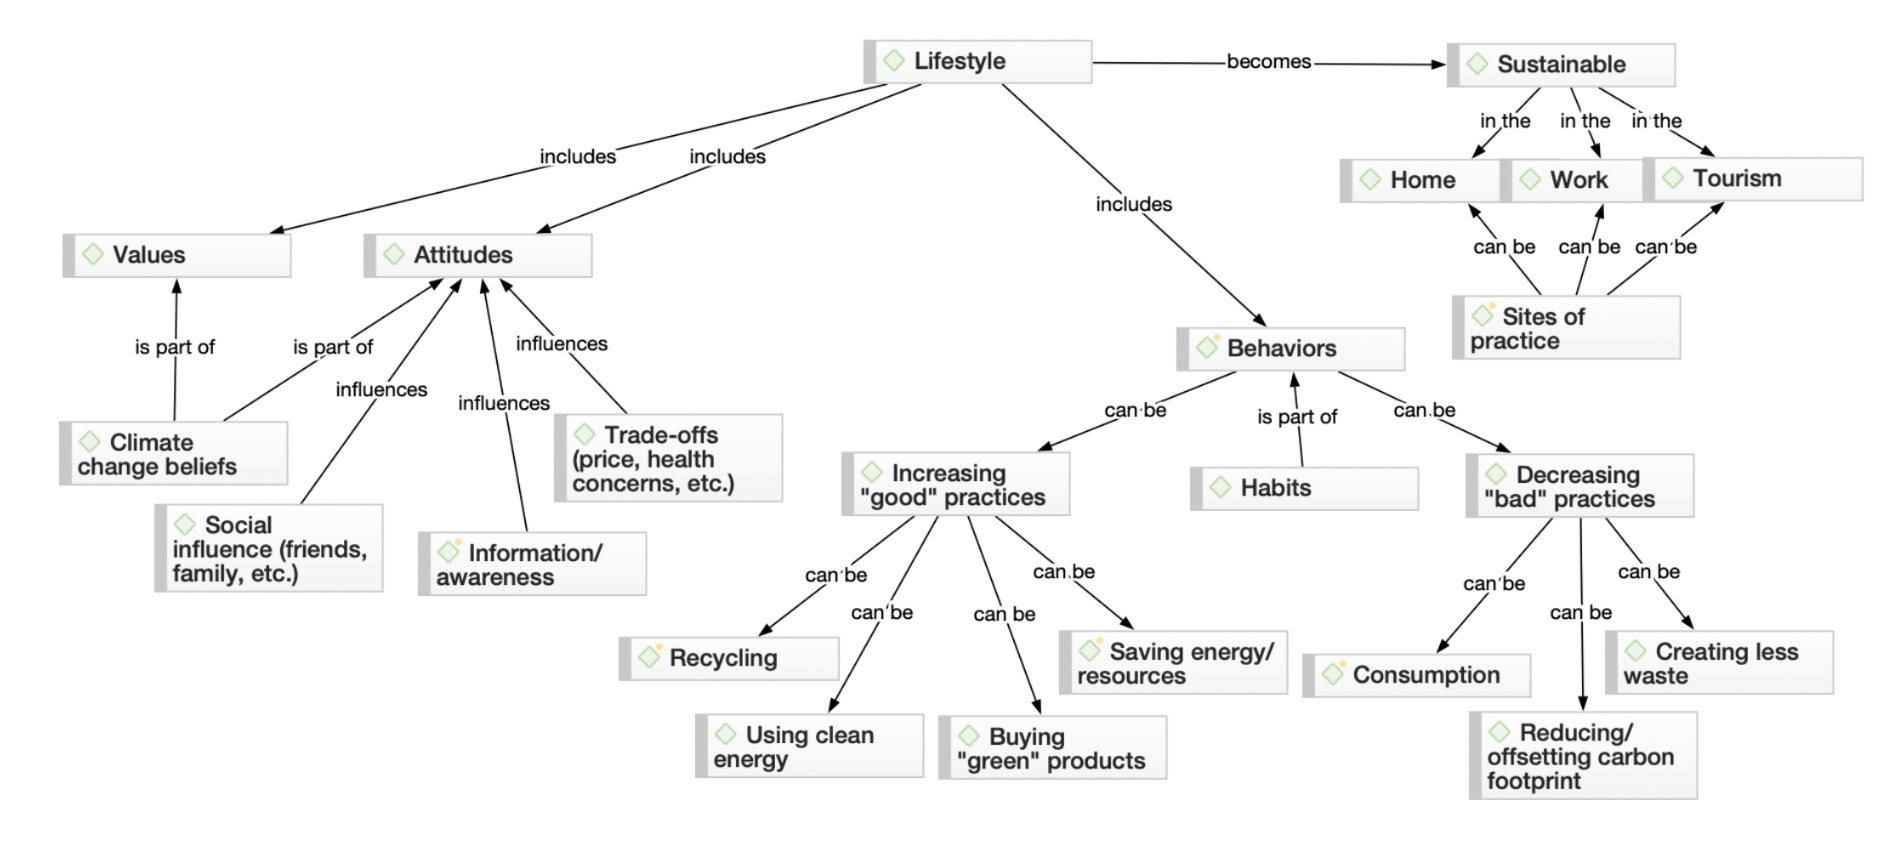
Qualitative data analysis is an important part of research and building greater understanding across fields for a number of reasons. First, cases for qualitative data analysis can be selected purposefully according to whether they typify certain characteristics or contextual locations. In other words, qualitative data permits deep immersion into a topic, phenomenon, or area of interest. Rather than seeking generalizability to the population the sample of participants represent, qualitative research aims to construct an in-depth and nuanced understanding of the research topic.
Secondly, the role or position of the researcher in qualitative analysis of data is given greater critical attention. This is because, in qualitative data analysis, the possibility of the researcher taking a ‘neutral' or transcendent position is seen as more problematic in practical and/or philosophical terms. Hence, qualitative researchers are often exhorted to reflect on their role in the research process and make this clear in the analysis.

Thirdly, while qualitative data analysis can take a wide variety of forms, it largely differs from quantitative research in the focus on language, signs, experiences, and meaning. In addition, qualitative approaches to analysis are often holistic and contextual rather than analyzing the data in a piecemeal fashion or removing the data from its context. Qualitative approaches thus allow researchers to explore inquiries from directions that could not be accessed with only numerical quantitative data.
Establishing research rigor
Systematic and transparent approaches to the analysis of qualitative data are essential for rigor . For example, many qualitative research methods require researchers to carefully code data and discern and document themes in a consistent and credible way.
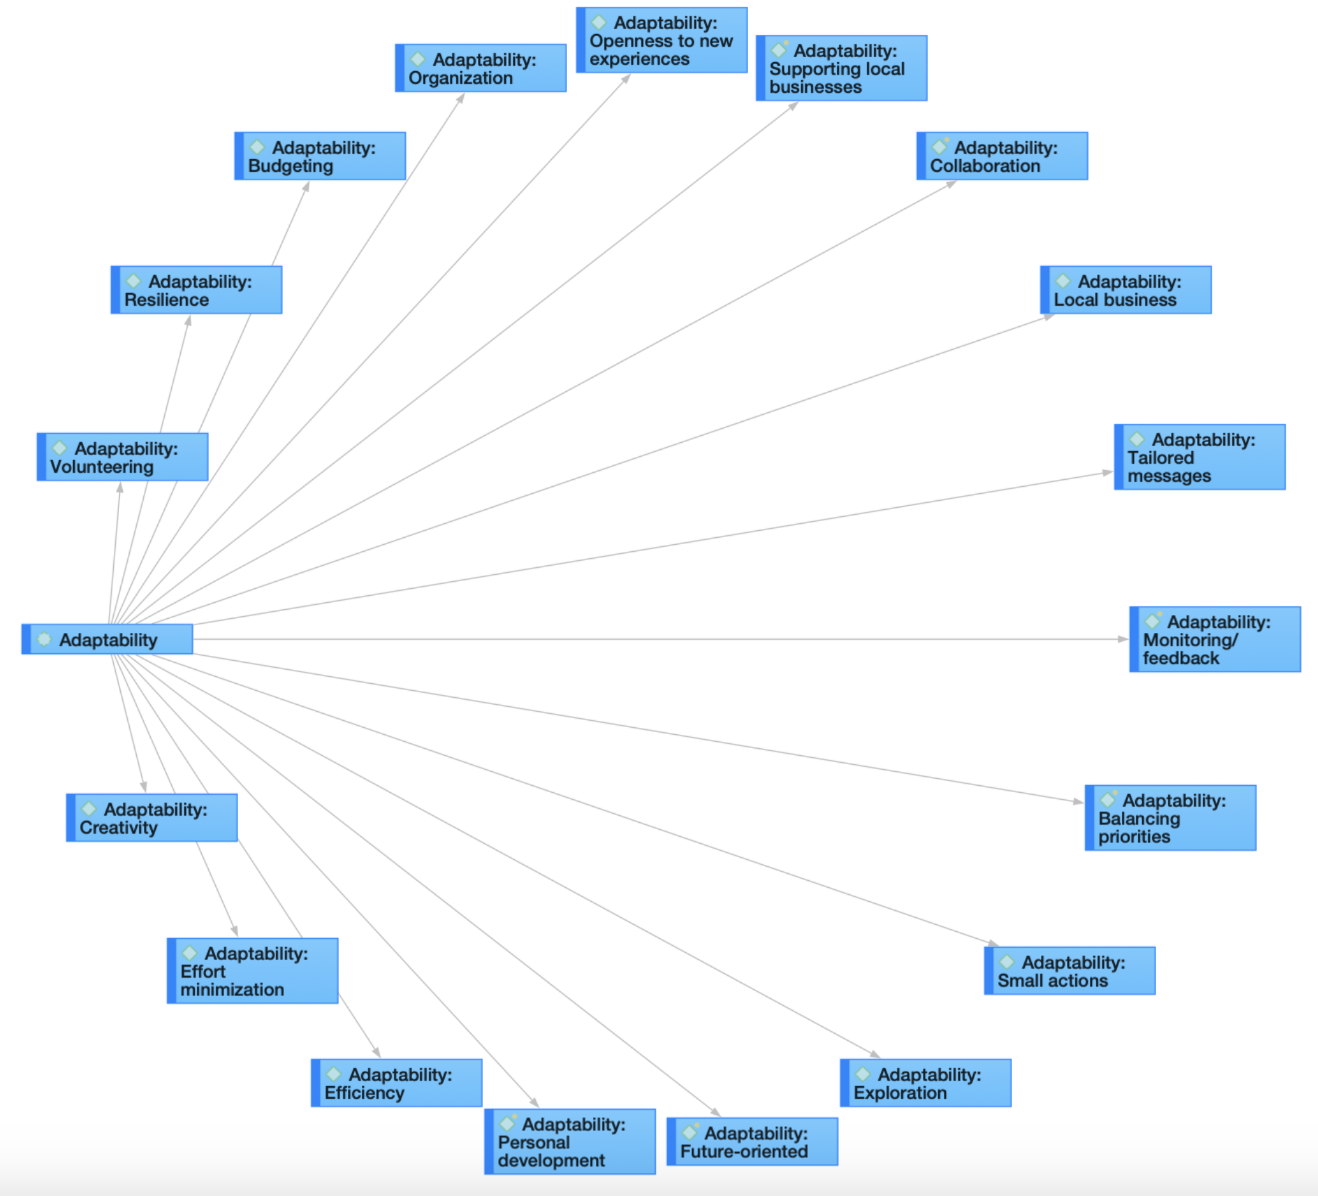
Perhaps the most traditional division in the way qualitative and quantitative research have been used in the social sciences is for qualitative methods to be used for exploratory purposes (e.g., to generate new theory or propositions) or to explain puzzling quantitative results, while quantitative methods are used to test hypotheses .

After you’ve collected relevant data , what is the best way to look at your data ? As always, it will depend on your research question . For instance, if you employed an observational research method to learn about a group’s shared practices, an ethnographic approach could be appropriate to explain the various dimensions of culture. If you collected textual data to understand how people talk about something, then a discourse analysis approach might help you generate key insights about language and communication.

The qualitative data coding process involves iterative categorization and recategorization, ensuring the evolution of the analysis to best represent the data. The procedure typically concludes with the interpretation of patterns and trends identified through the coding process.
To start off, let’s look at two broad approaches to data analysis.
Deductive analysis
Deductive analysis is guided by pre-existing theories or ideas. It starts with a theoretical framework , which is then used to code the data. The researcher can thus use this theoretical framework to interpret their data and answer their research question .
The key steps include coding the data based on the predetermined concepts or categories and using the theory to guide the interpretation of patterns among the codings. Deductive analysis is particularly useful when researchers aim to verify or extend an existing theory within a new context.
Inductive analysis
Inductive analysis involves the generation of new theories or ideas based on the data. The process starts without any preconceived theories or codes, and patterns, themes, and categories emerge out of the data.

The researcher codes the data to capture any concepts or patterns that seem interesting or important to the research question . These codes are then compared and linked, leading to the formation of broader categories or themes. The main goal of inductive analysis is to allow the data to 'speak for itself' rather than imposing pre-existing expectations or ideas onto the data.
Deductive and inductive approaches can be seen as sitting on opposite poles, and all research falls somewhere within that spectrum. Most often, qualitative analysis approaches blend both deductive and inductive elements to contribute to the existing conversation around a topic while remaining open to potential unexpected findings. To help you make informed decisions about which qualitative data analysis approach fits with your research objectives, let's look at some of the common approaches for qualitative data analysis.
Content analysis is a research method used to identify patterns and themes within qualitative data. This approach involves systematically coding and categorizing specific aspects of the content in the data to uncover trends and patterns. An often important part of content analysis is quantifying frequencies and patterns of words or characteristics present in the data .
It is a highly flexible technique that can be adapted to various data types , including text, images, and audiovisual content . While content analysis can be exploratory in nature, it is also common to use pre-established theories and follow a more deductive approach to categorizing and quantifying the qualitative data.
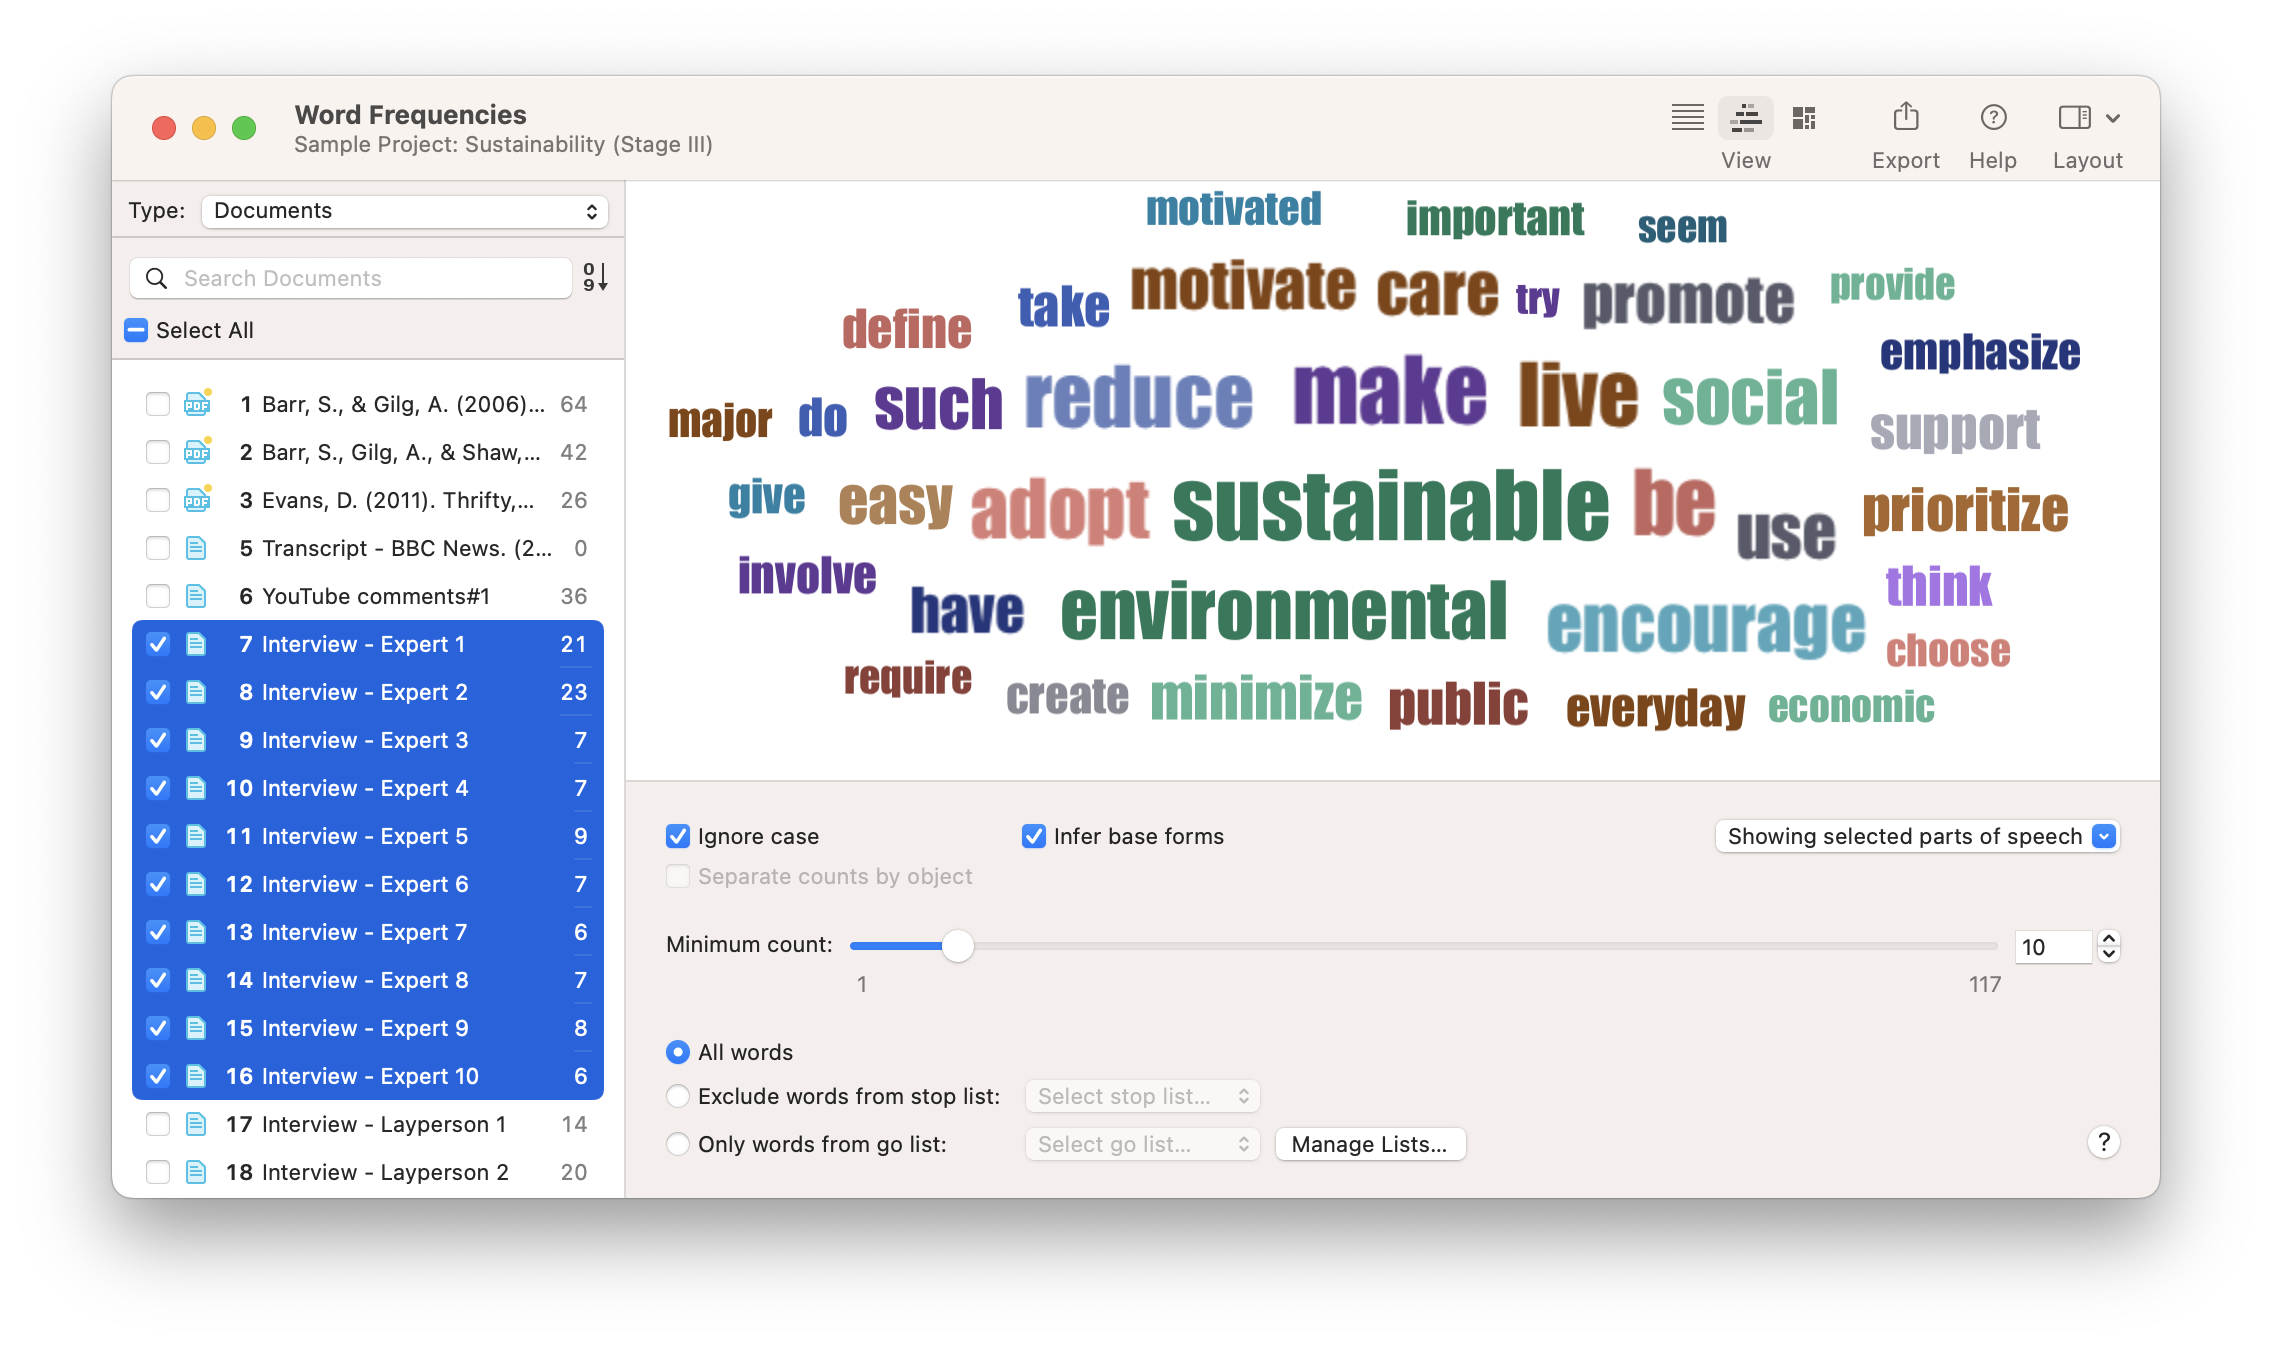
Thematic analysis is a method used to identify, analyze, and report patterns or themes within the data. This approach moves beyond counting explicit words or phrases and focuses on also identifying implicit concepts and themes within the data.

Researchers conduct detailed coding of the data to ascertain repeated themes or patterns of meaning. Codes can be categorized into themes, and the researcher can analyze how the themes relate to one another. Thematic analysis is flexible in terms of the research framework, allowing for both inductive (data-driven) and deductive (theory-driven) approaches. The outcome is a rich, detailed, and complex account of the data.
Grounded theory is a systematic qualitative research methodology that is used to inductively generate theory that is 'grounded' in the data itself. Analysis takes place simultaneously with data collection , and researchers iterate between data collection and analysis until a comprehensive theory is developed.
Grounded theory is characterized by simultaneous data collection and analysis, the development of theoretical codes from the data, purposeful sampling of participants, and the constant comparison of data with emerging categories and concepts. The ultimate goal is to create a theoretical explanation that fits the data and answers the research question .
Discourse analysis is a qualitative research approach that emphasizes the role of language in social contexts. It involves examining communication and language use beyond the level of the sentence, considering larger units of language such as texts or conversations.

Discourse analysts typically investigate how social meanings and understandings are constructed in different contexts, emphasizing the connection between language and power. It can be applied to texts of all kinds, including interviews , documents, case studies , and social media posts.
Phenomenological research focuses on exploring how human beings make sense of an experience and delves into the essence of this experience. It strives to understand people's perceptions, perspectives, and understandings of a particular situation or phenomenon.

It involves in-depth engagement with participants, often through interviews or conversations, to explore their lived experiences. The goal is to derive detailed descriptions of the essence of the experience and to interpret what insights or implications this may bear on our understanding of this phenomenon.

Whatever your data analysis approach, start with ATLAS.ti
Qualitative data analysis done quickly and intuitively with ATLAS.ti. Download a free trial today.
Now that we've summarized the major approaches to data analysis, let's look at the broader process of research and data analysis. Suppose you need to do some research to find answers to any kind of research question, be it an academic inquiry, business problem, or policy decision. In that case, you need to collect some data. There are many methods of collecting data: you can collect primary data yourself by conducting interviews, focus groups , or a survey , for instance. Another option is to use secondary data sources. These are data previously collected for other projects, historical records, reports, statistics – basically everything that exists already and can be relevant to your research.

The data you collect should always be a good fit for your research question . For example, if you are interested in how many people in your target population like your brand compared to others, it is no use to conduct interviews or a few focus groups . The sample will be too small to get a representative picture of the population. If your questions are about "how many….", "what is the spread…" etc., you need to conduct quantitative research . If you are interested in why people like different brands, their motives, and their experiences, then conducting qualitative research can provide you with the answers you are looking for.
Let's describe the important steps involved in conducting research.
Step 1: Planning the research
As the saying goes: "Garbage in, garbage out." Suppose you find out after you have collected data that
- you talked to the wrong people
- asked the wrong questions
- a couple of focus groups sessions would have yielded better results because of the group interaction, or
- a survey including a few open-ended questions sent to a larger group of people would have been sufficient and required less effort.
Think thoroughly about sampling, the questions you will be asking, and in which form. If you conduct a focus group or an interview, you are the research instrument, and your data collection will only be as good as you are. If you have never done it before, seek some training and practice. If you have other people do it, make sure they have the skills.
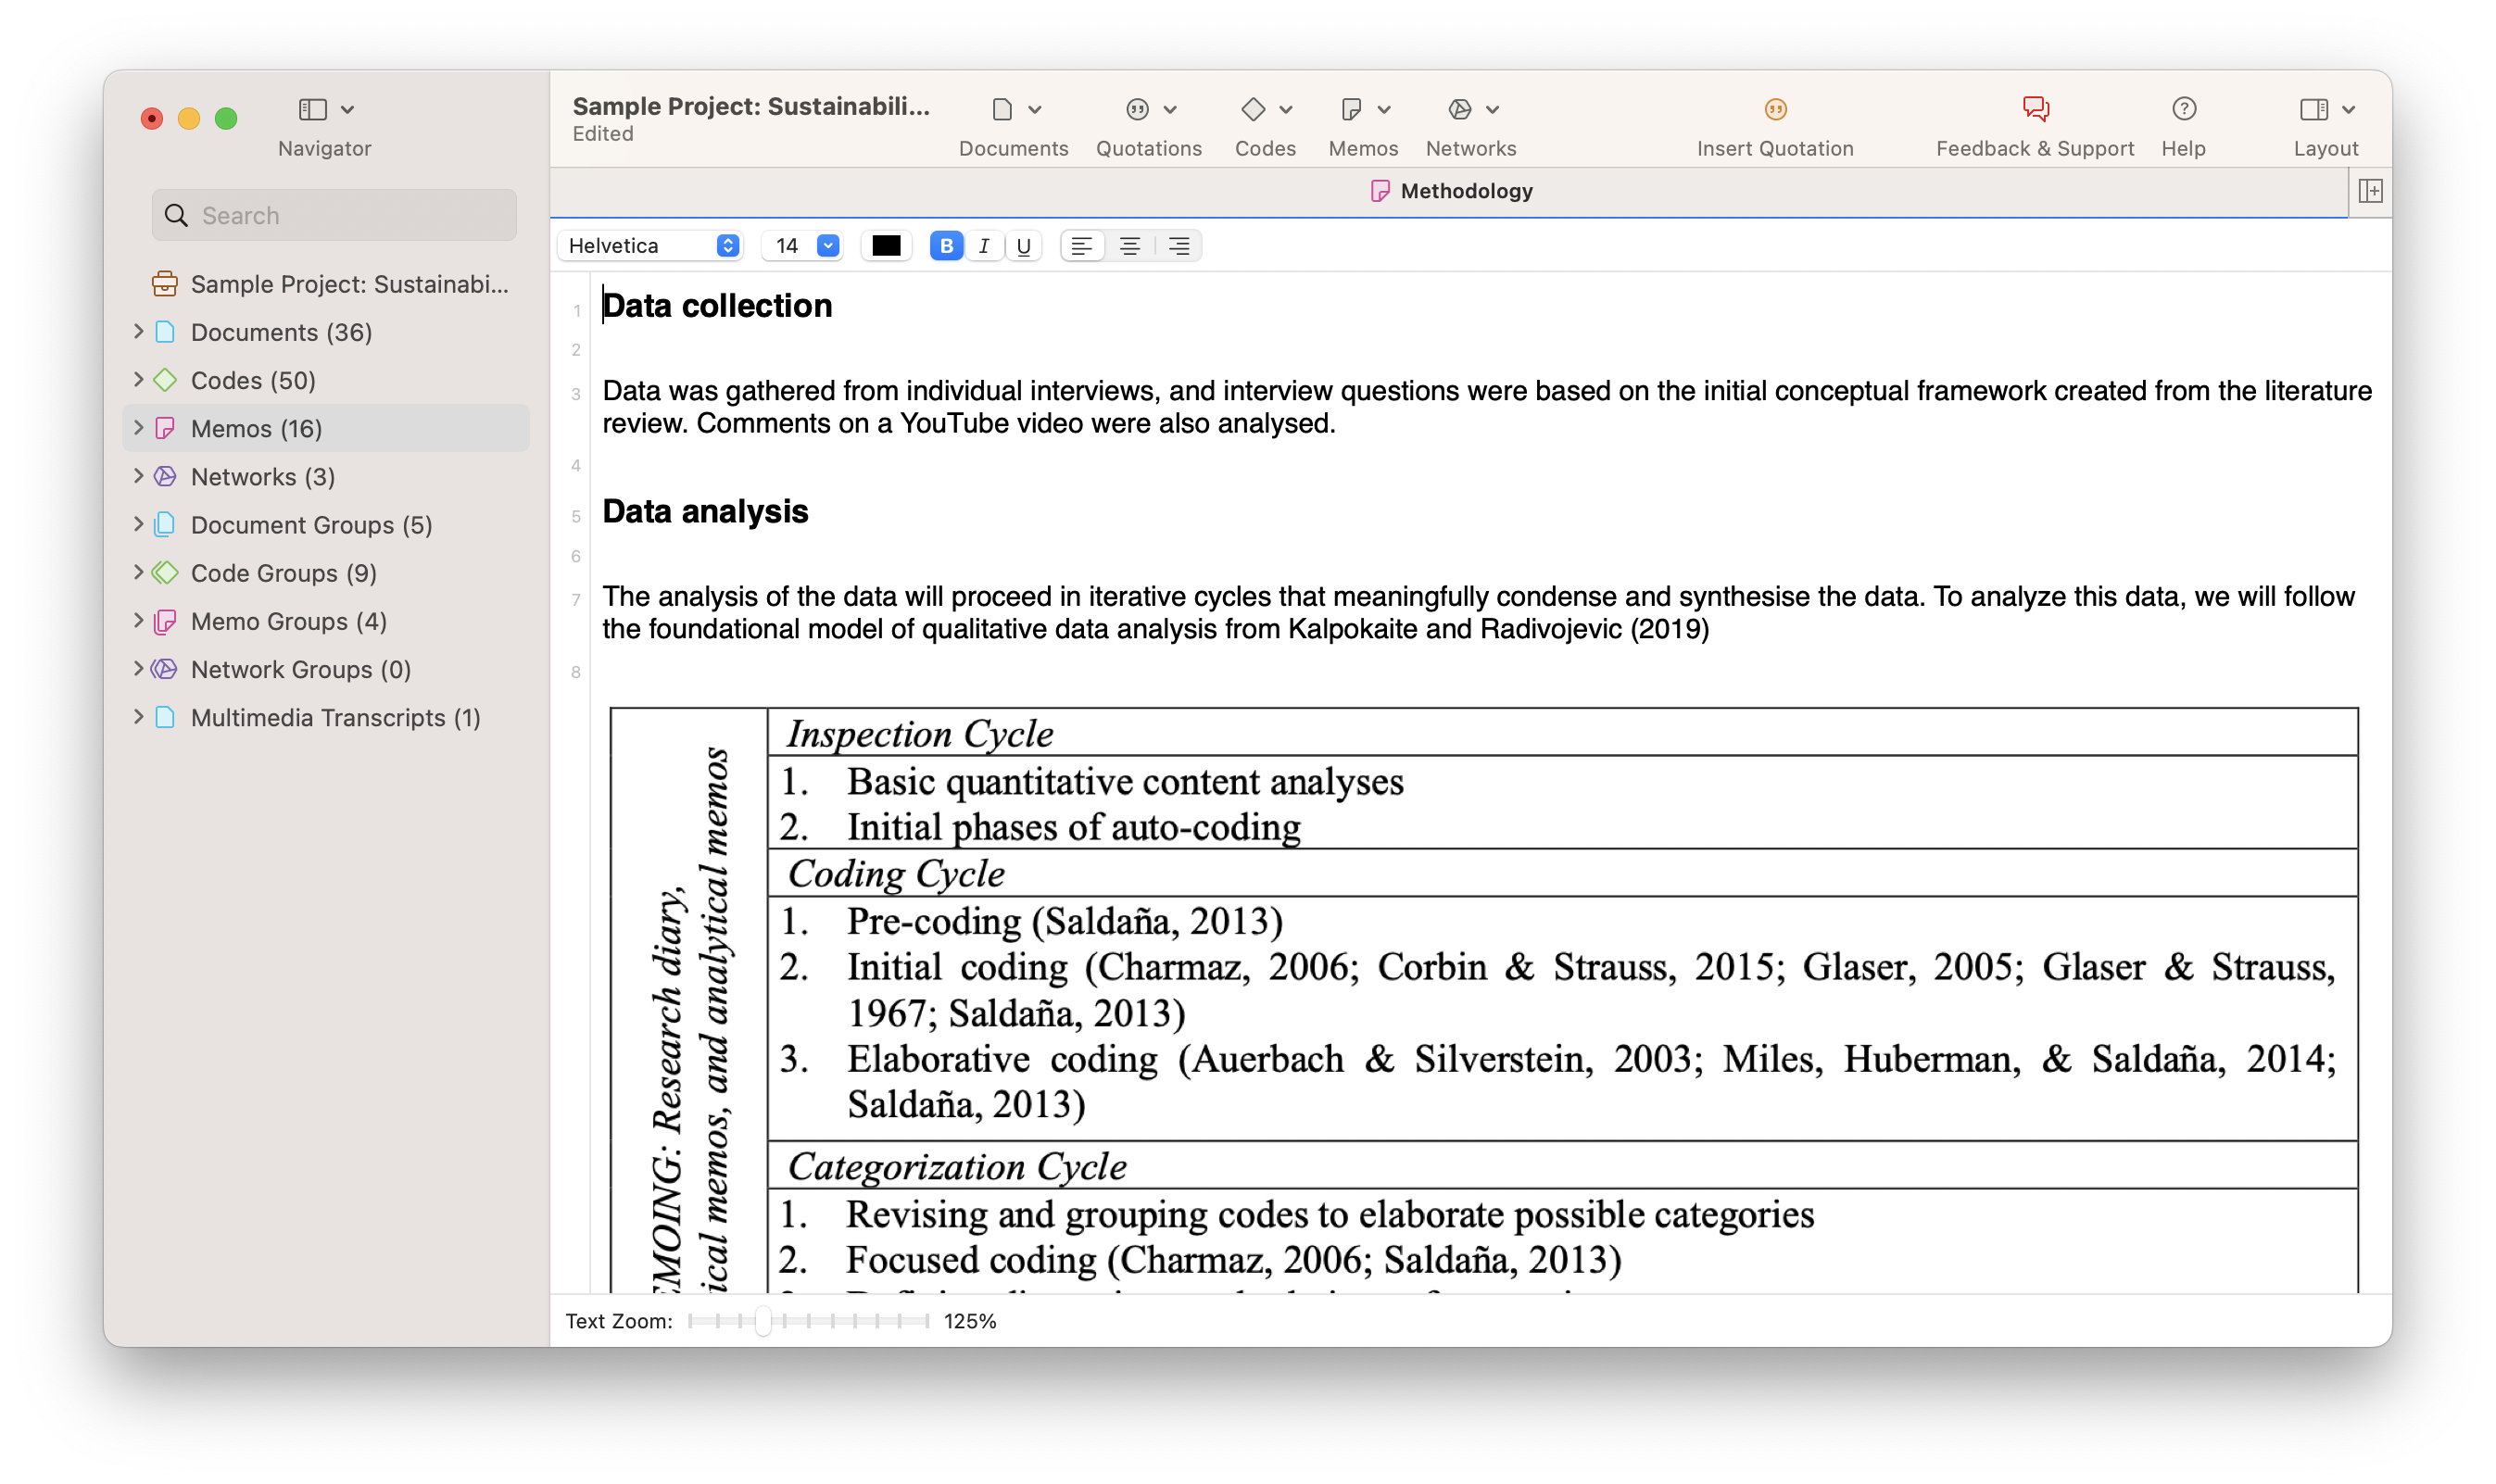
Step 2: Preparing the data
When you conduct focus groups or interviews, think about how to transcribe them. Do you want to run them online or offline? If online, check out which tools can serve your needs, both in terms of functionality and cost. For any audio or video recordings , you can consider using automatic transcription software or services. Automatically generated transcripts can save you time and money, but they still need to be checked. If you don't do this yourself, make sure that you instruct the person doing it on how to prepare the data.
- How should the final transcript be formatted for later analysis?
- Which names and locations should be anonymized?
- What kind of speaker IDs to use?
What about survey data ? Some survey data programs will immediately provide basic descriptive-level analysis of the responses. ATLAS.ti will support you with the analysis of the open-ended questions. For this, you need to export your data as an Excel file. ATLAS.ti's survey import wizard will guide you through the process.
Other kinds of data such as images, videos, audio recordings, text, and more can be imported to ATLAS.ti. You can organize all your data into groups and write comments on each source of data to maintain a systematic organization and documentation of your data.

Step 3: Exploratory data analysis
You can run a few simple exploratory analyses to get to know your data. For instance, you can create a word list or word cloud of all your text data or compare and contrast the words in different documents. You can also let ATLAS.ti find relevant concepts for you. There are many tools available that can automatically code your text data, so you can also use these codings to explore your data and refine your coding.
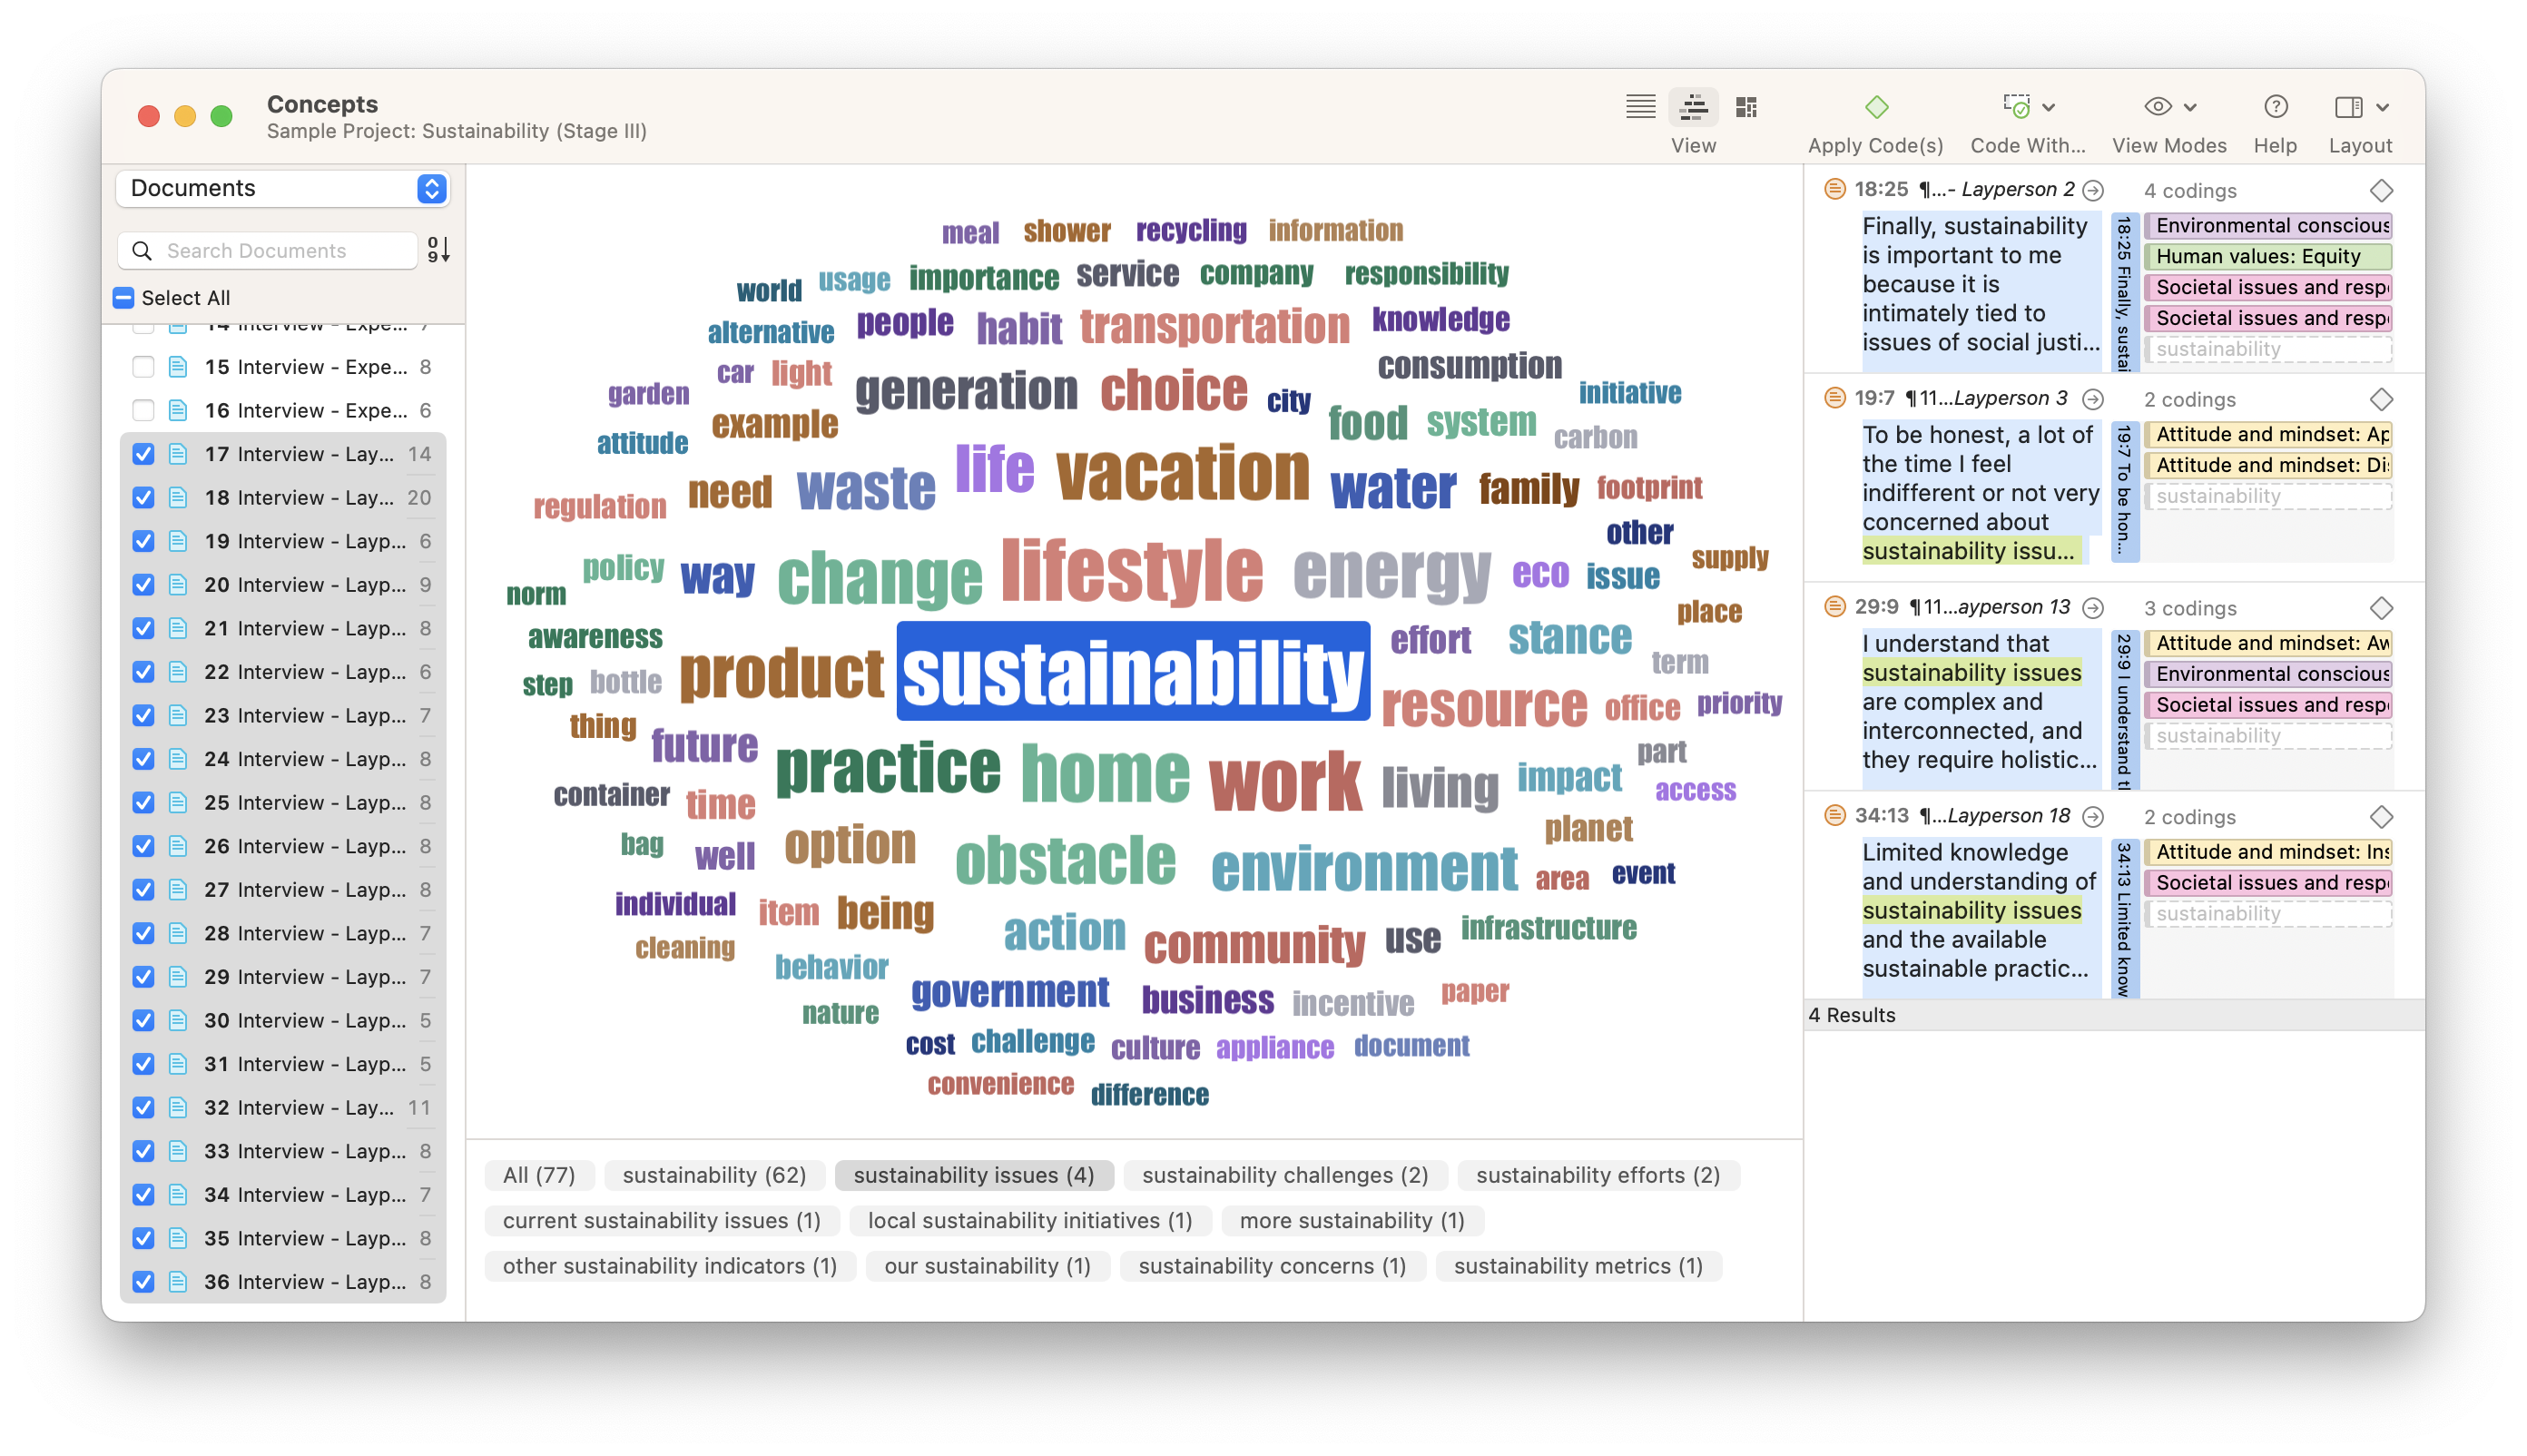
For instance, you can get a feeling for the sentiments expressed in the data. Who is more optimistic, pessimistic, or neutral in their responses? ATLAS.ti can auto-code the positive, negative, and neutral sentiments in your data. Naturally, you can also simply browse through your data and highlight relevant segments that catch your attention or attach codes to begin condensing the data.
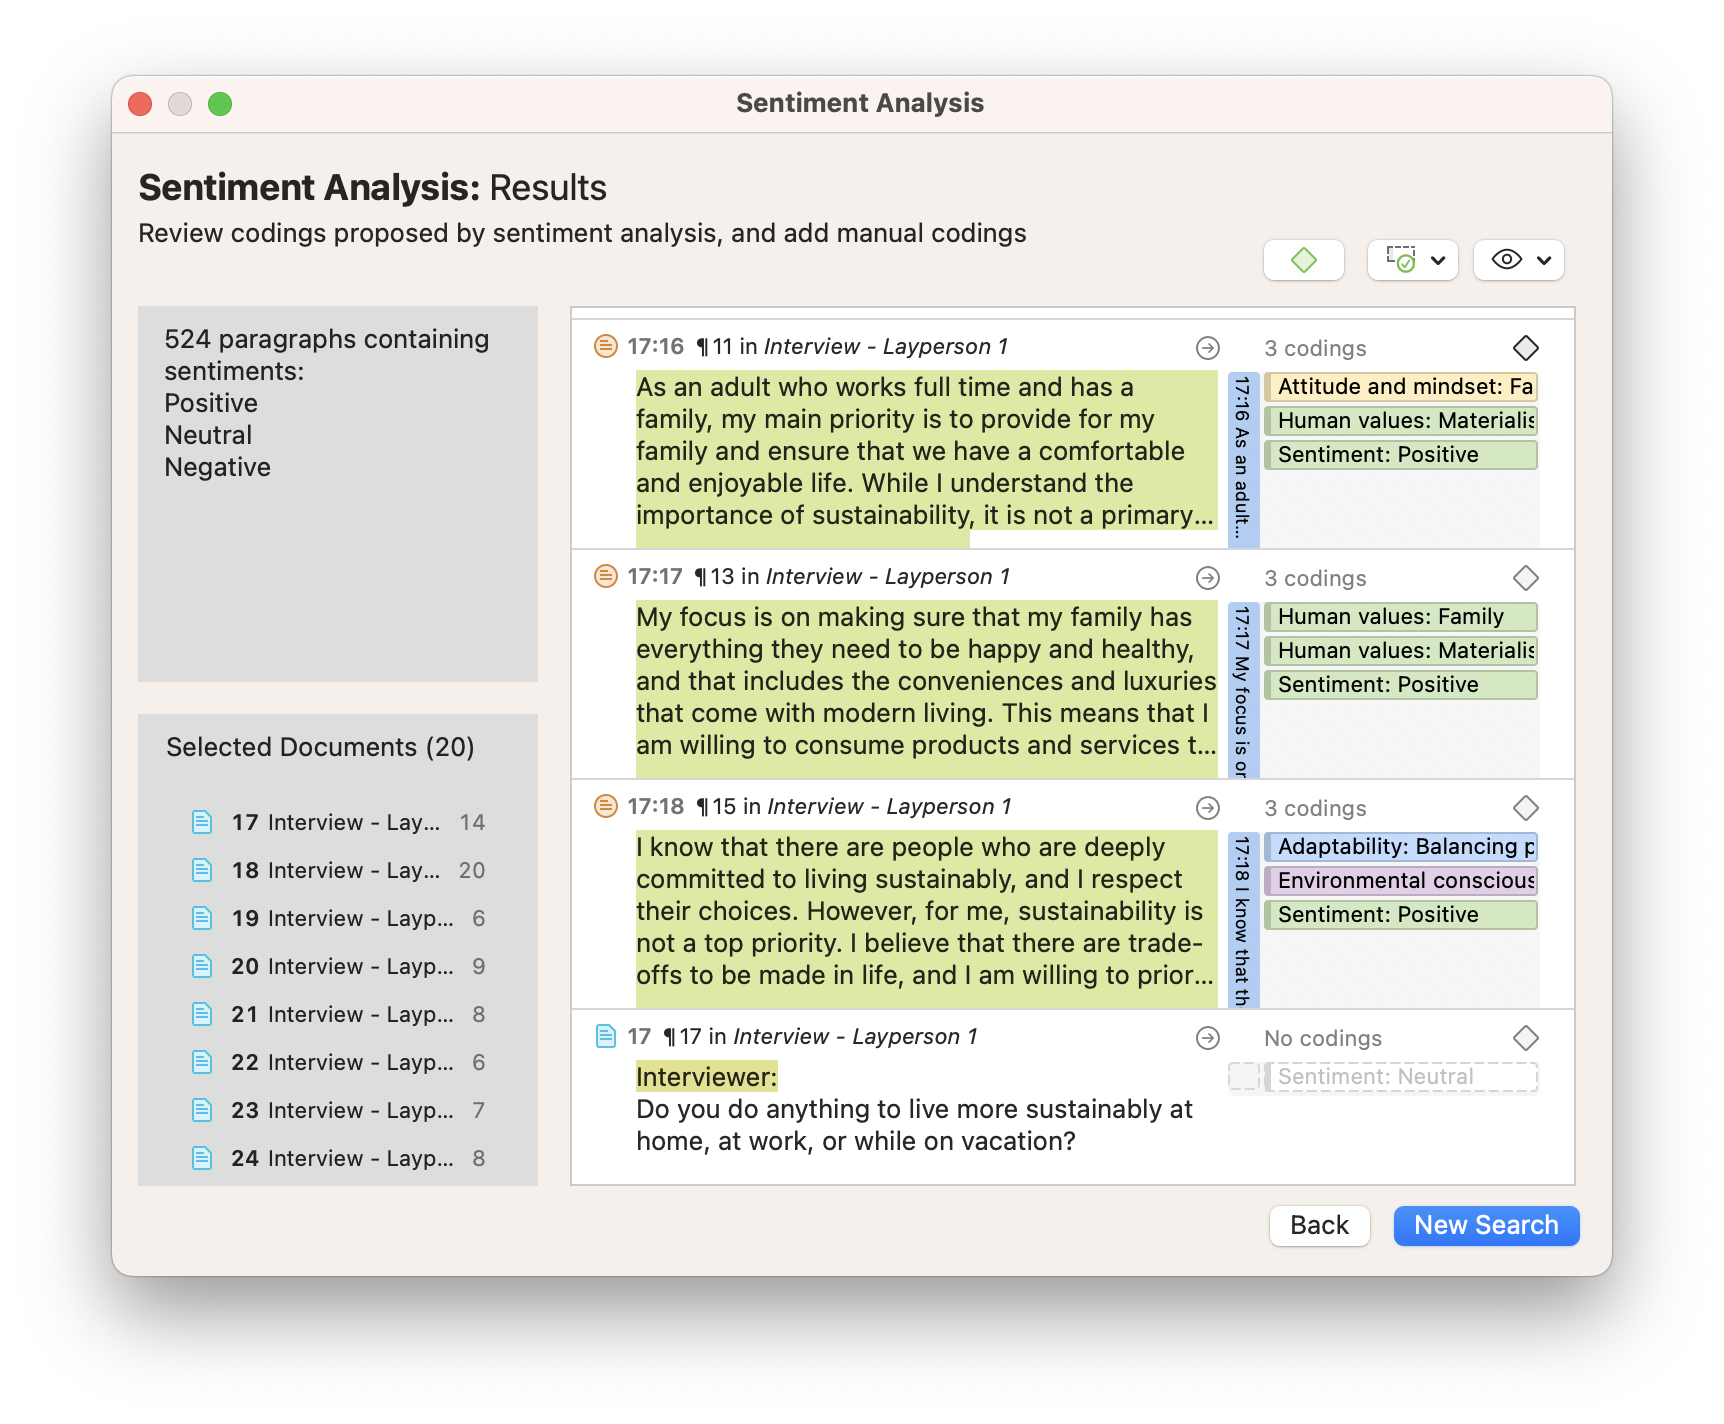
Step 4: Build a code system
Whether you start with auto-coding or manual coding, after having generated some first codes, you need to get some order in your code system to develop a cohesive understanding. You can build your code system by sorting codes into groups and creating categories and subcodes. As this process requires reading and re-reading your data, you will become very familiar with your data. Counting on a tool like ATLAS.ti qualitative data analysis software will support you in the process and make it easier to review your data, modify codings if necessary, change code labels, and write operational definitions to explain what each code means.
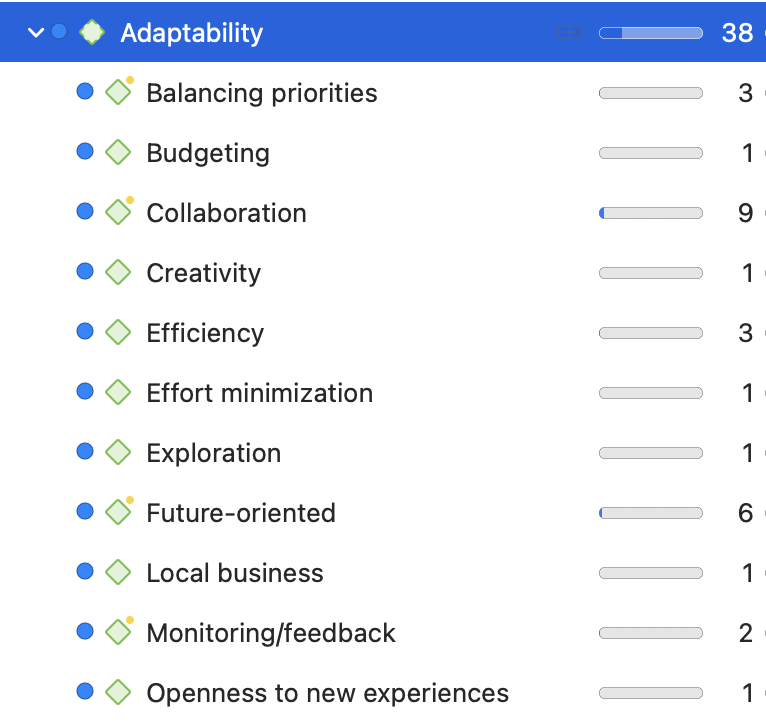
Step 5: Query your coded data and write up the analysis
Once you have coded your data, it is time to take the analysis a step further. When using software for qualitative data analysis , it is easy to compare and contrast subsets in your data, such as groups of participants or sets of themes.
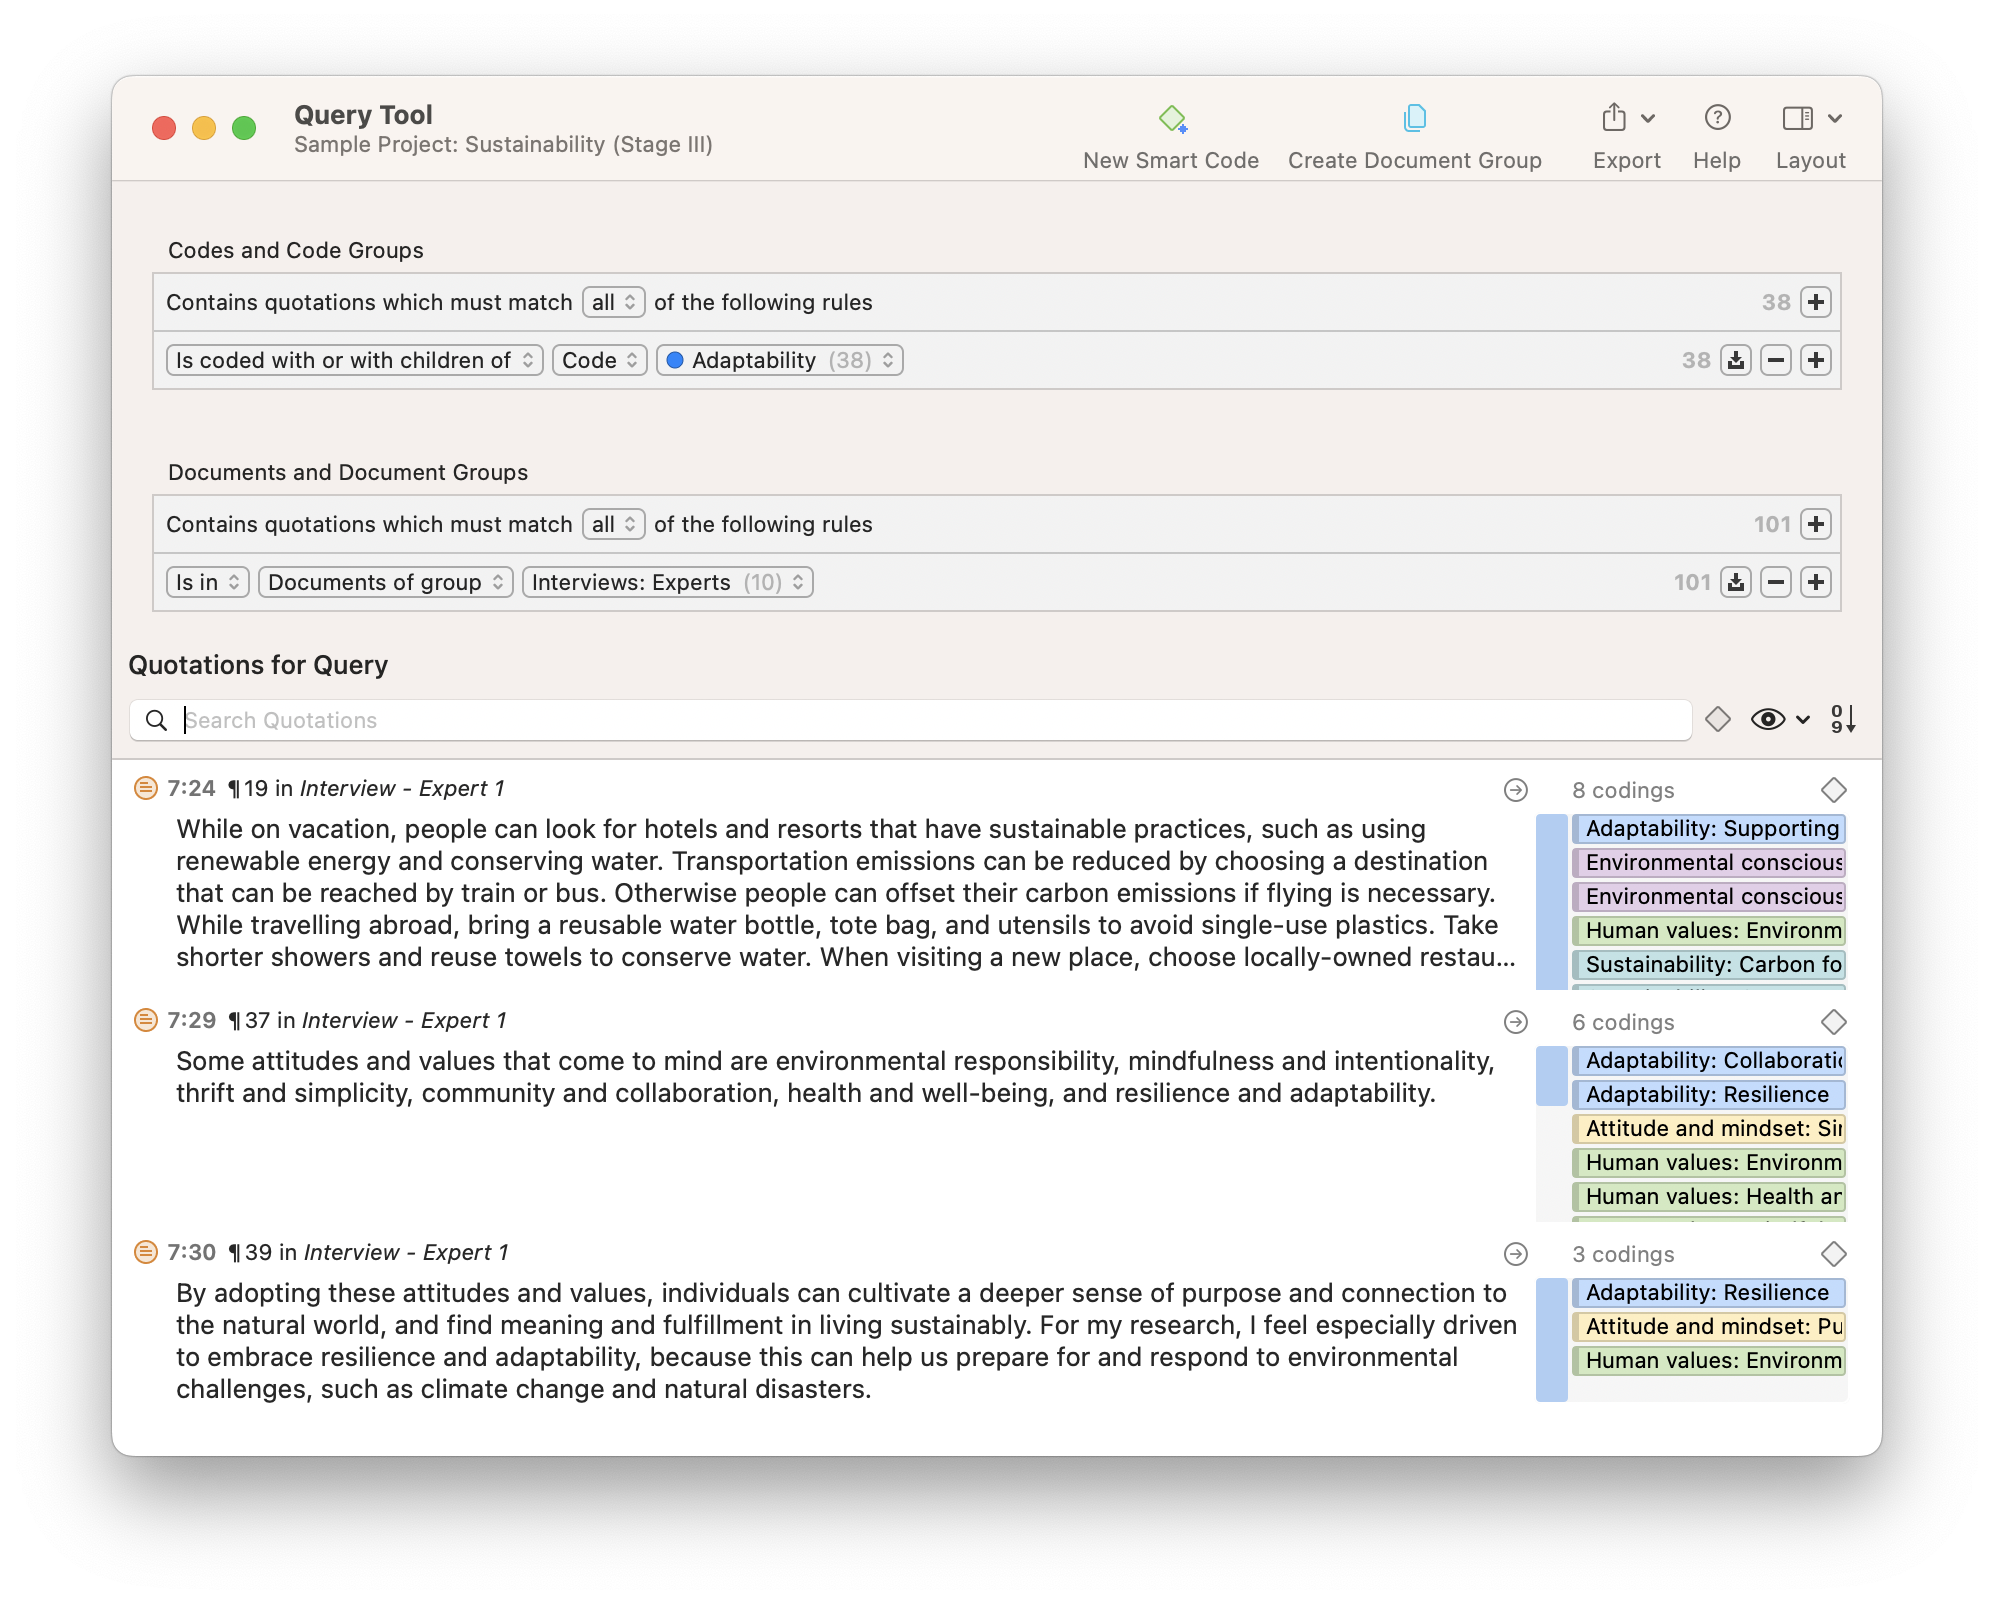
For instance, you can query the various opinions of female vs. male respondents. Is there a difference between consumers from rural or urban areas or among different age groups or educational levels? Which codes occur together throughout the data set? Are there relationships between various concepts, and if so, why?
Step 6: Data visualization
Data visualization brings your data to life. It is a powerful way of seeing patterns and relationships in your data. For instance, diagrams allow you to see how your codes are distributed across documents or specific subpopulations in your data.
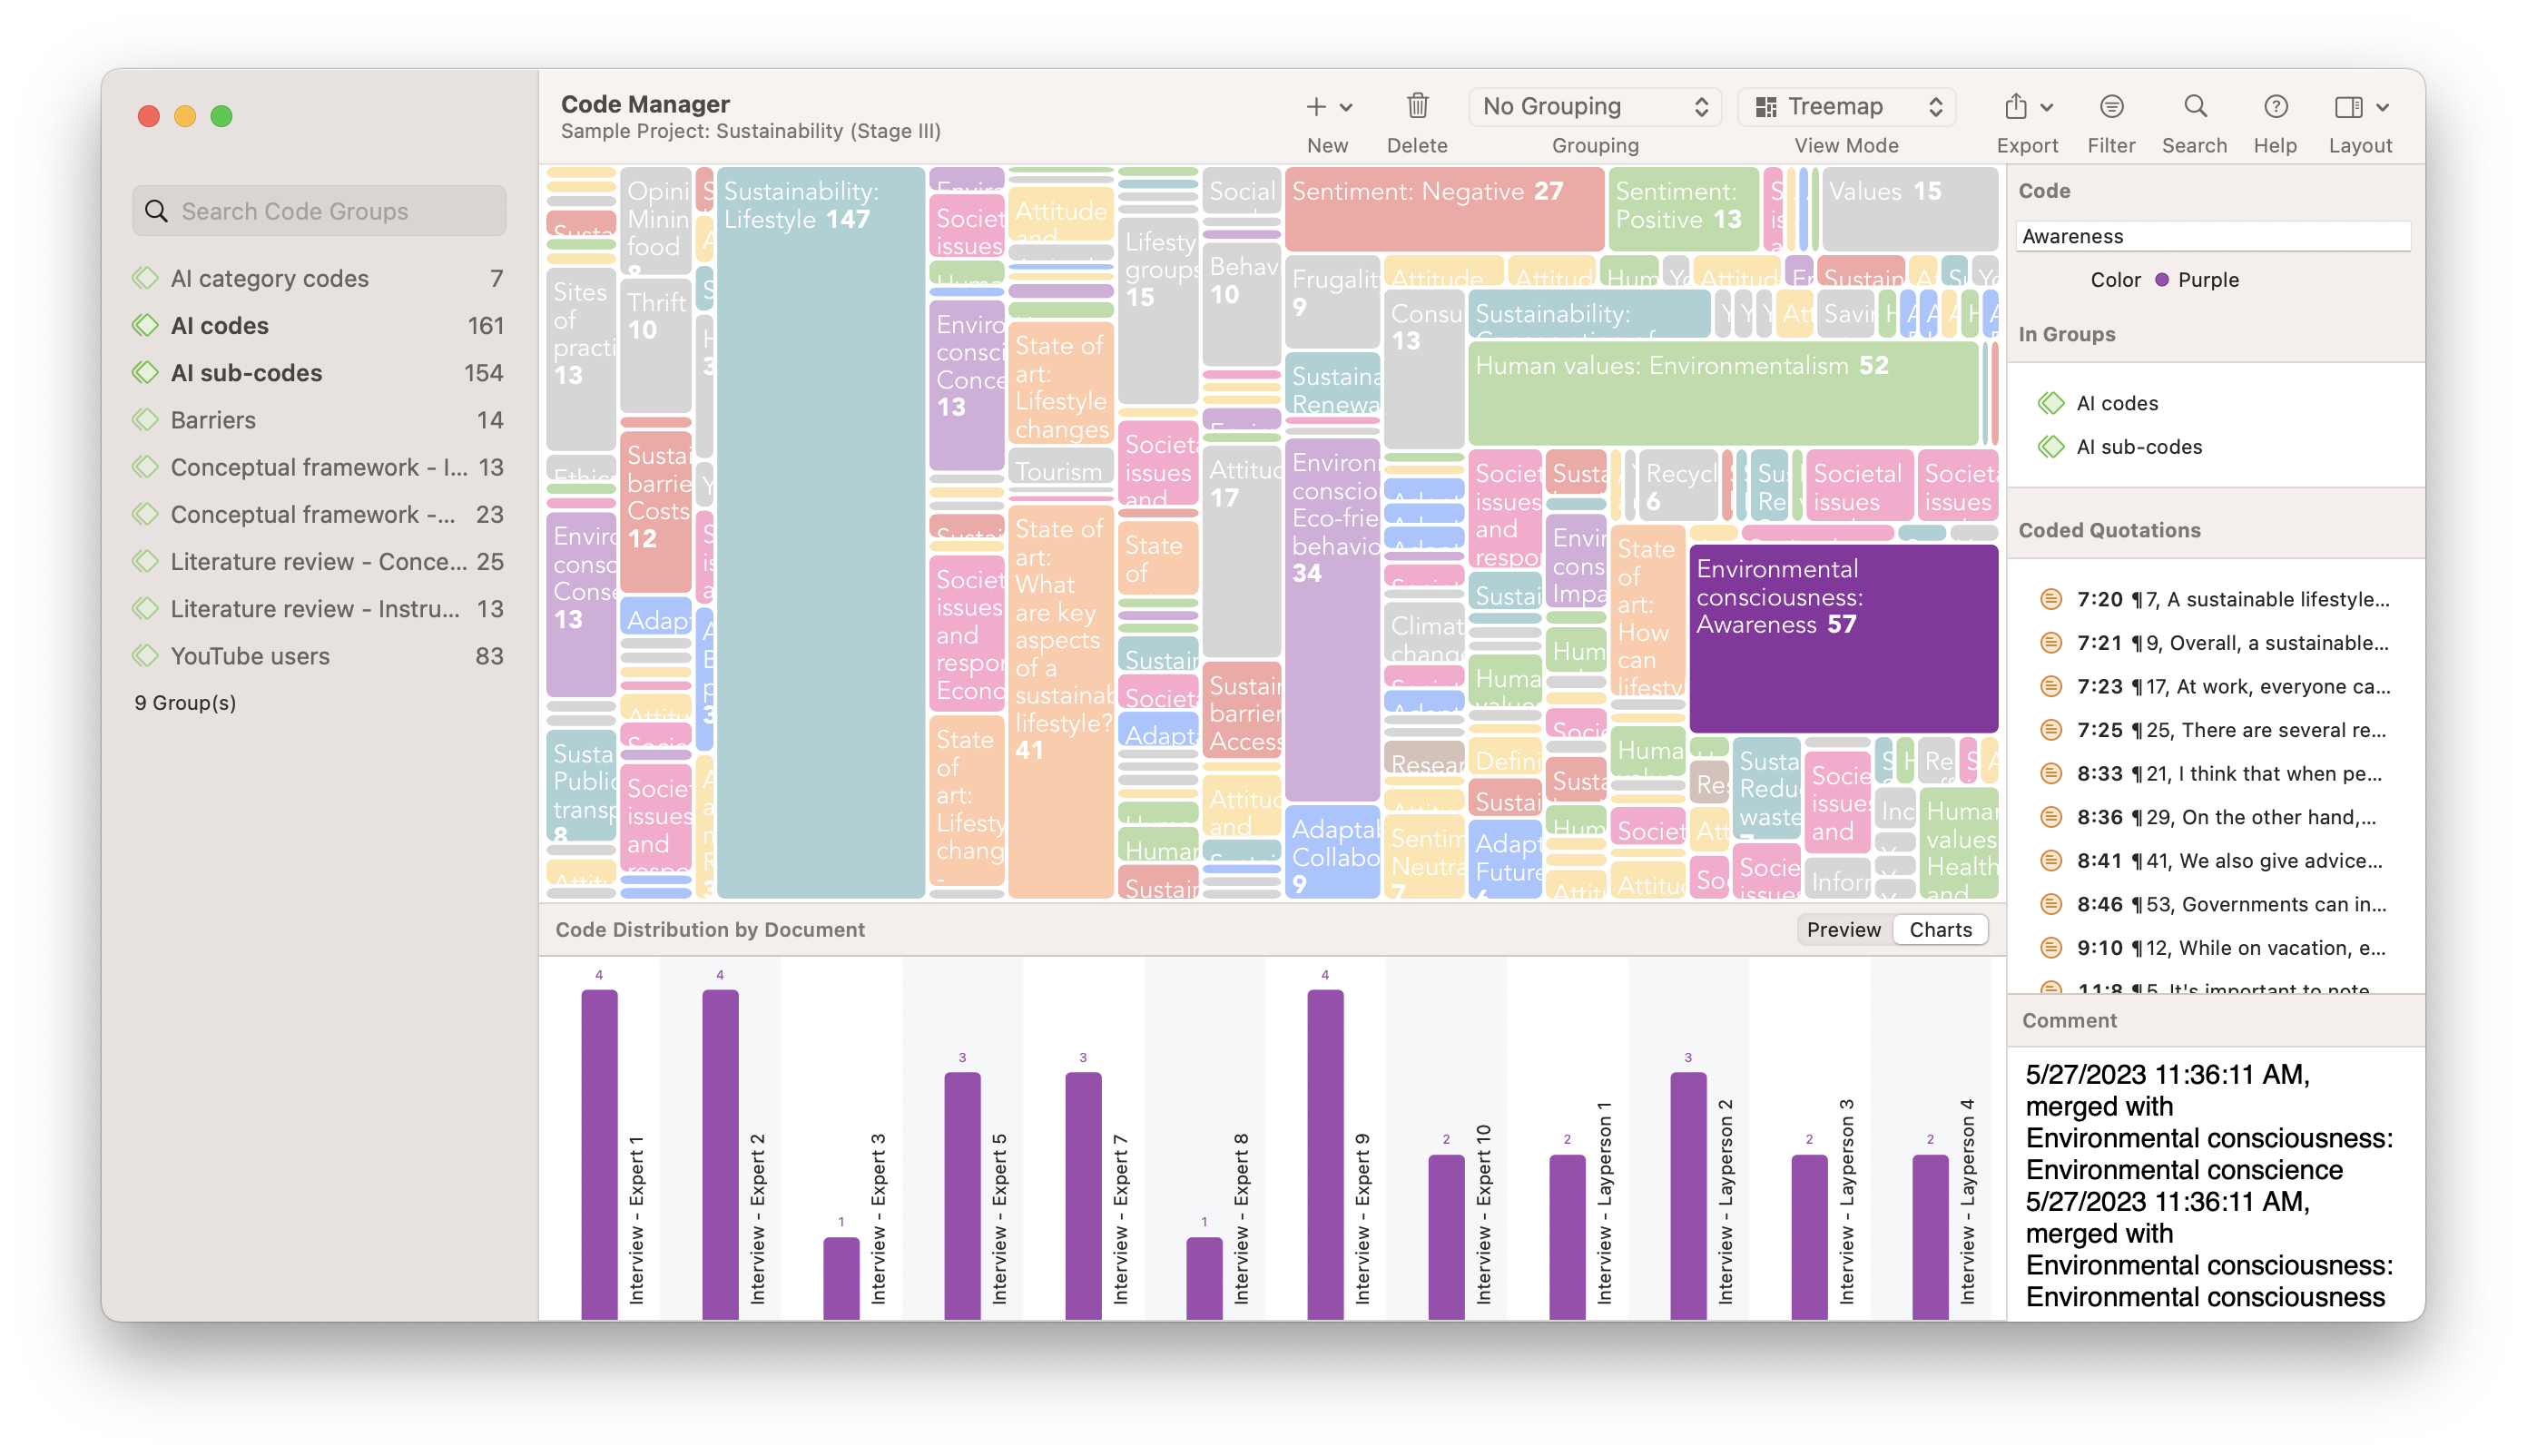
Exploring coded data on a canvas, moving around code labels in a virtual space, linking codes and other elements of your data set, and thinking about how they are related and why – all of these will advance your analysis and spur further insights. Visuals are also great for communicating results to others.
Step 7: Data presentation
The final step is to summarize the analysis in a written report . You can now put together the memos you have written about the various topics, select some salient quotes that illustrate your writing, and add visuals such as tables and diagrams. If you follow the steps above, you will already have all the building blocks, and you just have to put them together in a report or presentation.
When preparing a report or a presentation, keep your audience in mind. Does your audience better understand numbers than long sections of detailed interpretations? If so, add more tables, charts, and short supportive data quotes to your report or presentation. If your audience loves a good interpretation, add your full-length memos and walk your audience through your conceptual networks and illustrative data quotes.
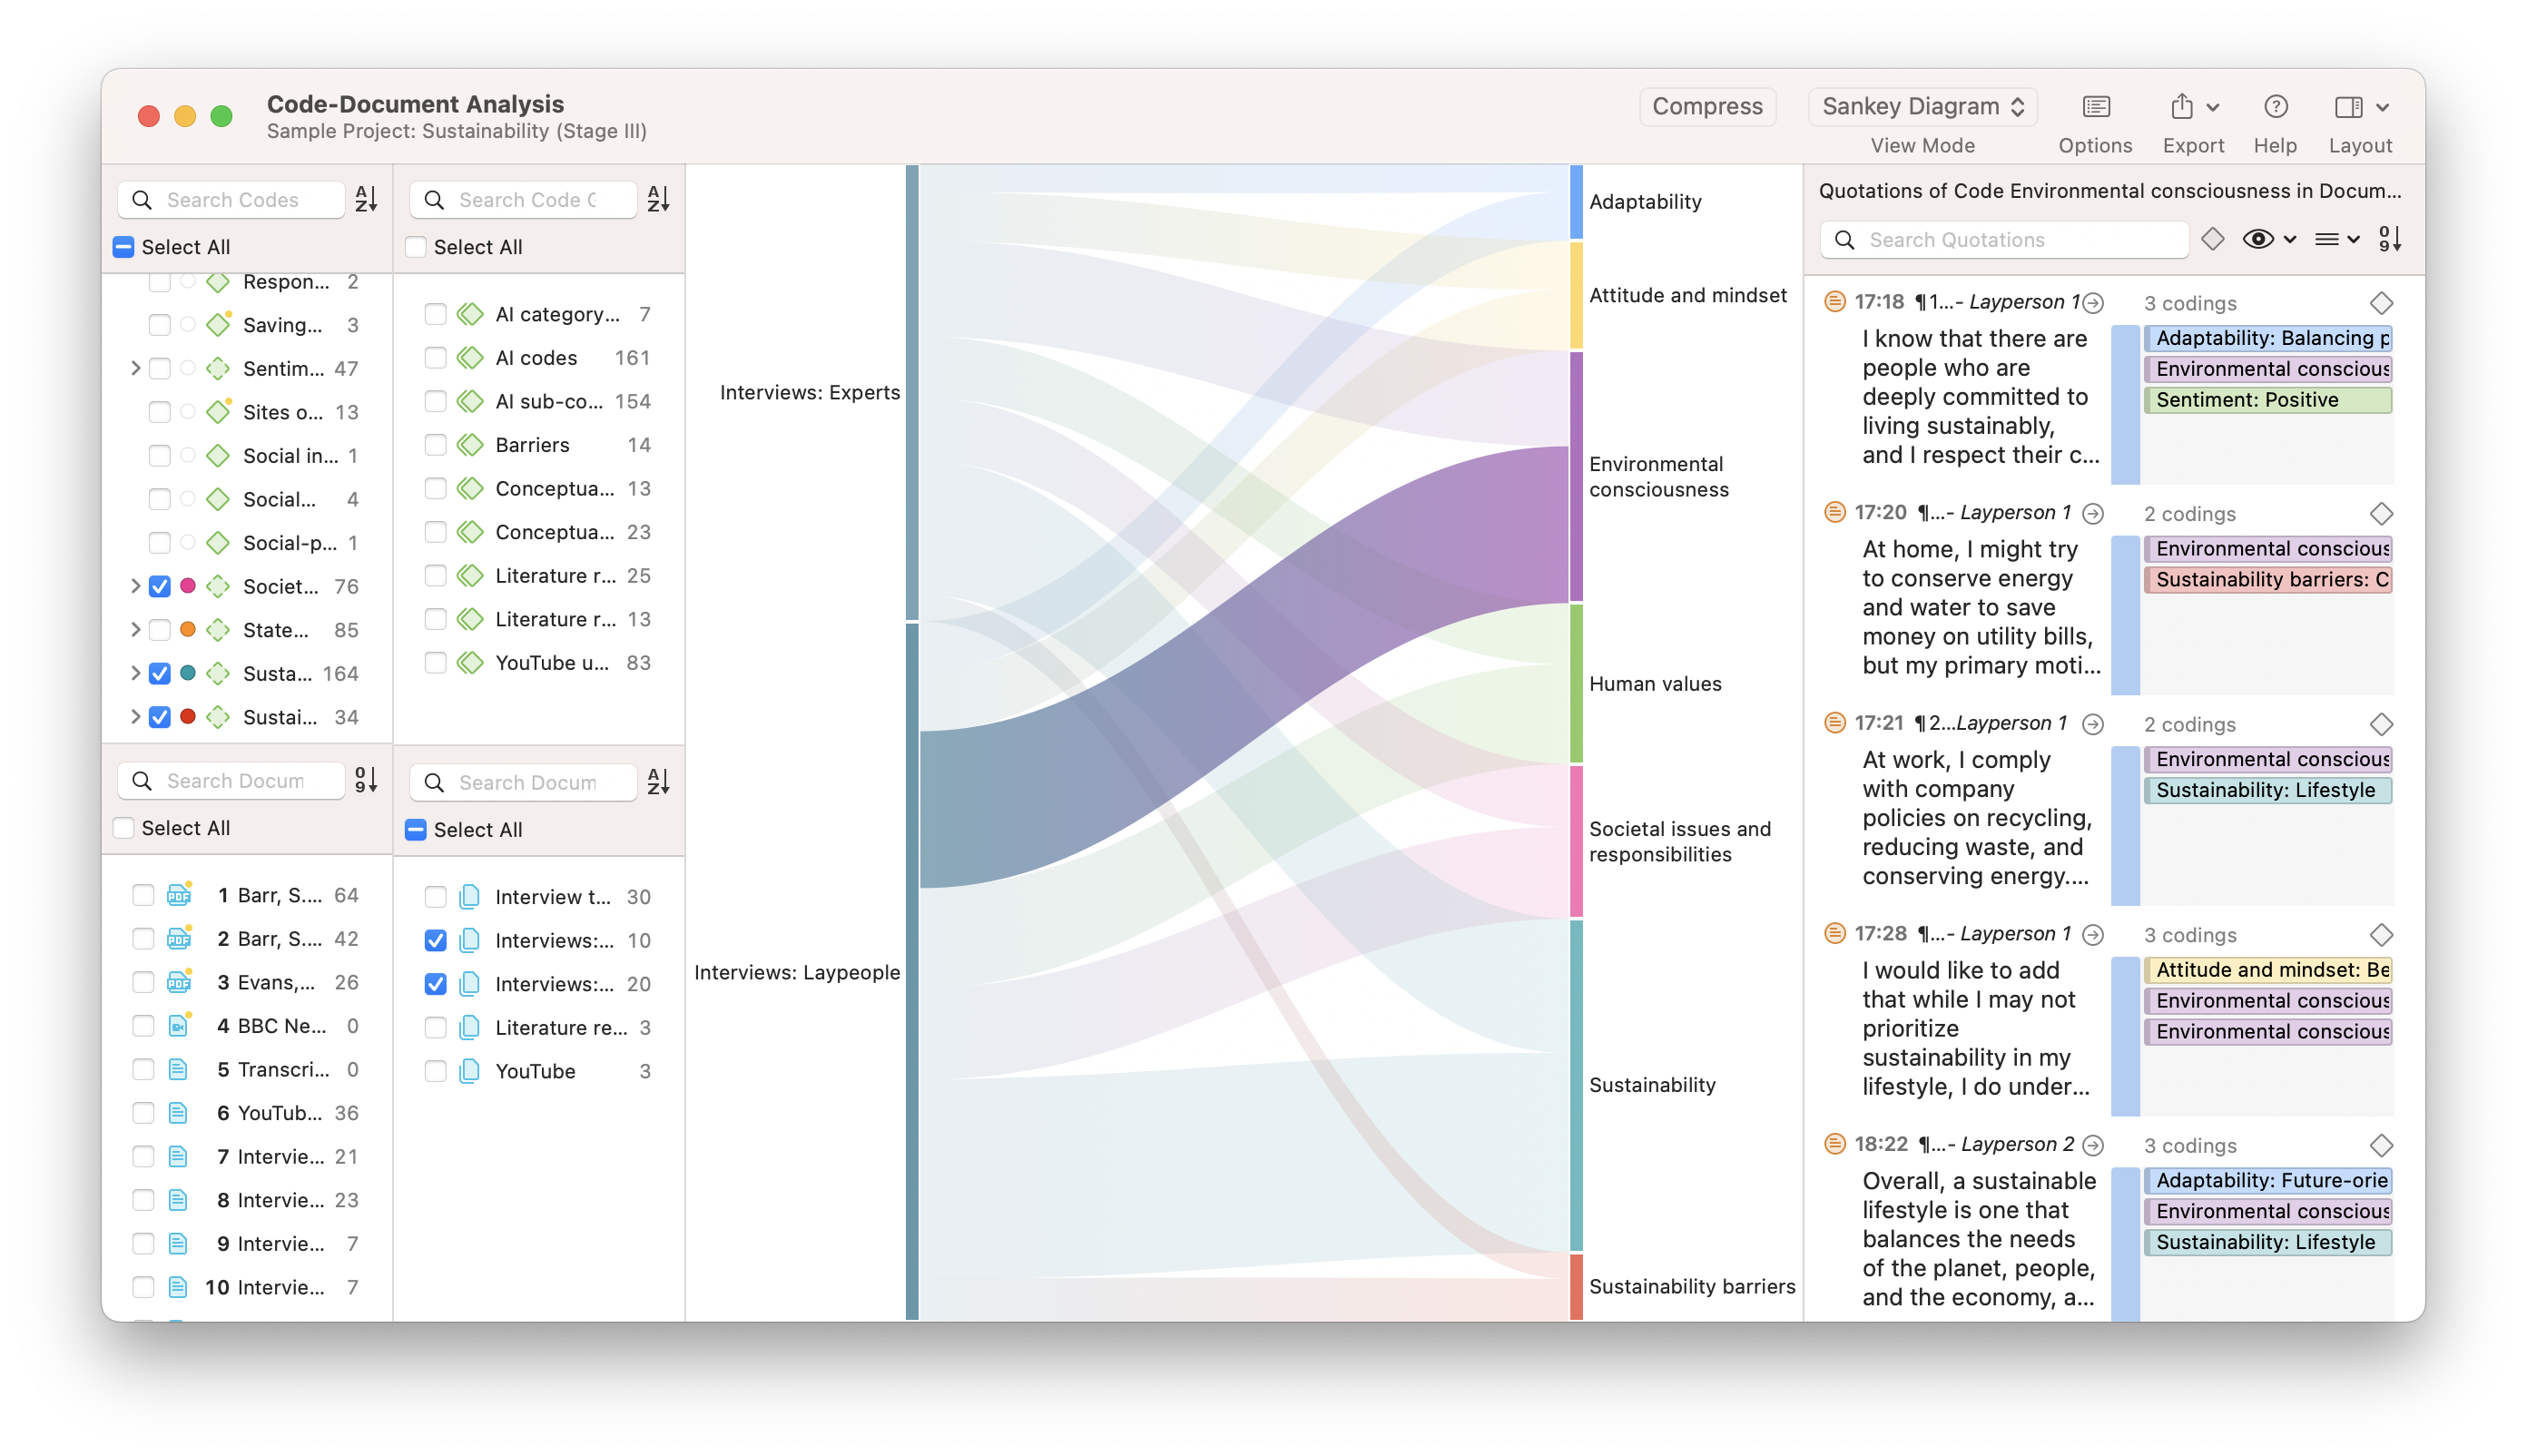
Qualitative data analysis begins with ATLAS.ti
For tools that can make the most out of your data, check out ATLAS.ti with a free trial.
- Privacy Policy
Home » Qualitative Data – Types, Methods and Examples
Qualitative Data – Types, Methods and Examples
Table of Contents

Qualitative Data
Definition:
Qualitative data is a type of data that is collected and analyzed in a non-numerical form, such as words, images, or observations. It is generally used to gain an in-depth understanding of complex phenomena, such as human behavior, attitudes, and beliefs.
Types of Qualitative Data
There are various types of qualitative data that can be collected and analyzed, including:
- Interviews : These involve in-depth, face-to-face conversations with individuals or groups to gather their perspectives, experiences, and opinions on a particular topic.
- Focus Groups: These are group discussions where a facilitator leads a discussion on a specific topic, allowing participants to share their views and experiences.
- Observations : These involve observing and recording the behavior and interactions of individuals or groups in a particular setting.
- Case Studies: These involve in-depth analysis of a particular individual, group, or organization, usually over an extended period.
- Document Analysis : This involves examining written or recorded materials, such as newspaper articles, diaries, or public records, to gain insight into a particular topic.
- Visual Data : This involves analyzing images or videos to understand people’s experiences or perspectives on a particular topic.
- Online Data: This involves analyzing data collected from social media platforms, forums, or online communities to understand people’s views and opinions on a particular topic.
Qualitative Data Formats
Qualitative data can be collected and presented in various formats. Some common formats include:
- Textual data: This includes written or transcribed data from interviews, focus groups, or observations. It can be analyzed using various techniques such as thematic analysis or content analysis.
- Audio data: This includes recordings of interviews or focus groups, which can be transcribed and analyzed using software such as NVivo.
- Visual data: This includes photographs, videos, or drawings, which can be analyzed using techniques such as visual analysis or semiotics.
- Mixed media data : This includes data collected in different formats, such as audio and text. This can be analyzed using mixed methods research, which combines both qualitative and quantitative research methods.
- Field notes: These are notes taken by researchers during observations, which can include descriptions of the setting, behaviors, and interactions of participants.
Qualitative Data Analysis Methods
Qualitative data analysis refers to the process of systematically analyzing and interpreting qualitative data to identify patterns, themes, and relationships. Here are some common methods of analyzing qualitative data:
- Thematic analysis: This involves identifying and analyzing patterns or themes within the data. It involves coding the data into themes and subthemes and organizing them into a coherent narrative.
- Content analysis: This involves analyzing the content of the data, such as the words, phrases, or images used. It involves identifying patterns and themes in the data and examining the relationships between them.
- Discourse analysis: This involves analyzing the language and communication used in the data, such as the meaning behind certain words or phrases. It involves examining how the language constructs and shapes social reality.
- Grounded theory: This involves developing a theory or framework based on the data. It involves identifying patterns and themes in the data and using them to develop a theory that explains the phenomenon being studied.
- Narrative analysis : This involves analyzing the stories and narratives present in the data. It involves examining how the stories are constructed and how they contribute to the overall understanding of the phenomenon being studied.
- Ethnographic analysis : This involves analyzing the culture and social practices present in the data. It involves examining how the cultural and social practices contribute to the phenomenon being studied.
Qualitative Data Collection Guide
Here are some steps to guide the collection of qualitative data:
- Define the research question : Start by clearly defining the research question that you want to answer. This will guide the selection of data collection methods and help to ensure that the data collected is relevant to the research question.
- Choose data collection methods : Select the most appropriate data collection methods based on the research question, the research design, and the resources available. Common methods include interviews, focus groups, observations, document analysis, and participatory research.
- Develop a data collection plan : Develop a plan for data collection that outlines the specific procedures, timelines, and resources needed for each data collection method. This plan should include details such as how to recruit participants, how to conduct interviews or focus groups, and how to record and store data.
- Obtain ethical approval : Obtain ethical approval from an institutional review board or ethics committee before beginning data collection. This is particularly important when working with human participants to ensure that their rights and interests are protected.
- Recruit participants: Recruit participants based on the research question and the data collection methods chosen. This may involve purposive sampling, snowball sampling, or random sampling.
- Collect data: Collect data using the chosen data collection methods. This may involve conducting interviews, facilitating focus groups, observing participants, or analyzing documents.
- Transcribe and store data : Transcribe and store the data in a secure location. This may involve transcribing audio or video recordings, organizing field notes, or scanning documents.
- Analyze data: Analyze the data using appropriate qualitative data analysis methods, such as thematic analysis or content analysis.
- I nterpret findings : Interpret the findings of the data analysis in the context of the research question and the relevant literature. This may involve developing new theories or frameworks, or validating existing ones.
- Communicate results: Communicate the results of the research in a clear and concise manner, using appropriate language and visual aids where necessary. This may involve writing a report, presenting at a conference, or publishing in a peer-reviewed journal.
Qualitative Data Examples
Some examples of qualitative data in different fields are as follows:
- Sociology : In sociology, qualitative data is used to study social phenomena such as culture, norms, and social relationships. For example, a researcher might conduct interviews with members of a community to understand their beliefs and practices.
- Psychology : In psychology, qualitative data is used to study human behavior, emotions, and attitudes. For example, a researcher might conduct a focus group to explore how individuals with anxiety cope with their symptoms.
- Education : In education, qualitative data is used to study learning processes and educational outcomes. For example, a researcher might conduct observations in a classroom to understand how students interact with each other and with their teacher.
- Marketing : In marketing, qualitative data is used to understand consumer behavior and preferences. For example, a researcher might conduct in-depth interviews with customers to understand their purchasing decisions.
- Anthropology : In anthropology, qualitative data is used to study human cultures and societies. For example, a researcher might conduct participant observation in a remote community to understand their customs and traditions.
- Health Sciences: In health sciences, qualitative data is used to study patient experiences, beliefs, and preferences. For example, a researcher might conduct interviews with cancer patients to understand how they cope with their illness.
Application of Qualitative Data
Qualitative data is used in a variety of fields and has numerous applications. Here are some common applications of qualitative data:
- Exploratory research: Qualitative data is often used in exploratory research to understand a new or unfamiliar topic. Researchers use qualitative data to generate hypotheses and develop a deeper understanding of the research question.
- Evaluation: Qualitative data is often used to evaluate programs or interventions. Researchers use qualitative data to understand the impact of a program or intervention on the people who participate in it.
- Needs assessment: Qualitative data is often used in needs assessments to understand the needs of a specific population. Researchers use qualitative data to identify the most pressing needs of the population and develop strategies to address those needs.
- Case studies: Qualitative data is often used in case studies to understand a particular case in detail. Researchers use qualitative data to understand the context, experiences, and perspectives of the people involved in the case.
- Market research: Qualitative data is often used in market research to understand consumer behavior and preferences. Researchers use qualitative data to gain insights into consumer attitudes, opinions, and motivations.
- Social and cultural research : Qualitative data is often used in social and cultural research to understand social phenomena such as culture, norms, and social relationships. Researchers use qualitative data to understand the experiences, beliefs, and practices of individuals and communities.
Purpose of Qualitative Data
The purpose of qualitative data is to gain a deeper understanding of social phenomena that cannot be captured by numerical or quantitative data. Qualitative data is collected through methods such as observation, interviews, and focus groups, and it provides descriptive information that can shed light on people’s experiences, beliefs, attitudes, and behaviors.
Qualitative data serves several purposes, including:
- Generating hypotheses: Qualitative data can be used to generate hypotheses about social phenomena that can be further tested with quantitative data.
- Providing context : Qualitative data provides a rich and detailed context for understanding social phenomena that cannot be captured by numerical data alone.
- Exploring complex phenomena : Qualitative data can be used to explore complex phenomena such as culture, social relationships, and the experiences of marginalized groups.
- Evaluating programs and intervention s: Qualitative data can be used to evaluate the impact of programs and interventions on the people who participate in them.
- Enhancing understanding: Qualitative data can be used to enhance understanding of the experiences, beliefs, and attitudes of individuals and communities, which can inform policy and practice.
When to use Qualitative Data
Qualitative data is appropriate when the research question requires an in-depth understanding of complex social phenomena that cannot be captured by numerical or quantitative data.
Here are some situations when qualitative data is appropriate:
- Exploratory research : Qualitative data is often used in exploratory research to generate hypotheses and develop a deeper understanding of a research question.
- Understanding social phenomena : Qualitative data is appropriate when the research question requires an in-depth understanding of social phenomena such as culture, social relationships, and experiences of marginalized groups.
- Program evaluation: Qualitative data is often used in program evaluation to understand the impact of a program on the people who participate in it.
- Needs assessment: Qualitative data is often used in needs assessments to understand the needs of a specific population.
- Market research: Qualitative data is often used in market research to understand consumer behavior and preferences.
- Case studies: Qualitative data is often used in case studies to understand a particular case in detail.
Characteristics of Qualitative Data
Here are some characteristics of qualitative data:
- Descriptive : Qualitative data provides a rich and detailed description of the social phenomena under investigation.
- Contextual : Qualitative data is collected in the context in which the social phenomena occur, which allows for a deeper understanding of the phenomena.
- Subjective : Qualitative data reflects the subjective experiences, beliefs, attitudes, and behaviors of the individuals and communities under investigation.
- Flexible : Qualitative data collection methods are flexible and can be adapted to the specific needs of the research question.
- Emergent : Qualitative data analysis is often an iterative process, where new themes and patterns emerge as the data is analyzed.
- Interpretive : Qualitative data analysis involves interpretation of the data, which requires the researcher to be reflexive and aware of their own biases and assumptions.
- Non-standardized: Qualitative data collection methods are often non-standardized, which means that the data is not collected in a standardized or uniform way.
Advantages of Qualitative Data
Some advantages of qualitative data are as follows:
- Richness : Qualitative data provides a rich and detailed description of the social phenomena under investigation, allowing for a deeper understanding of the phenomena.
- Flexibility : Qualitative data collection methods are flexible and can be adapted to the specific needs of the research question, allowing for a more nuanced exploration of social phenomena.
- Contextualization : Qualitative data is collected in the context in which the social phenomena occur, which allows for a deeper understanding of the phenomena and their cultural and social context.
- Subjectivity : Qualitative data reflects the subjective experiences, beliefs, attitudes, and behaviors of the individuals and communities under investigation, allowing for a more holistic understanding of the phenomena.
- New insights : Qualitative data can generate new insights and hypotheses that can be further tested with quantitative data.
- Participant voice : Qualitative data collection methods often involve direct participation by the individuals and communities under investigation, allowing for their voices to be heard.
- Ethical considerations: Qualitative data collection methods often prioritize ethical considerations such as informed consent, confidentiality, and respect for the autonomy of the participants.
Limitations of Qualitative Data
Here are some limitations of qualitative data:
- Subjectivity : Qualitative data is subjective, and the interpretation of the data depends on the researcher’s own biases, assumptions, and perspectives.
- Small sample size: Qualitative data collection methods often involve a small sample size, which limits the generalizability of the findings.
- Time-consuming: Qualitative data collection and analysis can be time-consuming, as it requires in-depth engagement with the data and often involves iterative processes.
- Limited statistical analysis: Qualitative data is often not suitable for statistical analysis, which limits the ability to draw quantitative conclusions from the data.
- Limited comparability: Qualitative data collection methods are often non-standardized, which makes it difficult to compare findings across different studies or contexts.
- Social desirability bias : Qualitative data collection methods often rely on self-reporting by the participants, which can be influenced by social desirability bias.
- Researcher bias: The researcher’s own biases, assumptions, and perspectives can influence the data collection and analysis, which can limit the objectivity of the findings.
About the author

Muhammad Hassan
Researcher, Academic Writer, Web developer
You may also like

Primary Data – Types, Methods and Examples

Research Data – Types Methods and Examples

Quantitative Data – Types, Methods and Examples

Secondary Data – Types, Methods and Examples

Information in Research – Types and Examples
Learn / Guides / Qualitative data analysis guide
Back to guides
5 qualitative data analysis methods
Qualitative data uncovers valuable insights that help you improve the user and customer experience. But how exactly do you measure and analyze data that isn't quantifiable?
There are different qualitative data analysis methods to help you make sense of qualitative feedback and customer insights, depending on your business goals and the type of data you've collected.
Before you choose a qualitative data analysis method for your team, you need to consider the available techniques and explore their use cases to understand how each process might help you better understand your users.
This guide covers five qualitative analysis methods to choose from, and will help you pick the right one(s) based on your goals.
Content analysis
Thematic analysis
Narrative analysis
Grounded theory analysis
Discourse analysis
5 qualitative data analysis methods explained
Qualitative data analysis ( QDA ) is the process of organizing, analyzing, and interpreting qualitative research data—non-numeric, conceptual information, and user feedback—to capture themes and patterns, answer research questions, and identify actions to improve your product or website.
Step 1 in the research process (after planning ) is qualitative data collection. You can use behavior analytics software—like Hotjar —to capture qualitative data with context, and learn the real motivation behind user behavior, by collecting written customer feedback with Surveys or scheduling an in-depth user interview with Engage .
Use Hotjar’s tools to collect feedback, uncover behavior trends, and understand the ‘why’ behind user actions.
1. Content analysis
Content analysis is a qualitative research method that examines and quantifies the presence of certain words, subjects, and concepts in text, image, video, or audio messages. The method transforms qualitative input into quantitative data to help you make reliable conclusions about what customers think of your brand, and how you can improve their experience and opinion.
Conduct content analysis manually (which can be time-consuming) or use analysis tools like Lexalytics to reveal communication patterns, uncover differences in individual or group communication trends, and make broader connections between concepts.

How content analysis can help your team
Content analysis is often used by marketers and customer service specialists, helping them understand customer behavior and measure brand reputation.
For example, you may run a customer survey with open-ended questions to discover users’ concerns—in their own words—about their experience with your product. Instead of having to process hundreds of answers manually, a content analysis tool helps you analyze and group results based on the emotion expressed in texts.
Some other examples of content analysis include:
Analyzing brand mentions on social media to understand your brand's reputation
Reviewing customer feedback to evaluate (and then improve) the customer and user experience (UX)
Researching competitors’ website pages to identify their competitive advantages and value propositions
Interpreting customer interviews and survey results to determine user preferences, and setting the direction for new product or feature developments
Content analysis was a major part of our growth during my time at Hypercontext.
[It gave us] a better understanding of the [blog] topics that performed best for signing new users up. We were also able to go deeper within those blog posts to better understand the formats [that worked].
2. Thematic analysis
Thematic analysis helps you identify, categorize, analyze, and interpret patterns in qualitative study data , and can be done with tools like Dovetail and Thematic .
While content analysis and thematic analysis seem similar, they're different in concept:
Content analysis can be applied to both qualitative and quantitative data , and focuses on identifying frequencies and recurring words and subjects
Thematic analysis can only be applied to qualitative data, and focuses on identifying patterns and themes

How thematic analysis can help your team
Thematic analysis can be used by pretty much anyone: from product marketers, to customer relationship managers, to UX researchers.
For example, product teams use thematic analysis to better understand user behaviors and needs and improve UX . Analyzing customer feedback lets you identify themes (e.g. poor navigation or a buggy mobile interface) highlighted by users and get actionable insight into what they really expect from the product.
💡 Pro tip: looking for a way to expedite the data analysis process for large amounts of data you collected with a survey? Try Hotjar’s AI for Surveys : along with generating a survey based on your goal in seconds, our AI will analyze the raw data and prepare an automated summary report that presents key thematic findings, respondent quotes, and actionable steps to take, making the analysis of qualitative data a breeze.
3. Narrative analysis
Narrative analysis is a method used to interpret research participants’ stories —things like testimonials , case studies, focus groups, interviews, and other text or visual data—with tools like Delve and AI-powered ATLAS.ti .
Some formats don’t work well with narrative analysis, including heavily structured interviews and written surveys, which don’t give participants as much opportunity to tell their stories in their own words.

How narrative analysis can help your team
Narrative analysis provides product teams with valuable insight into the complexity of customers’ lives, feelings, and behaviors.
In a marketing research context, narrative analysis involves capturing and reviewing customer stories—on social media, for example—to get in-depth insight into their lives, priorities, and challenges.
This might look like analyzing daily content shared by your audiences’ favorite influencers on Instagram, or analyzing customer reviews on sites like G2 or Capterra to gain a deep understanding of individual customer experiences. The results of this analysis also contribute to developing corresponding customer personas .
💡 Pro tip: conducting user interviews is an excellent way to collect data for narrative analysis. Though interviews can be time-intensive, there are tools out there that streamline the workload.
Hotjar Engage automates the entire process, from recruiting to scheduling to generating the all-important interview transcripts you’ll need for the analysis phase of your research project.
4. Grounded theory analysis
Grounded theory analysis is a method of conducting qualitative research to develop theories by examining real-world data. This technique involves the creation of hypotheses and theories through qualitative data collection and evaluation, and can be performed with qualitative data analysis software tools like MAXQDA and NVivo .
Unlike other qualitative data analysis techniques, this method is inductive rather than deductive: it develops theories from data, not the other way around.

How grounded theory analysis can help your team
Grounded theory analysis is used by software engineers, product marketers, managers, and other specialists who deal with data sets to make informed business decisions.
For example, product marketing teams may turn to customer surveys to understand the reasons behind high churn rates , then use grounded theory to analyze responses and develop hypotheses about why users churn, and how you can get them to stay.
Grounded theory can also be helpful in the talent management process. For example, HR representatives may use it to develop theories about low employee engagement, and come up with solutions based on their research findings.
5. Discourse analysis
Discourse analysis is the act of researching the underlying meaning of qualitative data. It involves the observation of texts, audio, and videos to study the relationships between information and its social context.
In contrast to content analysis, this method focuses on the contextual meaning of language: discourse analysis sheds light on what audiences think of a topic, and why they feel the way they do about it.

How discourse analysis can help your team
In a business context, this method is primarily used by marketing teams. Discourse analysis helps marketers understand the norms and ideas in their market , and reveals why they play such a significant role for their customers.
Once the origins of trends are uncovered, it’s easier to develop a company mission, create a unique tone of voice, and craft effective marketing messages.
Which qualitative data analysis method should you choose?
While the five qualitative data analysis methods we list above are all aimed at processing data and answering research questions, these techniques differ in their intent and the approaches applied.
Choosing the right analysis method for your team isn't a matter of preference—selecting a method that fits is only possible once you define your research goals and have a clear intention. When you know what you need (and why you need it), you can identify an analysis method that aligns with your research objectives.
Gather qualitative data with Hotjar
Use Hotjar’s product experience insights in your qualitative research. Collect feedback, uncover behavior trends, and understand the ‘why’ behind user actions.
FAQs about qualitative data analysis methods
What is the qualitative data analysis approach.
The qualitative data analysis approach refers to the process of systematizing descriptive data collected through interviews, focus groups, surveys, and observations and then interpreting it. The methodology aims to identify patterns and themes behind textual data, and other unquantifiable data, as opposed to numerical data.
What are qualitative data analysis methods?
Five popular qualitative data analysis methods are:
What is the process of qualitative data analysis?
The process of qualitative data analysis includes six steps:
Define your research question
Prepare the data
Choose the method of qualitative analysis
Code the data
Identify themes, patterns, and relationships
Make hypotheses and act
Qualitative data analysis guide
Previous chapter
QDA challenges
Next chapter
- Skip to main content
- Skip to primary sidebar
- Skip to footer
- QuestionPro

- Solutions Industries Gaming Automotive Sports and events Education Government Travel & Hospitality Financial Services Healthcare Cannabis Technology Use Case NPS+ Communities Audience Contactless surveys Mobile LivePolls Member Experience GDPR Positive People Science 360 Feedback Surveys
- Resources Blog eBooks Survey Templates Case Studies Training Help center
Home Market Research
Data Analysis in Research: Types & Methods

Content Index
Why analyze data in research?
Types of data in research, finding patterns in the qualitative data, methods used for data analysis in qualitative research, preparing data for analysis, methods used for data analysis in quantitative research, considerations in research data analysis, what is data analysis in research.
Definition of research in data analysis: According to LeCompte and Schensul, research data analysis is a process used by researchers to reduce data to a story and interpret it to derive insights. The data analysis process helps reduce a large chunk of data into smaller fragments, which makes sense.
Three essential things occur during the data analysis process — the first is data organization . Summarization and categorization together contribute to becoming the second known method used for data reduction. It helps find patterns and themes in the data for easy identification and linking. The third and last way is data analysis – researchers do it in both top-down and bottom-up fashion.
LEARN ABOUT: Research Process Steps
On the other hand, Marshall and Rossman describe data analysis as a messy, ambiguous, and time-consuming but creative and fascinating process through which a mass of collected data is brought to order, structure and meaning.
We can say that “the data analysis and data interpretation is a process representing the application of deductive and inductive logic to the research and data analysis.”
Researchers rely heavily on data as they have a story to tell or research problems to solve. It starts with a question, and data is nothing but an answer to that question. But, what if there is no question to ask? Well! It is possible to explore data even without a problem – we call it ‘Data Mining’, which often reveals some interesting patterns within the data that are worth exploring.
Irrelevant to the type of data researchers explore, their mission and audiences’ vision guide them to find the patterns to shape the story they want to tell. One of the essential things expected from researchers while analyzing data is to stay open and remain unbiased toward unexpected patterns, expressions, and results. Remember, sometimes, data analysis tells the most unforeseen yet exciting stories that were not expected when initiating data analysis. Therefore, rely on the data you have at hand and enjoy the journey of exploratory research.
Create a Free Account
Every kind of data has a rare quality of describing things after assigning a specific value to it. For analysis, you need to organize these values, processed and presented in a given context, to make it useful. Data can be in different forms; here are the primary data types.
- Qualitative data: When the data presented has words and descriptions, then we call it qualitative data . Although you can observe this data, it is subjective and harder to analyze data in research, especially for comparison. Example: Quality data represents everything describing taste, experience, texture, or an opinion that is considered quality data. This type of data is usually collected through focus groups, personal qualitative interviews , qualitative observation or using open-ended questions in surveys.
- Quantitative data: Any data expressed in numbers of numerical figures are called quantitative data . This type of data can be distinguished into categories, grouped, measured, calculated, or ranked. Example: questions such as age, rank, cost, length, weight, scores, etc. everything comes under this type of data. You can present such data in graphical format, charts, or apply statistical analysis methods to this data. The (Outcomes Measurement Systems) OMS questionnaires in surveys are a significant source of collecting numeric data.
- Categorical data: It is data presented in groups. However, an item included in the categorical data cannot belong to more than one group. Example: A person responding to a survey by telling his living style, marital status, smoking habit, or drinking habit comes under the categorical data. A chi-square test is a standard method used to analyze this data.
Learn More : Examples of Qualitative Data in Education
Data analysis in qualitative research
Data analysis and qualitative data research work a little differently from the numerical data as the quality data is made up of words, descriptions, images, objects, and sometimes symbols. Getting insight from such complicated information is a complicated process. Hence it is typically used for exploratory research and data analysis .
Although there are several ways to find patterns in the textual information, a word-based method is the most relied and widely used global technique for research and data analysis. Notably, the data analysis process in qualitative research is manual. Here the researchers usually read the available data and find repetitive or commonly used words.
For example, while studying data collected from African countries to understand the most pressing issues people face, researchers might find “food” and “hunger” are the most commonly used words and will highlight them for further analysis.
LEARN ABOUT: Level of Analysis
The keyword context is another widely used word-based technique. In this method, the researcher tries to understand the concept by analyzing the context in which the participants use a particular keyword.
For example , researchers conducting research and data analysis for studying the concept of ‘diabetes’ amongst respondents might analyze the context of when and how the respondent has used or referred to the word ‘diabetes.’
The scrutiny-based technique is also one of the highly recommended text analysis methods used to identify a quality data pattern. Compare and contrast is the widely used method under this technique to differentiate how a specific text is similar or different from each other.
For example: To find out the “importance of resident doctor in a company,” the collected data is divided into people who think it is necessary to hire a resident doctor and those who think it is unnecessary. Compare and contrast is the best method that can be used to analyze the polls having single-answer questions types .
Metaphors can be used to reduce the data pile and find patterns in it so that it becomes easier to connect data with theory.
Variable Partitioning is another technique used to split variables so that researchers can find more coherent descriptions and explanations from the enormous data.
LEARN ABOUT: Qualitative Research Questions and Questionnaires
There are several techniques to analyze the data in qualitative research, but here are some commonly used methods,
- Content Analysis: It is widely accepted and the most frequently employed technique for data analysis in research methodology. It can be used to analyze the documented information from text, images, and sometimes from the physical items. It depends on the research questions to predict when and where to use this method.
- Narrative Analysis: This method is used to analyze content gathered from various sources such as personal interviews, field observation, and surveys . The majority of times, stories, or opinions shared by people are focused on finding answers to the research questions.
- Discourse Analysis: Similar to narrative analysis, discourse analysis is used to analyze the interactions with people. Nevertheless, this particular method considers the social context under which or within which the communication between the researcher and respondent takes place. In addition to that, discourse analysis also focuses on the lifestyle and day-to-day environment while deriving any conclusion.
- Grounded Theory: When you want to explain why a particular phenomenon happened, then using grounded theory for analyzing quality data is the best resort. Grounded theory is applied to study data about the host of similar cases occurring in different settings. When researchers are using this method, they might alter explanations or produce new ones until they arrive at some conclusion.
LEARN ABOUT: 12 Best Tools for Researchers
Data analysis in quantitative research
The first stage in research and data analysis is to make it for the analysis so that the nominal data can be converted into something meaningful. Data preparation consists of the below phases.
Phase I: Data Validation
Data validation is done to understand if the collected data sample is per the pre-set standards, or it is a biased data sample again divided into four different stages
- Fraud: To ensure an actual human being records each response to the survey or the questionnaire
- Screening: To make sure each participant or respondent is selected or chosen in compliance with the research criteria
- Procedure: To ensure ethical standards were maintained while collecting the data sample
- Completeness: To ensure that the respondent has answered all the questions in an online survey. Else, the interviewer had asked all the questions devised in the questionnaire.
Phase II: Data Editing
More often, an extensive research data sample comes loaded with errors. Respondents sometimes fill in some fields incorrectly or sometimes skip them accidentally. Data editing is a process wherein the researchers have to confirm that the provided data is free of such errors. They need to conduct necessary checks and outlier checks to edit the raw edit and make it ready for analysis.
Phase III: Data Coding
Out of all three, this is the most critical phase of data preparation associated with grouping and assigning values to the survey responses . If a survey is completed with a 1000 sample size, the researcher will create an age bracket to distinguish the respondents based on their age. Thus, it becomes easier to analyze small data buckets rather than deal with the massive data pile.
LEARN ABOUT: Steps in Qualitative Research
After the data is prepared for analysis, researchers are open to using different research and data analysis methods to derive meaningful insights. For sure, statistical analysis plans are the most favored to analyze numerical data. In statistical analysis, distinguishing between categorical data and numerical data is essential, as categorical data involves distinct categories or labels, while numerical data consists of measurable quantities. The method is again classified into two groups. First, ‘Descriptive Statistics’ used to describe data. Second, ‘Inferential statistics’ that helps in comparing the data .
Descriptive statistics
This method is used to describe the basic features of versatile types of data in research. It presents the data in such a meaningful way that pattern in the data starts making sense. Nevertheless, the descriptive analysis does not go beyond making conclusions. The conclusions are again based on the hypothesis researchers have formulated so far. Here are a few major types of descriptive analysis methods.
Measures of Frequency
- Count, Percent, Frequency
- It is used to denote home often a particular event occurs.
- Researchers use it when they want to showcase how often a response is given.
Measures of Central Tendency
- Mean, Median, Mode
- The method is widely used to demonstrate distribution by various points.
- Researchers use this method when they want to showcase the most commonly or averagely indicated response.
Measures of Dispersion or Variation
- Range, Variance, Standard deviation
- Here the field equals high/low points.
- Variance standard deviation = difference between the observed score and mean
- It is used to identify the spread of scores by stating intervals.
- Researchers use this method to showcase data spread out. It helps them identify the depth until which the data is spread out that it directly affects the mean.
Measures of Position
- Percentile ranks, Quartile ranks
- It relies on standardized scores helping researchers to identify the relationship between different scores.
- It is often used when researchers want to compare scores with the average count.
For quantitative research use of descriptive analysis often give absolute numbers, but the in-depth analysis is never sufficient to demonstrate the rationale behind those numbers. Nevertheless, it is necessary to think of the best method for research and data analysis suiting your survey questionnaire and what story researchers want to tell. For example, the mean is the best way to demonstrate the students’ average scores in schools. It is better to rely on the descriptive statistics when the researchers intend to keep the research or outcome limited to the provided sample without generalizing it. For example, when you want to compare average voting done in two different cities, differential statistics are enough.
Descriptive analysis is also called a ‘univariate analysis’ since it is commonly used to analyze a single variable.
Inferential statistics
Inferential statistics are used to make predictions about a larger population after research and data analysis of the representing population’s collected sample. For example, you can ask some odd 100 audiences at a movie theater if they like the movie they are watching. Researchers then use inferential statistics on the collected sample to reason that about 80-90% of people like the movie.
Here are two significant areas of inferential statistics.
- Estimating parameters: It takes statistics from the sample research data and demonstrates something about the population parameter.
- Hypothesis test: I t’s about sampling research data to answer the survey research questions. For example, researchers might be interested to understand if the new shade of lipstick recently launched is good or not, or if the multivitamin capsules help children to perform better at games.
These are sophisticated analysis methods used to showcase the relationship between different variables instead of describing a single variable. It is often used when researchers want something beyond absolute numbers to understand the relationship between variables.
Here are some of the commonly used methods for data analysis in research.
- Correlation: When researchers are not conducting experimental research or quasi-experimental research wherein the researchers are interested to understand the relationship between two or more variables, they opt for correlational research methods.
- Cross-tabulation: Also called contingency tables, cross-tabulation is used to analyze the relationship between multiple variables. Suppose provided data has age and gender categories presented in rows and columns. A two-dimensional cross-tabulation helps for seamless data analysis and research by showing the number of males and females in each age category.
- Regression analysis: For understanding the strong relationship between two variables, researchers do not look beyond the primary and commonly used regression analysis method, which is also a type of predictive analysis used. In this method, you have an essential factor called the dependent variable. You also have multiple independent variables in regression analysis. You undertake efforts to find out the impact of independent variables on the dependent variable. The values of both independent and dependent variables are assumed as being ascertained in an error-free random manner.
- Frequency tables: The statistical procedure is used for testing the degree to which two or more vary or differ in an experiment. A considerable degree of variation means research findings were significant. In many contexts, ANOVA testing and variance analysis are similar.
- Analysis of variance: The statistical procedure is used for testing the degree to which two or more vary or differ in an experiment. A considerable degree of variation means research findings were significant. In many contexts, ANOVA testing and variance analysis are similar.
- Researchers must have the necessary research skills to analyze and manipulation the data , Getting trained to demonstrate a high standard of research practice. Ideally, researchers must possess more than a basic understanding of the rationale of selecting one statistical method over the other to obtain better data insights.
- Usually, research and data analytics projects differ by scientific discipline; therefore, getting statistical advice at the beginning of analysis helps design a survey questionnaire, select data collection methods , and choose samples.
LEARN ABOUT: Best Data Collection Tools
- The primary aim of data research and analysis is to derive ultimate insights that are unbiased. Any mistake in or keeping a biased mind to collect data, selecting an analysis method, or choosing audience sample il to draw a biased inference.
- Irrelevant to the sophistication used in research data and analysis is enough to rectify the poorly defined objective outcome measurements. It does not matter if the design is at fault or intentions are not clear, but lack of clarity might mislead readers, so avoid the practice.
- The motive behind data analysis in research is to present accurate and reliable data. As far as possible, avoid statistical errors, and find a way to deal with everyday challenges like outliers, missing data, data altering, data mining , or developing graphical representation.
LEARN MORE: Descriptive Research vs Correlational Research The sheer amount of data generated daily is frightening. Especially when data analysis has taken center stage. in 2018. In last year, the total data supply amounted to 2.8 trillion gigabytes. Hence, it is clear that the enterprises willing to survive in the hypercompetitive world must possess an excellent capability to analyze complex research data, derive actionable insights, and adapt to the new market needs.
LEARN ABOUT: Average Order Value
QuestionPro is an online survey platform that empowers organizations in data analysis and research and provides them a medium to collect data by creating appealing surveys.
MORE LIKE THIS

I Am Disconnected – Tuesday CX Thoughts
May 21, 2024

20 Best Customer Success Tools of 2024
May 20, 2024

AI-Based Services Buying Guide for Market Research (based on ESOMAR’s 20 Questions)

Data Information vs Insight: Essential differences
May 14, 2024
Other categories
- Academic Research
- Artificial Intelligence
- Assessments
- Brand Awareness
- Case Studies
- Communities
- Consumer Insights
- Customer effort score
- Customer Engagement
- Customer Experience
- Customer Loyalty
- Customer Research
- Customer Satisfaction
- Employee Benefits
- Employee Engagement
- Employee Retention
- Friday Five
- General Data Protection Regulation
- Insights Hub
- Life@QuestionPro
- Market Research
- Mobile diaries
- Mobile Surveys
- New Features
- Online Communities
- Question Types
- Questionnaire
- QuestionPro Products
- Release Notes
- Research Tools and Apps
- Revenue at Risk
- Survey Templates
- Training Tips
- Uncategorized
- Video Learning Series
- What’s Coming Up
- Workforce Intelligence
- Python For Data Analysis
- Data Science
- Data Analysis with R
- Data Analysis with Python
- Data Visualization with Python
- Data Analysis Examples
- Math for Data Analysis
- Data Analysis Interview questions
- Artificial Intelligence
- Data Analysis Projects
- Machine Learning
- Deep Learning
- Computer Vision
- How to Use Bard for Data Analysis and Insights
- Financial Analysis: Objectives, Methods, and Process
- Time Series Analysis & Visualization in Python
- Difference Between Data Visualization and Data Analytics
- What are the 5 methods of statistical analysis?
- What Is Spatial Analysis, and How Does It Work
- Qualitative and Quantitative Data
- What is Geospatial Data Analysis?
- Data-Driven Design Decisions and Analytics Tools
- Data analysis and Visualization with Python
- Exploratory Data Analysis (EDA) - Types and Tools
- Data Analytics and its type
- Why Data Visualization Matters in Data Analytics?
- What is Data Analysis?
- Data analytics and career opportunities
- Methods of Economic Analysis
- Data Science Methodology and Approach
- Data | Analysis Quiz | Question 1
- What is Exploratory Data Analysis ?
Qualitative Data Analysis Methodologies and Methods
Qualitative data analysis involves interpreting non-numerical data to identify patterns, themes, and insights. There are several methodologies and methods used in qualitative data analysis.

In this article, we will explore qualitative data analysis techniques in great detail, with each method providing a different perspective on how to interpret qualitative data.
Table of Content
Types of Qualitative Data Analysis Methodologies
1. content analysis, 2. thematic analysis, 3. narrative analysis, 4. discourse analysis, 5. grounded theory analysis, 6. text analysis, 7. ethnographic analysis, advantages and disadvantages of different qualitative data analysis methodologies, best practices for qualitative data analysis, qualitative data analysis methods- faq’s.
Lets weigh the benefits and disadvantages of each:
Content analysis involves systematically reading textual content or other types of communication to perceive patterns, themes, and meanings within the content. It provides a dependent technique to inspecting huge volumes of records to discover insights or trends. Researchers categorize and code the content material based on predetermined criteria or emergent themes, taking into consideration quantitative and qualitative interpretation of the facts. Content analysis is regularly an iterative procedure, with researchers revisiting and refining the coding scheme, collecting additional facts, or accomplishing in addition analysis as needed to deepen know-how or cope with new studies questions.
There are 3 fundamental techniques to content analysis:
- Conventional Content Analysis : In conventional content analysis, researchers technique the records with out preconceived categories or theoretical frameworks. Instead, they allow classes and themes to emerge evidently from the statistics through an iterative system of coding and analysis. This technique is exploratory and bendy, allowing for the discovery of latest insights and styles inside the content material.
- Directed Content Analysis : Directed content material analysis entails studying the statistics based totally on existing theories or principles. Researchers start with predefined categories or subject matters derived from theoretical frameworks or previous research findings. The analysis is focused on confirming, refining, or extending present theories in place of coming across new ones. Directed content analysis is specifically beneficial whilst researchers intention to test hypotheses or explore particular concepts in the statistics.
- Summative Content Analysis : Summative content material analysis focuses on quantifying the presence or frequency of precise content within the information. Researchers expand predetermined classes or coding schemes primarily based on predefined criteria, after which systematically code the statistics in line with those classes. The emphasis is on counting occurrences of predefined attributes or topics to provide a numerical summary of the content. Summative content material analysis is frequently used to track modifications over time, examine unique assets of content material, or verify the superiority of specific subject matters inside a dataset.
When to Use Content Analysis?
- Exploratory Research : Content analysis is appropriate for exploratory research in which the goal is to uncover new insights, discover emerging developments, or recognize the breadth of communique on a particular subject matter.
- Comparative Analysis: It is useful for comparative analysis, permitting researchers to compare conversation throughout extraordinary sources, time periods, or cultural contexts.
- Historical Analysis : Content analysis can be carried out to historical research, allowing researchers to analyze ancient files, media content, or archival substances to apprehend conversation styles over the years.
- Policy Analysis: It is valuable for policy analysis, supporting researchers look at the portrayal of problems in media or public discourse and informing coverage-making methods.
- Market Research: Content analysis is usually utilized in market research to investigate advertising and marketing substances, social media content, and customer critiques, presenting insights into patron perceptions and possibilities.
Thematic analysis is a method for identifying, analyzing, and reporting styles or topics within qualitative records. It entails systematically coding and categorizing information to become aware of not unusual issues, styles, or ideas that emerge from the dataset. Researchers interact in a method of inductive reasoning to generate topics that capture the essence of the facts, making an allowance for interpretation and exploration of underlying meanings.
Thematic analysis is appropriate when researchers are seeking for to become aware of, analyze, and document patterns or issues inside qualitative records. It is especially beneficial for exploratory studies where the intention is to find new insights or recognize the breadth of studies and views associated with a specific phenomenon.
Thematic analysis offers a bendy and systematic approach for identifying and reading styles or topics within qualitative statistics, making it a treasured method for exploring complex phenomena and producing insights that inform concept, exercise, and policy.
When to use Thematic analysis?
- Psychology : Thematic analysis is used to explore mental phenomena, which include coping mechanisms in reaction to strain, attitudes towards mental fitness, or stories of trauma.
- Education : Researchers practice thematic analysis to apprehend student perceptions of getting to know environments, teaching methods, or academic interventions.
- Healthcare : Thematic analysis enables take a look at affected person reports with healthcare offerings, attitudes towards treatment alternatives, or obstacles to gaining access to healthcare.
- Market Research: Thematic analysis is applied to research purchaser remarks, perceive product options, or recognize emblem perceptions in marketplace research research.
Narrative analysis entails analyzing and interpreting the memories or narratives that people use to make feel of their stories. It focuses on the shape, content, and which means of narratives to apprehend how people construct and speak their identities, values, and ideals via storytelling. It is especially beneficial for exploring how people assemble and communicate their identities, values, and beliefs through storytelling.
When to use Narrative Analysis?
It’s extensively used throughout numerous disciplines, which includes sociology, psychology, anthropology, literary research, and verbal exchange studies. Some applications of narrative analysis in qualitative statistics analysis methodologies are:
- Understanding Identity Construction : Narrative analysis can be used to explore how people construct their identities through the tales they tell approximately themselves. Researchers can examine the issues, plot systems, and language utilized in narratives to uncover how individuals perceive themselves and their place inside the world.
- Exploring Life Experiences : Researchers frequently use narrative analysis to research the lived reports of people or groups. By inspecting the narratives shared by using members, researchers can advantage insights into the demanding situations, triumphs, and extensive events that shape people’s lives.
- Examining Cultural Meanings and Practices: Narrative analysis can provide treasured insights into cultural meanings and practices. By studying the stories shared within a selected cultural context, researchers can find shared values, ideals, and norms that influence behavior and social interactions.
- Exploring Trauma and Healing : Narrative analysis is usually utilized in studies on trauma and restoration tactics. By studying narratives of trauma survivors, researchers can explore how individuals make experience of their studies, deal with adversity, and embark on trips of restoration and resilience.
- Analyzing Media and Popular Culture : Narrative analysis also can be applied to analyze media texts, inclusive of films, tv suggests, and literature. Researchers can have a look at the narratives constructed within these texts to understand how they reflect and shape cultural beliefs, ideologies, and norms.
Narrative analysis offers a powerful technique for exploring the structure, content, and that means of narratives or stories instructed by people, providing insights into their lived reports, identities, and perspectives. However, researchers need to navigate the interpretive subjectivity, time-extensive nature, and moral concerns related to reading narratives in qualitative studies.
Discourse analysis examines the approaches wherein language is used to construct that means, form social interactions, and reproduce electricity members of the family inside society. It makes a speciality of studying spoken or written texts, in addition to the wider social and cultural contexts in which communique happens. Researchers explore how language displays and shapes social norms, ideologies, and power dynamics.
Discourse analysis is employed when researchers are seeking to investigate social interactions, power dynamics, and identity creation through language. It is applied to take a look at how language shapes social relations, constructs identities, and reflects cultural norms and values.
When to use Discourse Analysis?
- Linguistics and Language Studies : Discourse analysis is foundational to linguistics and language research, where it’s miles used to study language use, communique patterns, and discourse structures. Linguists behavior discourse analysis to investigate how language shapes social interactions, constructs identities, and reflects cultural norms. Discourse analysis facilitates uncover the underlying meanings, ideologies, and energy dynamics embedded in language.
- Media and Communication : Discourse analysis is applied in media and conversation research to have a look at media representations, discursive practices, and ideological frameworks. Researchers conduct discourse analysis to analyze media texts, information coverage, and political speeches, exploring how language constructs and disseminates social meanings and values. Discourse analysis informs media literacy efforts, media grievance, and media coverage debates.
- Political Science : Discourse analysis is applied in political science to look at political rhetoric, public discourse, and policymaking tactics. Researchers behavior discourse analysis to research political speeches, party manifestos, and coverage files, analyzing how language constructs political identities, legitimizes authority, and shapes public opinion. Discourse analysis informs political verbal exchange techniques, political campaigning, and policy advocacy.
Grounded theory analysis is an inductive studies approach used to broaden theories or causes based on empirical data. It includes systematically studying qualitative information to perceive ideas, categories, and relationships that emerge from the statistics itself, rather than testing preconceived hypotheses. Researchers have interaction in a procedure of constant assessment and theoretical sampling to refine and increase theoretical insights.
Grounded theory analysis is hired whilst researchers are seeking for to find styles, relationships, and tactics that emerge from the records itself, with out implementing preconceived hypotheses or theoretical assumptions.
When to use Grounded Theory Analysis?
Grounded concept analysis is applied throughout various disciplines and studies contexts, such as:
- Social Sciences Research : Grounded Theory Analysis is significantly used in sociology, anthropology, psychology, and related disciplines to discover diverse social phenomena together with organization dynamics, social interactions, cultural practices, and societal structures.
- Healthcare Research : In healthcare, Grounded Theory can be implemented to apprehend affected person reviews, healthcare provider-patient interactions, healthcare delivery procedures, and the impact of healthcare guidelines on individuals and communities.
- Organizational Studies : Researchers use Grounded Theory to examine organizational conduct, leadership, place of work subculture, and worker dynamics. It enables in knowledge how groups function and the way they may be advanced.
- Educational Research : In training, Grounded Theory Analysis can be used to discover teaching and getting to know processes, scholar studies, educational regulations, and the effectiveness of educational interventions.
Text analysis involves examining written or verbal communique to extract meaningful insights or styles. It encompasses numerous techniques which includes sentiment analysis, subject matter modeling, and keyword extraction. For instance, in a have a look at on patron opinions of a eating place, textual content analysis is probably used to become aware of established topics along with food first-class, service enjoy, and atmosphere. Key additives and strategies worried in text analysis:
- Sentiment Analysis : This approach includes determining the sentiment expressed in a piece of textual content, whether or not it is high quality, bad, or impartial. Sentiment analysis algorithms use natural language processing (NLP) to analyze the words, phrases, and context within the text to deduce the overall sentiment. For instance, in customer reviews of a eating place, sentiment analysis could be used to gauge purchaser delight levels based totally on the emotions expressed within the critiques.
- Topic Modeling : Topic modeling is a statistical technique used to become aware of the underlying topics or issues present within a group of documents or text statistics. It entails uncovering the latent patterns of co-occurring phrases or terms that constitute awesome topics. Techniques like Latent Dirichlet Allocation (LDA) and Latent Semantic Analysis (LSA) are normally used for topic modeling. In the context of eating place opinions, subject matter modeling should assist identify not unusual subject matters inclusive of meals excellent, provider revel in, cleanliness, etc., across a large corpus of opinions.
- Keyword Extraction : Keyword extraction includes figuring out and extracting the most applicable phrases or phrases from a bit of text that seize its essence or major topics. This technique enables to summarize the important thing content material or subjects mentioned within the textual content. For instance, in eating place analysiss, key-word extraction ought to identify often referred to terms like “scrumptious meals,” “friendly group of workers,” “lengthy wait times,” etc., presenting a quick analysis of customer sentiments and concerns.
When to use Text Analysis?
Text analysis has numerous programs throughout diverse domain names, including:
- Business and Marketing: Analyzing purchaser remarks, sentiment analysis of social media posts, brand monitoring, and market fashion analysis.
- Healthcare: Extracting scientific statistics from scientific notes, analyzing patient comments, and detecting unfavorable drug reactions from textual content information.
- Social Sciences: Studying public discourse, political communique, opinion mining, and discourse analysis in social media.
- Academic Research: Conducting literature analysiss, analyzing studies articles, and identifying rising studies topics and trends.
- Customer Experience : Understanding purchaser sentiments, identifying product or service problems, and improving client satisfaction via text-based totally comments analysis.
Ethnographic analysis involves immersing in a selected cultural or social setting to understand the views, behaviors, and interactions of the human beings within that context. Researchers conduct observations, interviews, and participant observations to gain insights into the culture, practices, and social dynamics of the community under study. It is is suitable when researchers aim to gain an in-depth understanding of a particular cultural or social setting, including the perspectives, behaviors, and interactions of the people within that context. Particularly beneficial for reading complex social phenomena of their natural environment, wherein observations and interactions arise organically.
When to use Ethnographic Analysis?
- Cultural Understanding : Ethnographic analysis is right whilst researchers goal to gain deep insights into the lifestyle, ideals, and social practices of a selected institution or community.
- Behavioral Observation : It is beneficial while researchers want to observe and apprehend the behaviors, interactions, and each day activities of individuals within their natural surroundings.
- Contextual Exploration : Ethnographic analysis is valuable for exploring the context and lived stories of individuals, presenting wealthy, exact descriptions of their social and cultural worlds.
- Complex Social Dynamics: It is suitable whilst analyzing complex social phenomena or phenomena which might be deeply embedded within social contexts, including rituals, traditions, or network dynamics.
- Qualitative Inquiry: Ethnographic analysis is desired while researchers are seeking for to conduct qualitative inquiry targeted on know-how the subjective meanings and perspectives of individuals inside their cultural context.
Ethnographic analysis gives a effective method for analyzing complex social phenomena of their herbal context, offering rich and nuanced insights into the cultural practices, social dynamics, and lived experiences of individuals inside a particular community. However, researchers need to cautiously bear in mind the time commitment, ethical considerations, and potential biases associated with ethnographic studies.
- Clearly Defined Research Question : Ground analysis in a clear and targeted research question. This will manual for information series and preserve you on the right track at some point of analysis.
- Systematic Coding : Develop a coding scheme to categorize facts into significant topics or concepts. Use software gear to assist in organizing and dealing with codes.
- Constant Comparison : Continuously examine new facts with current codes and subject matters to refine interpretations and make sure consistency.
- Triangulation : Validate findings by the use of a couple of records sources, strategies, or researchers to corroborate consequences and beautify credibility.
Refine subject matters and interpretations through engaging in repeated cycles of gathering, coding, and analysis.
Qualitative data analysis techniques are effective means of revealing deep insights and comprehending intricate phenomena in both practice and study. Through the use of rigorous analytical approaches, researchers may convert qualitative data into significant ideas, interpretations, and narratives that further knowledge and support evidence-based decision-making.
Is it possible to mix quantitative and qualitative methodologies for data analysis?
A: In order to triangulate results and get a thorough grasp of study concerns, researchers do, in fact, often use mixed methods techniques.
How can I choose the best approach for analyzing qualitative data for my study?
A: To choose the best approach, take the research topic, the properties of the data, and the theoretical framework into consideration.
What are some tactics I might do to improve the reliability and validity of my qualitative data analysis?
Aim for peer debriefing and member verification to improve validity, and maintain transparency, reflexivity, and methodological coherence throughout the analytic process.
Please Login to comment...
Similar reads.
- Data Analysis
Improve your Coding Skills with Practice
What kind of Experience do you want to share?

An official website of the United States government
The .gov means it’s official. Federal government websites often end in .gov or .mil. Before sharing sensitive information, make sure you’re on a federal government site.
The site is secure. The https:// ensures that you are connecting to the official website and that any information you provide is encrypted and transmitted securely.
- Publications
- Account settings
Preview improvements coming to the PMC website in October 2024. Learn More or Try it out now .
- Advanced Search
- Journal List
- Can J Hosp Pharm
- v.68(3); May-Jun 2015
Qualitative Research: Data Collection, Analysis, and Management
Introduction.
In an earlier paper, 1 we presented an introduction to using qualitative research methods in pharmacy practice. In this article, we review some principles of the collection, analysis, and management of qualitative data to help pharmacists interested in doing research in their practice to continue their learning in this area. Qualitative research can help researchers to access the thoughts and feelings of research participants, which can enable development of an understanding of the meaning that people ascribe to their experiences. Whereas quantitative research methods can be used to determine how many people undertake particular behaviours, qualitative methods can help researchers to understand how and why such behaviours take place. Within the context of pharmacy practice research, qualitative approaches have been used to examine a diverse array of topics, including the perceptions of key stakeholders regarding prescribing by pharmacists and the postgraduation employment experiences of young pharmacists (see “Further Reading” section at the end of this article).
In the previous paper, 1 we outlined 3 commonly used methodologies: ethnography 2 , grounded theory 3 , and phenomenology. 4 Briefly, ethnography involves researchers using direct observation to study participants in their “real life” environment, sometimes over extended periods. Grounded theory and its later modified versions (e.g., Strauss and Corbin 5 ) use face-to-face interviews and interactions such as focus groups to explore a particular research phenomenon and may help in clarifying a less-well-understood problem, situation, or context. Phenomenology shares some features with grounded theory (such as an exploration of participants’ behaviour) and uses similar techniques to collect data, but it focuses on understanding how human beings experience their world. It gives researchers the opportunity to put themselves in another person’s shoes and to understand the subjective experiences of participants. 6 Some researchers use qualitative methodologies but adopt a different standpoint, and an example of this appears in the work of Thurston and others, 7 discussed later in this paper.
Qualitative work requires reflection on the part of researchers, both before and during the research process, as a way of providing context and understanding for readers. When being reflexive, researchers should not try to simply ignore or avoid their own biases (as this would likely be impossible); instead, reflexivity requires researchers to reflect upon and clearly articulate their position and subjectivities (world view, perspectives, biases), so that readers can better understand the filters through which questions were asked, data were gathered and analyzed, and findings were reported. From this perspective, bias and subjectivity are not inherently negative but they are unavoidable; as a result, it is best that they be articulated up-front in a manner that is clear and coherent for readers.
THE PARTICIPANT’S VIEWPOINT
What qualitative study seeks to convey is why people have thoughts and feelings that might affect the way they behave. Such study may occur in any number of contexts, but here, we focus on pharmacy practice and the way people behave with regard to medicines use (e.g., to understand patients’ reasons for nonadherence with medication therapy or to explore physicians’ resistance to pharmacists’ clinical suggestions). As we suggested in our earlier article, 1 an important point about qualitative research is that there is no attempt to generalize the findings to a wider population. Qualitative research is used to gain insights into people’s feelings and thoughts, which may provide the basis for a future stand-alone qualitative study or may help researchers to map out survey instruments for use in a quantitative study. It is also possible to use different types of research in the same study, an approach known as “mixed methods” research, and further reading on this topic may be found at the end of this paper.
The role of the researcher in qualitative research is to attempt to access the thoughts and feelings of study participants. This is not an easy task, as it involves asking people to talk about things that may be very personal to them. Sometimes the experiences being explored are fresh in the participant’s mind, whereas on other occasions reliving past experiences may be difficult. However the data are being collected, a primary responsibility of the researcher is to safeguard participants and their data. Mechanisms for such safeguarding must be clearly articulated to participants and must be approved by a relevant research ethics review board before the research begins. Researchers and practitioners new to qualitative research should seek advice from an experienced qualitative researcher before embarking on their project.
DATA COLLECTION
Whatever philosophical standpoint the researcher is taking and whatever the data collection method (e.g., focus group, one-to-one interviews), the process will involve the generation of large amounts of data. In addition to the variety of study methodologies available, there are also different ways of making a record of what is said and done during an interview or focus group, such as taking handwritten notes or video-recording. If the researcher is audio- or video-recording data collection, then the recordings must be transcribed verbatim before data analysis can begin. As a rough guide, it can take an experienced researcher/transcriber 8 hours to transcribe one 45-minute audio-recorded interview, a process than will generate 20–30 pages of written dialogue.
Many researchers will also maintain a folder of “field notes” to complement audio-taped interviews. Field notes allow the researcher to maintain and comment upon impressions, environmental contexts, behaviours, and nonverbal cues that may not be adequately captured through the audio-recording; they are typically handwritten in a small notebook at the same time the interview takes place. Field notes can provide important context to the interpretation of audio-taped data and can help remind the researcher of situational factors that may be important during data analysis. Such notes need not be formal, but they should be maintained and secured in a similar manner to audio tapes and transcripts, as they contain sensitive information and are relevant to the research. For more information about collecting qualitative data, please see the “Further Reading” section at the end of this paper.
DATA ANALYSIS AND MANAGEMENT
If, as suggested earlier, doing qualitative research is about putting oneself in another person’s shoes and seeing the world from that person’s perspective, the most important part of data analysis and management is to be true to the participants. It is their voices that the researcher is trying to hear, so that they can be interpreted and reported on for others to read and learn from. To illustrate this point, consider the anonymized transcript excerpt presented in Appendix 1 , which is taken from a research interview conducted by one of the authors (J.S.). We refer to this excerpt throughout the remainder of this paper to illustrate how data can be managed, analyzed, and presented.
Interpretation of Data
Interpretation of the data will depend on the theoretical standpoint taken by researchers. For example, the title of the research report by Thurston and others, 7 “Discordant indigenous and provider frames explain challenges in improving access to arthritis care: a qualitative study using constructivist grounded theory,” indicates at least 2 theoretical standpoints. The first is the culture of the indigenous population of Canada and the place of this population in society, and the second is the social constructivist theory used in the constructivist grounded theory method. With regard to the first standpoint, it can be surmised that, to have decided to conduct the research, the researchers must have felt that there was anecdotal evidence of differences in access to arthritis care for patients from indigenous and non-indigenous backgrounds. With regard to the second standpoint, it can be surmised that the researchers used social constructivist theory because it assumes that behaviour is socially constructed; in other words, people do things because of the expectations of those in their personal world or in the wider society in which they live. (Please see the “Further Reading” section for resources providing more information about social constructivist theory and reflexivity.) Thus, these 2 standpoints (and there may have been others relevant to the research of Thurston and others 7 ) will have affected the way in which these researchers interpreted the experiences of the indigenous population participants and those providing their care. Another standpoint is feminist standpoint theory which, among other things, focuses on marginalized groups in society. Such theories are helpful to researchers, as they enable us to think about things from a different perspective. Being aware of the standpoints you are taking in your own research is one of the foundations of qualitative work. Without such awareness, it is easy to slip into interpreting other people’s narratives from your own viewpoint, rather than that of the participants.
To analyze the example in Appendix 1 , we will adopt a phenomenological approach because we want to understand how the participant experienced the illness and we want to try to see the experience from that person’s perspective. It is important for the researcher to reflect upon and articulate his or her starting point for such analysis; for example, in the example, the coder could reflect upon her own experience as a female of a majority ethnocultural group who has lived within middle class and upper middle class settings. This personal history therefore forms the filter through which the data will be examined. This filter does not diminish the quality or significance of the analysis, since every researcher has his or her own filters; however, by explicitly stating and acknowledging what these filters are, the researcher makes it easer for readers to contextualize the work.
Transcribing and Checking
For the purposes of this paper it is assumed that interviews or focus groups have been audio-recorded. As mentioned above, transcribing is an arduous process, even for the most experienced transcribers, but it must be done to convert the spoken word to the written word to facilitate analysis. For anyone new to conducting qualitative research, it is beneficial to transcribe at least one interview and one focus group. It is only by doing this that researchers realize how difficult the task is, and this realization affects their expectations when asking others to transcribe. If the research project has sufficient funding, then a professional transcriber can be hired to do the work. If this is the case, then it is a good idea to sit down with the transcriber, if possible, and talk through the research and what the participants were talking about. This background knowledge for the transcriber is especially important in research in which people are using jargon or medical terms (as in pharmacy practice). Involving your transcriber in this way makes the work both easier and more rewarding, as he or she will feel part of the team. Transcription editing software is also available, but it is expensive. For example, ELAN (more formally known as EUDICO Linguistic Annotator, developed at the Technical University of Berlin) 8 is a tool that can help keep data organized by linking media and data files (particularly valuable if, for example, video-taping of interviews is complemented by transcriptions). It can also be helpful in searching complex data sets. Products such as ELAN do not actually automatically transcribe interviews or complete analyses, and they do require some time and effort to learn; nonetheless, for some research applications, it may be a valuable to consider such software tools.
All audio recordings should be transcribed verbatim, regardless of how intelligible the transcript may be when it is read back. Lines of text should be numbered. Once the transcription is complete, the researcher should read it while listening to the recording and do the following: correct any spelling or other errors; anonymize the transcript so that the participant cannot be identified from anything that is said (e.g., names, places, significant events); insert notations for pauses, laughter, looks of discomfort; insert any punctuation, such as commas and full stops (periods) (see Appendix 1 for examples of inserted punctuation), and include any other contextual information that might have affected the participant (e.g., temperature or comfort of the room).
Dealing with the transcription of a focus group is slightly more difficult, as multiple voices are involved. One way of transcribing such data is to “tag” each voice (e.g., Voice A, Voice B). In addition, the focus group will usually have 2 facilitators, whose respective roles will help in making sense of the data. While one facilitator guides participants through the topic, the other can make notes about context and group dynamics. More information about group dynamics and focus groups can be found in resources listed in the “Further Reading” section.
Reading between the Lines
During the process outlined above, the researcher can begin to get a feel for the participant’s experience of the phenomenon in question and can start to think about things that could be pursued in subsequent interviews or focus groups (if appropriate). In this way, one participant’s narrative informs the next, and the researcher can continue to interview until nothing new is being heard or, as it says in the text books, “saturation is reached”. While continuing with the processes of coding and theming (described in the next 2 sections), it is important to consider not just what the person is saying but also what they are not saying. For example, is a lengthy pause an indication that the participant is finding the subject difficult, or is the person simply deciding what to say? The aim of the whole process from data collection to presentation is to tell the participants’ stories using exemplars from their own narratives, thus grounding the research findings in the participants’ lived experiences.
Smith 9 suggested a qualitative research method known as interpretative phenomenological analysis, which has 2 basic tenets: first, that it is rooted in phenomenology, attempting to understand the meaning that individuals ascribe to their lived experiences, and second, that the researcher must attempt to interpret this meaning in the context of the research. That the researcher has some knowledge and expertise in the subject of the research means that he or she can have considerable scope in interpreting the participant’s experiences. Larkin and others 10 discussed the importance of not just providing a description of what participants say. Rather, interpretative phenomenological analysis is about getting underneath what a person is saying to try to truly understand the world from his or her perspective.
Once all of the research interviews have been transcribed and checked, it is time to begin coding. Field notes compiled during an interview can be a useful complementary source of information to facilitate this process, as the gap in time between an interview, transcribing, and coding can result in memory bias regarding nonverbal or environmental context issues that may affect interpretation of data.
Coding refers to the identification of topics, issues, similarities, and differences that are revealed through the participants’ narratives and interpreted by the researcher. This process enables the researcher to begin to understand the world from each participant’s perspective. Coding can be done by hand on a hard copy of the transcript, by making notes in the margin or by highlighting and naming sections of text. More commonly, researchers use qualitative research software (e.g., NVivo, QSR International Pty Ltd; www.qsrinternational.com/products_nvivo.aspx ) to help manage their transcriptions. It is advised that researchers undertake a formal course in the use of such software or seek supervision from a researcher experienced in these tools.
Returning to Appendix 1 and reading from lines 8–11, a code for this section might be “diagnosis of mental health condition”, but this would just be a description of what the participant is talking about at that point. If we read a little more deeply, we can ask ourselves how the participant might have come to feel that the doctor assumed he or she was aware of the diagnosis or indeed that they had only just been told the diagnosis. There are a number of pauses in the narrative that might suggest the participant is finding it difficult to recall that experience. Later in the text, the participant says “nobody asked me any questions about my life” (line 19). This could be coded simply as “health care professionals’ consultation skills”, but that would not reflect how the participant must have felt never to be asked anything about his or her personal life, about the participant as a human being. At the end of this excerpt, the participant just trails off, recalling that no-one showed any interest, which makes for very moving reading. For practitioners in pharmacy, it might also be pertinent to explore the participant’s experience of akathisia and why this was left untreated for 20 years.
One of the questions that arises about qualitative research relates to the reliability of the interpretation and representation of the participants’ narratives. There are no statistical tests that can be used to check reliability and validity as there are in quantitative research. However, work by Lincoln and Guba 11 suggests that there are other ways to “establish confidence in the ‘truth’ of the findings” (p. 218). They call this confidence “trustworthiness” and suggest that there are 4 criteria of trustworthiness: credibility (confidence in the “truth” of the findings), transferability (showing that the findings have applicability in other contexts), dependability (showing that the findings are consistent and could be repeated), and confirmability (the extent to which the findings of a study are shaped by the respondents and not researcher bias, motivation, or interest).
One way of establishing the “credibility” of the coding is to ask another researcher to code the same transcript and then to discuss any similarities and differences in the 2 resulting sets of codes. This simple act can result in revisions to the codes and can help to clarify and confirm the research findings.
Theming refers to the drawing together of codes from one or more transcripts to present the findings of qualitative research in a coherent and meaningful way. For example, there may be examples across participants’ narratives of the way in which they were treated in hospital, such as “not being listened to” or “lack of interest in personal experiences” (see Appendix 1 ). These may be drawn together as a theme running through the narratives that could be named “the patient’s experience of hospital care”. The importance of going through this process is that at its conclusion, it will be possible to present the data from the interviews using quotations from the individual transcripts to illustrate the source of the researchers’ interpretations. Thus, when the findings are organized for presentation, each theme can become the heading of a section in the report or presentation. Underneath each theme will be the codes, examples from the transcripts, and the researcher’s own interpretation of what the themes mean. Implications for real life (e.g., the treatment of people with chronic mental health problems) should also be given.
DATA SYNTHESIS
In this final section of this paper, we describe some ways of drawing together or “synthesizing” research findings to represent, as faithfully as possible, the meaning that participants ascribe to their life experiences. This synthesis is the aim of the final stage of qualitative research. For most readers, the synthesis of data presented by the researcher is of crucial significance—this is usually where “the story” of the participants can be distilled, summarized, and told in a manner that is both respectful to those participants and meaningful to readers. There are a number of ways in which researchers can synthesize and present their findings, but any conclusions drawn by the researchers must be supported by direct quotations from the participants. In this way, it is made clear to the reader that the themes under discussion have emerged from the participants’ interviews and not the mind of the researcher. The work of Latif and others 12 gives an example of how qualitative research findings might be presented.
Planning and Writing the Report
As has been suggested above, if researchers code and theme their material appropriately, they will naturally find the headings for sections of their report. Qualitative researchers tend to report “findings” rather than “results”, as the latter term typically implies that the data have come from a quantitative source. The final presentation of the research will usually be in the form of a report or a paper and so should follow accepted academic guidelines. In particular, the article should begin with an introduction, including a literature review and rationale for the research. There should be a section on the chosen methodology and a brief discussion about why qualitative methodology was most appropriate for the study question and why one particular methodology (e.g., interpretative phenomenological analysis rather than grounded theory) was selected to guide the research. The method itself should then be described, including ethics approval, choice of participants, mode of recruitment, and method of data collection (e.g., semistructured interviews or focus groups), followed by the research findings, which will be the main body of the report or paper. The findings should be written as if a story is being told; as such, it is not necessary to have a lengthy discussion section at the end. This is because much of the discussion will take place around the participants’ quotes, such that all that is needed to close the report or paper is a summary, limitations of the research, and the implications that the research has for practice. As stated earlier, it is not the intention of qualitative research to allow the findings to be generalized, and therefore this is not, in itself, a limitation.
Planning out the way that findings are to be presented is helpful. It is useful to insert the headings of the sections (the themes) and then make a note of the codes that exemplify the thoughts and feelings of your participants. It is generally advisable to put in the quotations that you want to use for each theme, using each quotation only once. After all this is done, the telling of the story can begin as you give your voice to the experiences of the participants, writing around their quotations. Do not be afraid to draw assumptions from the participants’ narratives, as this is necessary to give an in-depth account of the phenomena in question. Discuss these assumptions, drawing on your participants’ words to support you as you move from one code to another and from one theme to the next. Finally, as appropriate, it is possible to include examples from literature or policy documents that add support for your findings. As an exercise, you may wish to code and theme the sample excerpt in Appendix 1 and tell the participant’s story in your own way. Further reading about “doing” qualitative research can be found at the end of this paper.
CONCLUSIONS
Qualitative research can help researchers to access the thoughts and feelings of research participants, which can enable development of an understanding of the meaning that people ascribe to their experiences. It can be used in pharmacy practice research to explore how patients feel about their health and their treatment. Qualitative research has been used by pharmacists to explore a variety of questions and problems (see the “Further Reading” section for examples). An understanding of these issues can help pharmacists and other health care professionals to tailor health care to match the individual needs of patients and to develop a concordant relationship. Doing qualitative research is not easy and may require a complete rethink of how research is conducted, particularly for researchers who are more familiar with quantitative approaches. There are many ways of conducting qualitative research, and this paper has covered some of the practical issues regarding data collection, analysis, and management. Further reading around the subject will be essential to truly understand this method of accessing peoples’ thoughts and feelings to enable researchers to tell participants’ stories.
Appendix 1. Excerpt from a sample transcript
The participant (age late 50s) had suffered from a chronic mental health illness for 30 years. The participant had become a “revolving door patient,” someone who is frequently in and out of hospital. As the participant talked about past experiences, the researcher asked:
- What was treatment like 30 years ago?
- Umm—well it was pretty much they could do what they wanted with you because I was put into the er, the er kind of system er, I was just on
- endless section threes.
- Really…
- But what I didn’t realize until later was that if you haven’t actually posed a threat to someone or yourself they can’t really do that but I didn’t know
- that. So wh-when I first went into hospital they put me on the forensic ward ’cause they said, “We don’t think you’ll stay here we think you’ll just
- run-run away.” So they put me then onto the acute admissions ward and – er – I can remember one of the first things I recall when I got onto that
- ward was sitting down with a er a Dr XXX. He had a book this thick [gestures] and on each page it was like three questions and he went through
- all these questions and I answered all these questions. So we’re there for I don’t maybe two hours doing all that and he asked me he said “well
- when did somebody tell you then that you have schizophrenia” I said “well nobody’s told me that” so he seemed very surprised but nobody had
- actually [pause] whe-when I first went up there under police escort erm the senior kind of consultants people I’d been to where I was staying and
- ermm so er [pause] I . . . the, I can remember the very first night that I was there and given this injection in this muscle here [gestures] and just
- having dreadful side effects the next day I woke up [pause]
- . . . and I suffered that akathesia I swear to you, every minute of every day for about 20 years.
- Oh how awful.
- And that side of it just makes life impossible so the care on the wards [pause] umm I don’t know it’s kind of, it’s kind of hard to put into words
- [pause]. Because I’m not saying they were sort of like not friendly or interested but then nobody ever seemed to want to talk about your life [pause]
- nobody asked me any questions about my life. The only questions that came into was they asked me if I’d be a volunteer for these student exams
- and things and I said “yeah” so all the questions were like “oh what jobs have you done,” er about your relationships and things and er but
- nobody actually sat down and had a talk and showed some interest in you as a person you were just there basically [pause] um labelled and you
- know there was there was [pause] but umm [pause] yeah . . .
This article is the 10th in the CJHP Research Primer Series, an initiative of the CJHP Editorial Board and the CSHP Research Committee. The planned 2-year series is intended to appeal to relatively inexperienced researchers, with the goal of building research capacity among practising pharmacists. The articles, presenting simple but rigorous guidance to encourage and support novice researchers, are being solicited from authors with appropriate expertise.
Previous articles in this series:
Bond CM. The research jigsaw: how to get started. Can J Hosp Pharm . 2014;67(1):28–30.
Tully MP. Research: articulating questions, generating hypotheses, and choosing study designs. Can J Hosp Pharm . 2014;67(1):31–4.
Loewen P. Ethical issues in pharmacy practice research: an introductory guide. Can J Hosp Pharm. 2014;67(2):133–7.
Tsuyuki RT. Designing pharmacy practice research trials. Can J Hosp Pharm . 2014;67(3):226–9.
Bresee LC. An introduction to developing surveys for pharmacy practice research. Can J Hosp Pharm . 2014;67(4):286–91.
Gamble JM. An introduction to the fundamentals of cohort and case–control studies. Can J Hosp Pharm . 2014;67(5):366–72.
Austin Z, Sutton J. Qualitative research: getting started. C an J Hosp Pharm . 2014;67(6):436–40.
Houle S. An introduction to the fundamentals of randomized controlled trials in pharmacy research. Can J Hosp Pharm . 2014; 68(1):28–32.
Charrois TL. Systematic reviews: What do you need to know to get started? Can J Hosp Pharm . 2014;68(2):144–8.
Competing interests: None declared.
Further Reading
Examples of qualitative research in pharmacy practice.
- Farrell B, Pottie K, Woodend K, Yao V, Dolovich L, Kennie N, et al. Shifts in expectations: evaluating physicians’ perceptions as pharmacists integrated into family practice. J Interprof Care. 2010; 24 (1):80–9. [ PubMed ] [ Google Scholar ]
- Gregory P, Austin Z. Postgraduation employment experiences of new pharmacists in Ontario in 2012–2013. Can Pharm J. 2014; 147 (5):290–9. [ PMC free article ] [ PubMed ] [ Google Scholar ]
- Marks PZ, Jennnings B, Farrell B, Kennie-Kaulbach N, Jorgenson D, Pearson-Sharpe J, et al. “I gained a skill and a change in attitude”: a case study describing how an online continuing professional education course for pharmacists supported achievement of its transfer to practice outcomes. Can J Univ Contin Educ. 2014; 40 (2):1–18. [ Google Scholar ]
- Nair KM, Dolovich L, Brazil K, Raina P. It’s all about relationships: a qualitative study of health researchers’ perspectives on interdisciplinary research. BMC Health Serv Res. 2008; 8 :110. [ PMC free article ] [ PubMed ] [ Google Scholar ]
- Pojskic N, MacKeigan L, Boon H, Austin Z. Initial perceptions of key stakeholders in Ontario regarding independent prescriptive authority for pharmacists. Res Soc Adm Pharm. 2014; 10 (2):341–54. [ PubMed ] [ Google Scholar ]
Qualitative Research in General
- Breakwell GM, Hammond S, Fife-Schaw C. Research methods in psychology. Thousand Oaks (CA): Sage Publications; 1995. [ Google Scholar ]
- Given LM. 100 questions (and answers) about qualitative research. Thousand Oaks (CA): Sage Publications; 2015. [ Google Scholar ]
- Miles B, Huberman AM. Qualitative data analysis. Thousand Oaks (CA): Sage Publications; 2009. [ Google Scholar ]
- Patton M. Qualitative research and evaluation methods. Thousand Oaks (CA): Sage Publications; 2002. [ Google Scholar ]
- Willig C. Introducing qualitative research in psychology. Buckingham (UK): Open University Press; 2001. [ Google Scholar ]
Group Dynamics in Focus Groups
- Farnsworth J, Boon B. Analysing group dynamics within the focus group. Qual Res. 2010; 10 (5):605–24. [ Google Scholar ]
Social Constructivism
- Social constructivism. Berkeley (CA): University of California, Berkeley, Berkeley Graduate Division, Graduate Student Instruction Teaching & Resource Center; [cited 2015 June 4]. Available from: http://gsi.berkeley.edu/gsi-guide-contents/learning-theory-research/social-constructivism/ [ Google Scholar ]
Mixed Methods
- Creswell J. Research design: qualitative, quantitative, and mixed methods approaches. Thousand Oaks (CA): Sage Publications; 2009. [ Google Scholar ]
Collecting Qualitative Data
- Arksey H, Knight P. Interviewing for social scientists: an introductory resource with examples. Thousand Oaks (CA): Sage Publications; 1999. [ Google Scholar ]
- Guest G, Namey EE, Mitchel ML. Collecting qualitative data: a field manual for applied research. Thousand Oaks (CA): Sage Publications; 2013. [ Google Scholar ]
Constructivist Grounded Theory
- Charmaz K. Grounded theory: objectivist and constructivist methods. In: Denzin N, Lincoln Y, editors. Handbook of qualitative research. 2nd ed. Thousand Oaks (CA): Sage Publications; 2000. pp. 509–35. [ Google Scholar ]

CRO Platform
Test your insights. Run experiments. Win. Or learn. And then win.

eCommerce Customer Analytics Platform

Acquisition matters. But retention matters more. Understand, monitor & nurture the best customers.
- Case Studies
- Ebooks, Tools, Templates
- Digital Marketing Glossary
- eCommerce Growth Stories
- eCommerce Growth Show
- Help & Technical Documentation
CRO Guide > Chapter 3.1
Qualitative Research: Definition, Methodology, Limitation & Examples
Qualitative research is a method focused on understanding human behavior and experiences through non-numerical data. Examples of qualitative research include:
- One-on-one interviews,
- Focus groups, Ethnographic research,
- Case studies,
- Record keeping,
- Qualitative observations
In this article, we’ll provide tips and tricks on how to use qualitative research to better understand your audience through real world examples and improve your ROI. We’ll also learn the difference between qualitative and quantitative data.

Table of Contents
Marketers often seek to understand their customers deeply. Qualitative research methods such as face-to-face interviews, focus groups, and qualitative observations can provide valuable insights into your products, your market, and your customers’ opinions and motivations. Understanding these nuances can significantly enhance marketing strategies and overall customer satisfaction.
What is Qualitative Research
Qualitative research is a market research method that focuses on obtaining data through open-ended and conversational communication. This method focuses on the “why” rather than the “what” people think about you. Thus, qualitative research seeks to uncover the underlying motivations, attitudes, and beliefs that drive people’s actions.
Let’s say you have an online shop catering to a general audience. You do a demographic analysis and you find out that most of your customers are male. Naturally, you will want to find out why women are not buying from you. And that’s what qualitative research will help you find out.
In the case of your online shop, qualitative research would involve reaching out to female non-customers through methods such as in-depth interviews or focus groups. These interactions provide a platform for women to express their thoughts, feelings, and concerns regarding your products or brand. Through qualitative analysis, you can uncover valuable insights into factors such as product preferences, user experience, brand perception, and barriers to purchase.
Types of Qualitative Research Methods
Qualitative research methods are designed in a manner that helps reveal the behavior and perception of a target audience regarding a particular topic.
The most frequently used qualitative analysis methods are one-on-one interviews, focus groups, ethnographic research, case study research, record keeping, and qualitative observation.
1. One-on-one interviews
Conducting one-on-one interviews is one of the most common qualitative research methods. One of the advantages of this method is that it provides a great opportunity to gather precise data about what people think and their motivations.
Spending time talking to customers not only helps marketers understand who their clients are, but also helps with customer care: clients love hearing from brands. This strengthens the relationship between a brand and its clients and paves the way for customer testimonials.
- A company might conduct interviews to understand why a product failed to meet sales expectations.
- A researcher might use interviews to gather personal stories about experiences with healthcare.
These interviews can be performed face-to-face or on the phone and usually last between half an hour to over two hours.
When a one-on-one interview is conducted face-to-face, it also gives the marketer the opportunity to read the body language of the respondent and match the responses.
2. Focus groups
Focus groups gather a small number of people to discuss and provide feedback on a particular subject. The ideal size of a focus group is usually between five and eight participants. The size of focus groups should reflect the participants’ familiarity with the topic. For less important topics or when participants have little experience, a group of 10 can be effective. For more critical topics or when participants are more knowledgeable, a smaller group of five to six is preferable for deeper discussions.
The main goal of a focus group is to find answers to the “why”, “what”, and “how” questions. This method is highly effective in exploring people’s feelings and ideas in a social setting, where group dynamics can bring out insights that might not emerge in one-on-one situations.
- A focus group could be used to test reactions to a new product concept.
- Marketers might use focus groups to see how different demographic groups react to an advertising campaign.
One advantage that focus groups have is that the marketer doesn’t necessarily have to interact with the group in person. Nowadays focus groups can be sent as online qualitative surveys on various devices.
Focus groups are an expensive option compared to the other qualitative research methods, which is why they are typically used to explain complex processes.
3. Ethnographic research
Ethnographic research is the most in-depth observational method that studies individuals in their naturally occurring environment.
This method aims at understanding the cultures, challenges, motivations, and settings that occur.
- A study of workplace culture within a tech startup.
- Observational research in a remote village to understand local traditions.
Ethnographic research requires the marketer to adapt to the target audiences’ environments (a different organization, a different city, or even a remote location), which is why geographical constraints can be an issue while collecting data.
This type of research can last from a few days to a few years. It’s challenging and time-consuming and solely depends on the expertise of the marketer to be able to analyze, observe, and infer the data.
4. Case study research
The case study method has grown into a valuable qualitative research method. This type of research method is usually used in education or social sciences. It involves a comprehensive examination of a single instance or event, providing detailed insights into complex issues in real-life contexts.
- Analyzing a single school’s innovative teaching method.
- A detailed study of a patient’s medical treatment over several years.
Case study research may seem difficult to operate, but it’s actually one of the simplest ways of conducting research as it involves a deep dive and thorough understanding of the data collection methods and inferring the data.
5. Record keeping
Record keeping is similar to going to the library: you go over books or any other reference material to collect relevant data. This method uses already existing reliable documents and similar sources of information as a data source.
- Historical research using old newspapers and letters.
- A study on policy changes over the years by examining government records.
This method is useful for constructing a historical context around a research topic or verifying other findings with documented evidence.
6. Qualitative observation
Qualitative observation is a method that uses subjective methodologies to gather systematic information or data. This method deals with the five major sensory organs and their functioning, sight, smell, touch, taste, and hearing.
- Sight : Observing the way customers visually interact with product displays in a store to understand their browsing behaviors and preferences.
- Smell : Noting reactions of consumers to different scents in a fragrance shop to study the impact of olfactory elements on product preference.
- Touch : Watching how individuals interact with different materials in a clothing store to assess the importance of texture in fabric selection.
- Taste : Evaluating reactions of participants in a taste test to identify flavor profiles that appeal to different demographic groups.
- Hearing : Documenting responses to changes in background music within a retail environment to determine its effect on shopping behavior and mood.
Below we are also providing real-life examples of qualitative research that demonstrate practical applications across various contexts:
Qualitative Research Real World Examples
Let’s explore some examples of how qualitative research can be applied in different contexts.
1. Online grocery shop with a predominantly male audience
Method used: one-on-one interviews.
Let’s go back to one of the previous examples. You have an online grocery shop. By nature, it addresses a general audience, but after you do a demographic analysis you find out that most of your customers are male.
One good method to determine why women are not buying from you is to hold one-on-one interviews with potential customers in the category.
Interviewing a sample of potential female customers should reveal why they don’t find your store appealing. The reasons could range from not stocking enough products for women to perhaps the store’s emphasis on heavy-duty tools and automotive products, for example. These insights can guide adjustments in inventory and marketing strategies.
2. Software company launching a new product
Method used: focus groups.
Focus groups are great for establishing product-market fit.
Let’s assume you are a software company that wants to launch a new product and you hold a focus group with 12 people. Although getting their feedback regarding users’ experience with the product is a good thing, this sample is too small to define how the entire market will react to your product.
So what you can do instead is holding multiple focus groups in 20 different geographic regions. Each region should be hosting a group of 12 for each market segment; you can even segment your audience based on age. This would be a better way to establish credibility in the feedback you receive.
3. Alan Pushkin’s “God’s Choice: The Total World of a Fundamentalist Christian School”
Method used: ethnographic research.
Moving from a fictional example to a real-life one, let’s analyze Alan Peshkin’s 1986 book “God’s Choice: The Total World of a Fundamentalist Christian School”.
Peshkin studied the culture of Bethany Baptist Academy by interviewing the students, parents, teachers, and members of the community alike, and spending eighteen months observing them to provide a comprehensive and in-depth analysis of Christian schooling as an alternative to public education.
The study highlights the school’s unified purpose, rigorous academic environment, and strong community support while also pointing out its lack of cultural diversity and openness to differing viewpoints. These insights are crucial for understanding how such educational settings operate and what they offer to students.
Even after discovering all this, Peshkin still presented the school in a positive light and stated that public schools have much to learn from such schools.
Peshkin’s in-depth research represents a qualitative study that uses observations and unstructured interviews, without any assumptions or hypotheses. He utilizes descriptive or non-quantifiable data on Bethany Baptist Academy specifically, without attempting to generalize the findings to other Christian schools.
4. Understanding buyers’ trends
Method used: record keeping.
Another way marketers can use quality research is to understand buyers’ trends. To do this, marketers need to look at historical data for both their company and their industry and identify where buyers are purchasing items in higher volumes.
For example, electronics distributors know that the holiday season is a peak market for sales while life insurance agents find that spring and summer wedding months are good seasons for targeting new clients.
5. Determining products/services missing from the market
Conducting your own research isn’t always necessary. If there are significant breakthroughs in your industry, you can use industry data and adapt it to your marketing needs.
The influx of hacking and hijacking of cloud-based information has made Internet security a topic of many industry reports lately. A software company could use these reports to better understand the problems its clients are facing.
As a result, the company can provide solutions prospects already know they need.
Real-time Customer Lifetime Value (CLV) Benchmark Report
See where your business stands compared to 1,000+ e-stores in different industries.

Qualitative Research Approaches
Once the marketer has decided that their research questions will provide data that is qualitative in nature, the next step is to choose the appropriate qualitative approach.
The approach chosen will take into account the purpose of the research, the role of the researcher, the data collected, the method of data analysis , and how the results will be presented. The most common approaches include:
- Narrative : This method focuses on individual life stories to understand personal experiences and journeys. It examines how people structure their stories and the themes within them to explore human existence. For example, a narrative study might look at cancer survivors to understand their resilience and coping strategies.
- Phenomenology : attempts to understand or explain life experiences or phenomena; It aims to reveal the depth of human consciousness and perception, such as by studying the daily lives of those with chronic illnesses.
- Grounded theory : investigates the process, action, or interaction with the goal of developing a theory “grounded” in observations and empirical data.
- Ethnography : describes and interprets an ethnic, cultural, or social group;
- Case study : examines episodic events in a definable framework, develops in-depth analyses of single or multiple cases, and generally explains “how”. An example might be studying a community health program to evaluate its success and impact.
How to Analyze Qualitative Data
Analyzing qualitative data involves interpreting non-numerical data to uncover patterns, themes, and deeper insights. This process is typically more subjective and requires a systematic approach to ensure reliability and validity.
1. Data Collection
Ensure that your data collection methods (e.g., interviews, focus groups, observations) are well-documented and comprehensive. This step is crucial because the quality and depth of the data collected will significantly influence the analysis.
2. Data Preparation
Once collected, the data needs to be organized. Transcribe audio and video recordings, and gather all notes and documents. Ensure that all data is anonymized to protect participant confidentiality where necessary.
3. Familiarization
Immerse yourself in the data by reading through the materials multiple times. This helps you get a general sense of the information and begin identifying patterns or recurring themes.
Develop a coding system to tag data with labels that summarize and account for each piece of information. Codes can be words, phrases, or acronyms that represent how these segments relate to your research questions.
- Descriptive Coding : Summarize the primary topic of the data.
- In Vivo Coding : Use language and terms used by the participants themselves.
- Process Coding : Use gerunds (“-ing” words) to label the processes at play.
- Emotion Coding : Identify and record the emotions conveyed or experienced.
5. Thematic Development
Group codes into themes that represent larger patterns in the data. These themes should relate directly to the research questions and form a coherent narrative about the findings.
6. Interpreting the Data
Interpret the data by constructing a logical narrative. This involves piecing together the themes to explain larger insights about the data. Link the results back to your research objectives and existing literature to bolster your interpretations.
7. Validation
Check the reliability and validity of your findings by reviewing if the interpretations are supported by the data. This may involve revisiting the data multiple times or discussing the findings with colleagues or participants for validation.
8. Reporting
Finally, present the findings in a clear and organized manner. Use direct quotes and detailed descriptions to illustrate the themes and insights. The report should communicate the narrative you’ve built from your data, clearly linking your findings to your research questions.
Limitations of qualitative research
The disadvantages of qualitative research are quite unique. The techniques of the data collector and their own unique observations can alter the information in subtle ways. That being said, these are the qualitative research’s limitations:
1. It’s a time-consuming process
The main drawback of qualitative study is that the process is time-consuming. Another problem is that the interpretations are limited. Personal experience and knowledge influence observations and conclusions.
Thus, qualitative research might take several weeks or months. Also, since this process delves into personal interaction for data collection, discussions often tend to deviate from the main issue to be studied.
2. You can’t verify the results of qualitative research
Because qualitative research is open-ended, participants have more control over the content of the data collected. So the marketer is not able to verify the results objectively against the scenarios stated by the respondents. For example, in a focus group discussing a new product, participants might express their feelings about the design and functionality. However, these opinions are influenced by individual tastes and experiences, making it difficult to ascertain a universally applicable conclusion from these discussions.
3. It’s a labor-intensive approach
Qualitative research requires a labor-intensive analysis process such as categorization, recording, etc. Similarly, qualitative research requires well-experienced marketers to obtain the needed data from a group of respondents.
4. It’s difficult to investigate causality
Qualitative research requires thoughtful planning to ensure the obtained results are accurate. There is no way to analyze qualitative data mathematically. This type of research is based more on opinion and judgment rather than results. Because all qualitative studies are unique they are difficult to replicate.
5. Qualitative research is not statistically representative
Because qualitative research is a perspective-based method of research, the responses given are not measured.
Comparisons can be made and this can lead toward duplication, but for the most part, quantitative data is required for circumstances that need statistical representation and that is not part of the qualitative research process.
While doing a qualitative study, it’s important to cross-reference the data obtained with the quantitative data. By continuously surveying prospects and customers marketers can build a stronger database of useful information.
Quantitative vs. Qualitative Research

Image source
Quantitative and qualitative research are two distinct methodologies used in the field of market research, each offering unique insights and approaches to understanding consumer behavior and preferences.
As we already defined, qualitative analysis seeks to explore the deeper meanings, perceptions, and motivations behind human behavior through non-numerical data. On the other hand, quantitative research focuses on collecting and analyzing numerical data to identify patterns, trends, and statistical relationships.
Let’s explore their key differences:
Nature of Data:
- Quantitative research : Involves numerical data that can be measured and analyzed statistically.
- Qualitative research : Focuses on non-numerical data, such as words, images, and observations, to capture subjective experiences and meanings.
Research Questions:
- Quantitative research : Typically addresses questions related to “how many,” “how much,” or “to what extent,” aiming to quantify relationships and patterns.
- Qualitative research: Explores questions related to “why” and “how,” aiming to understand the underlying motivations, beliefs, and perceptions of individuals.
Data Collection Methods:
- Quantitative research : Relies on structured surveys, experiments, or observations with predefined variables and measures.
- Qualitative research : Utilizes open-ended interviews, focus groups, participant observations, and textual analysis to gather rich, contextually nuanced data.
Analysis Techniques:
- Quantitative research: Involves statistical analysis to identify correlations, associations, or differences between variables.
- Qualitative research: Employs thematic analysis, coding, and interpretation to uncover patterns, themes, and insights within qualitative data.

Do Conversion Rate Optimization the Right way.
Explore helps you make the most out of your CRO efforts through advanced A/B testing, surveys, advanced segmentation and optimised customer journeys.

If you haven’t subscribed yet to our newsletter, now is your chance!

Like what you’re reading?
Join the informed ecommerce crowd.
We will never bug you with irrelevant info.
By clicking the Button, you confirm that you agree with our Terms and Conditions .
Continue your Conversion Rate Optimization Journey
- Last modified: January 3, 2023
- Conversion Rate Optimization , User Research

Valentin Radu

We’re a team of people that want to empower marketers around the world to create marketing campaigns that matter to consumers in a smart way. Meet us at the intersection of creativity, integrity, and development, and let us show you how to optimize your marketing.
Our Software
- > Book a Demo
- > Partner Program
- > Affiliate Program
- Blog Sitemap
- Terms and Conditions
- Privacy & Security
- Cookies Policy
- REVEAL Terms and Conditions
Qualitative Data Coding
Saul Mcleod, PhD
Editor-in-Chief for Simply Psychology
BSc (Hons) Psychology, MRes, PhD, University of Manchester
Saul Mcleod, PhD., is a qualified psychology teacher with over 18 years of experience in further and higher education. He has been published in peer-reviewed journals, including the Journal of Clinical Psychology.
Learn about our Editorial Process
Olivia Guy-Evans, MSc
Associate Editor for Simply Psychology
BSc (Hons) Psychology, MSc Psychology of Education
Olivia Guy-Evans is a writer and associate editor for Simply Psychology. She has previously worked in healthcare and educational sectors.
Coding is the process of analyzing qualitative data (usually text) by assigning labels (codes) to chunks of data that capture their essence or meaning. It allows you to condense, organize and interpret your data.
A code is a word or brief phrase that captures the essence of why you think a particular bit of data may be useful. A good analogy is that a code describes data like a hashtag describes a tweet.

Coding is an iterative process, with researchers refining and revising their codes as their understanding of the data evolves.
The ultimate goal is to develop a coherent and meaningful coding scheme that captures the richness and complexity of the participants’ experiences and helps answer the research questions.
Step 1: Familiarize yourself with the data
- Read through your data (interview transcripts, field notes, documents, etc.) several times. This process is called immersion.
- Think and reflect on what may be important in the data before making any firm decisions about ideas, or potential patterns.
Step 2: Decide on your coding approach
- Will you use predefined deductive codes (based on theory or prior research), or let codes emerge from the data (inductive coding)?
- Will a piece of data have one code or multiple?
- Will you code everything or selectively? Broader research questions may warrant coding more comprehensively.
If you decide not to code everything, it’s crucial to:
- Have clear criteria for what you will and won’t code
- Be transparent about your selection process in research reports
- Remain open to revisiting uncoded data later in analysis
Step 3: Do a first round of coding
- Go through the data and assign initial codes to chunks that stand out
- Create a code name (a word or short phrase) that captures the essence of each chunk
- Keep a codebook – a list of your codes with descriptions or definitions
- Be open to adding, revising or combining codes as you go
Descriptive codes
- In vivo coding / Semantic coding : This method uses words or short phrases directly from the participant’s own language as codes. It deals with the surface-level content, labeling what participants directly say or describe. It identifies keywords, phrases, or sentences that capture the literal content. Participant : “I was just so overwhelmed with everything.” Code : “overwhelmed”
- Process coding : Uses gerunds (“-ing” words) to connote observable or conceptual action in the data. Participant : “I started by brainstorming ideas, then I narrowed them down.” Codes : “brainstorming ideas,” “narrowing down”
- Open coding : A form of initial coding where the researcher remains open to any possible theoretical directions indicated by the data. Participant : “I found the class really challenging, but I learned a lot.” Codes : “challenging class,” “learning experience”
- Descriptive coding : Summarizes the primary topic of a passage in a word or short phrase. Participant : “I usually study in the library because it’s quiet.” Code : “study environment”
Step 4: Review and refine codes
- Look over your initial codes and see if any can be combined, split up, or revised
- Ensure your code names clearly convey the meaning of the data
- Check if your codes are applied consistently across the dataset
- Get a second opinion from a peer or advisor if possible
Interpretive codes
Interpretive codes go beyond simple description and reflect the researcher’s understanding of the underlying meanings, experiences, or processes captured in the data.
These codes require the researcher to interpret the participants’ words and actions in light of the research questions and theoretical framework.
For example, latent coding is a type of interpretive coding which goes beyond surface meaning in data. It digs for underlying emotions, motivations, or unspoken ideas the participant might not explicitly state
Latent coding looks for subtext, interprets the “why” behind what’s said, and considers the context (e.g. cultural influences, or unconscious biases).
- Example: A participant might say, “Whenever I see a spider, I feel like I’m going to pass out. It takes me back to a bad experience as a kid.” A latent code here could be “Feelings of Panic Triggered by Spiders” because it goes beyond the surface fear and explores the emotional response and potential cause.
It’s useful to ask yourself the following questions:
- What are the assumptions made by the participants?
- What emotions or feelings are expressed or implied in the data?
- How do participants relate to or interact with others in the data?
- How do the participants’ experiences or perspectives change over time?
- What is surprising, unexpected, or contradictory in the data?
- What is not being said or shown in the data? What are the silences or absences?
Theoretical codes
Theoretical codes are the most abstract and conceptual type of codes. They are used to link the data to existing theories or to develop new theoretical insights.
Theoretical codes often emerge later in the analysis process, as researchers begin to identify patterns and connections across the descriptive and interpretive codes.
- Structural coding : Applies a content-based phrase to a segment of data that relates to a specific research question. Research question : What motivates students to succeed? Participant : “I want to make my parents proud and be the first in my family to graduate college.” Interpretive Code : “family motivation” Theoretical code : “Social identity theory”
- Value coding : This method codes data according to the participants’ values, attitudes, and beliefs, representing their perspectives or worldviews. Participant : “I believe everyone deserves access to quality healthcare.” Interpretive Code : “healthcare access” (value) Theoretical code : “Distributive justice”
Pattern codes
Pattern coding is often used in the later stages of data analysis, after the researcher has thoroughly familiarized themselves with the data and identified initial descriptive and interpretive codes.
By identifying patterns and relationships across the data, pattern codes help to develop a more coherent and meaningful understanding of the phenomenon and can contribute to theory development or refinement.
For Example
Let’s say a researcher is studying the experiences of new mothers returning to work after maternity leave. They conduct interviews with several participants and initially use descriptive and interpretive codes to analyze the data. Some of these codes might include:
- “Guilt about leaving baby”
- “Struggle to balance work and family”
- “Support from colleagues”
- “Flexible work arrangements”
- “Breastfeeding challenges”
As the researcher reviews the coded data, they may notice that several of these codes relate to the broader theme of “work-family conflict.”
They might create a pattern code called “Navigating work-family conflict” that pulls together the various experiences and challenges described by the participants.

Related Articles

Research Methodology
What Is a Focus Group?

Cross-Cultural Research Methodology In Psychology

What Is Internal Validity In Research?

Research Methodology , Statistics
What Is Face Validity In Research? Importance & How To Measure

Criterion Validity: Definition & Examples

Convergent Validity: Definition and Examples
Cookie consent
We use our own and third-party cookies to show you more relevant content based on your browsing and navigation history. Please accept or manage your cookie settings below. Here's our cookie policy

- Form Builder Signups and orders
- Survey maker Research and feedback
- Quiz Maker Trivia and product match
- Find Customers Generate more leads
- Get Feedback Discover ways to improve
- Do research Uncover trends and ideas
- Marketers Forms for marketing teams
- Product Forms for product teams
- HR Forms for HR teams
- Customer success Forms for customer success teams
- Business Forms for general business
- Form templates
- Survey templates
- Quiz templates
- Poll templates
- Order forms
- Feedback forms
- Satisfaction surveys
- Application forms
- Feedback surveys
- Evaluation forms
- Request forms
- Signup forms
- Business surveys
- Marketing surveys
- Report forms
- Customer feedback form
- Registration form
- Branding questionnaire
- 360 feedback
- Lead generation
- Contact form
- Signup sheet
- Help center Find quick answers
- Contact us Speak to someone
- Our blog Get inspired
- Our community Share and learn
- Our guides Tips and how-to
- Updates News and announcements
- Brand Our guidelines
- Partners Browse or join
- Careers Join our team
- → Opinions & Expertise
- → How to analyze survey data: Survey da...
How to analyze survey data: Survey data analysis best practices
Survey data analysis involves reviewing raw materials and transforming them into key insights. Learn how to analyze survey data and best practices here.

Latest posts on Opinions & Expertise
Lydia Kentowski | 05.2024
Typeform | 05.2024
Sheena Fronk | 04.2024
The results are in. You’ve written the questions, found the right people to ask, and got your answers back—now what?
Perfect surveys sent to insightful respondents can become entirely useless if the results aren't coherently and comprehensively analyzed..
So, don’t run and hide.
We know the phrase “survey data analysis” sounds technical and exclusive, but it’s not as scary as it seems. By following a few simple guidelines on how to analyze survey data, you can draw insights from it yourself.
What is survey data analysis?
Survey data analysis is the process of turning survey responses into compelling insights. This includes taking all of your collected data and transforming it into something actionable. Whether it’s open-ended essays, multiple-choice answers, or other questions to ask , you can take this information and uncover patterns and helpful insights.
Some survey data analysis methods include sorting data into categories and using statistical tactics to identify trends and patterns. The goal is to take these raw data responses and turn them into a clear story that answers your research questions to help you make informed decisions.
Getting started with survey data analysis
Before you get started crunching the numbers and performing a survey data analysis, there are a few pieces of information you need to gather.
First, you need to know the number of total respondents. This number will indicate how large your sample is and how much you can rely on your results. It’s always a good idea to gather people’s opinions, but if 5,000 people attended a concert and only five people answered your survey, you can’t really treat those five answers as representative of the whole group.
Secondly, you need to calculate your survey response rate . This is a straightforward percentage—calculate it by dividing the number of responses you received in total by the number of people you asked to fill out the survey. The higher your response rate and the higher your total number of respondents, the more you can trust your survey data to be representative of the sample as a whole.
How to analyze survey data
The first step when analyzing survey data is to turn your individualized responses into aggregated numbers. This sounds complicated, but really, it just means you need to do some counting.
For every question in your survey, you need to know the total number of people who answered with each response. Take a look at this example question:
By aggregating your responses, you're simply counting how many people answered a, b, c, and d, respectively. If 100 people took your survey, the aggregated results would look something like this:
In the last six months: 30
Six months to a year ago: 40
One to two years ago: 20
Over two years ago: 10
Now, if your survey was conducted through a survey host, your online survey results should be aggregated automatically, so there’ll be no need to add the numbers.
Qualitative vs. quantitative data
Once you have all of your aggregated answers, it’s time to start making some sense of the survey data.
Our brains can make sense of percentages much more quickly and easily than whole numbers. It's also far easier to compare different percentages rather than whole numbers.
Say you wrote a survey asking 5-year-olds for their favorite colors. Just saying that 67 children chose red as their favorite color means very little. However, saying that 23% of the children chose red as their favorite color, compared to 50% who chose blue, gives you a much clearer indication of the relative popularity of one color.
If you’ve asked people to write feedback or long-form answers, leave these until the end.
You don’t want the qualitative data to bias your quantitative analysis. Focus on the numbers first, and hopefully, once you have a clear idea of what the sentiment is, the qualitative answers will be able to help you understand why that might be the case.
How to cross-tabulate survey data
Cross-tabulating your data is where you can really begin to draw insights from your survey results instead of just statistics. It can help you add context to your numbers and explore how different groups of people behave or how different factors might affect a single outcome.
When you plan your survey, you'll have considered the different comparisons you'd like to make. For example, maybe you’d like to know if older people are more likely to enjoy eating olives.
Your question might be something like this:

Now, in the first round of your data analysis, you might have already divided the respondents into two groups to work out the split between people who like and don't like eating olives.
So let’s say the results of this olive question were:
Like olives: 542 people (46%)
Dislike olives: 630 people (54%)
To cross-tabulate your data, you’ll need to map another variable onto this one.
We’re interested in whether tastes change with age, so let’s use that age as our second variable and ask:

With these results, you can plug them into a Google Sheet and start to see if there are any correlations:

Imagine you have a client who is looking at marketing their olive brand directly to people under 35. You could ask these two questions and look at the split between olive lovers and haters just within this subgroup and see how it compares to the overall average splits.
Benchmarking survey data
Data means very little to us without context and meaning. Turning your numbers into percentages makes comparisons easier, but although proportionally, we can recognize exactly what 75% means, how can we know if that is good?
The answer is benchmarks.
Setting benchmarks is key to making sense of the data and working out what those percentages really mean.
Some of the most common benchmarking techniques involve comparisons between this survey’s results and the data from the last time the survey was collected. To do this effectively, you need to make sure that you are comparing the results of the same question from each survey .
Setting a benchmark using last year’s data is easy. You simply take the percentage splits of responses to a certain question and treat these as your starting point. Then, you can easily see if this month’s data is above or below that benchmark.
Year-over-year or month-over-month comparisons are an excellent way of tracking progress. They allow you to see whether trends are emerging or how much responses have changed in a given period. This is known as longitudinal analysis.
If this is your first time collecting data, no worries, you can still set some benchmarks. Instead of comparing your results to last month's or last year’s data, you can calculate the overall total split between responses for each question and treat this as your benchmark or baseline.
Once you begin to cross-tabulate and break your respondents down into further categories, you can compare their results to your benchmark to place their statistics in context.
If a value is higher than the average , we can say that this category is over-indexing , and if the value is lower , we can say that the category under-indexes . This gives some context to the statistics and starts letting you draw out some real insights from your survey data.
Why you need to analyze survey data
Quantitative data is extremely valuable when interpreting survey results. However, the numbers themselves are unlikely to provide a concrete answer as to why something happened or why people hold a certain opinion.
Understanding why respondents answered in the way that they did is when you can really start to address problems and make changes. This is where the real insight is born.
Sometimes, the “why” will be answered with direct questions in the survey and sometimes with multiple-choice boxes. Other times, it will be up to you as the survey analyst to determine causation, if possible. And this is where we need to be careful.
It's easy to become sucked into a trap when analyzing survey data and start to see patterns everywhere. This isn't necessarily a bad thing, as identifying a correlation between two variables is a key part of interpreting survey results. However, the danger is that we often make assumptions instead.
Assumptions about the data can be hopes or expectations, conscious or subconscious. However, realizing when we are making assumptions can help us avoid any problems further down the line and prevent us from wasting time.
Ultimately, no one wants to find out their assumptions were false after the survey analysis is complete. Similarly, you wouldn’t want a critical assumption to be false and never even realized.
Survey data analysis examples
Correlation occurs when two different variables move at the same time.
A classic example is the sale of seasonal products. During the summer, swimming pool and barbecue sales rise. When plotted on a graph, the two variables move in the same direction at the same time. However, there's no direct connection between these two variables. People buying barbecues isn't the reason the sales of swimming pools increase.
Causation, on the other hand, occurs when one factor directly causes a change in another factor.
For example, in the case of seasonal products, the weather is a key factor. As the temperature rises in the summer, so do barbecue sales. Barbecue sales here are a variable that's dependent on the weather, and there's a key link between them.
When interpreting survey results, it's easy to mistake correlation for causation. Just because two variables move at the same time, it doesn't mean that one is directly influencing the other.
This is where qualitative data comes in. If you’ve asked your respondents to fill in longer-form answers to explain why they chose a certain response, analyzing these answers can give you the insight you need to work out why.
How to report back on your survey data
When sharing your survey data analysis, remember that the story is what makes it interesting, not the numbers.
The percentages you've calculated are vital evidence for your argument, but your analysis needs a narrative to have a real impact on people's thinking.
If you can, always provide context with your statistics, either comparing them to the same survey from last year or comparing groups of people in the same year’s data. Benchmark your numbers so that your audience is immediately aware of whether what they are seeing is positive or negative.
If you are unable to provide recommended actions based on your survey data analysis, at least signpost the key areas that need attention so the relevant parties can begin to tackle the problem if necessary.
When you visualize your data, remember that while long reports can be fascinating, most people won’t read them. Whoever you are presenting to is unlikely to want to listen or read as you walk them through your survey analysis methods step-by-step, so don’t feel like you have to include every single calculation you made in your report.
Put yourself in your audience’s shoes and determine their interests and priorities. Only give them the information if it is relevant to them, they will understand it, and there's something they can do with this new information.

About the author
We're Typeform - a team on a mission to transform data collection by bringing you refreshingly different forms.
Liked that? Check these out:

How listening to your customers builds a better business
Whether you’re just getting started with VOC insights or looking for ways to fine-tune your listening skills, you’re in the right place. Read on to find wisdom from the superstars of the marketing world—where to find customer feedback, how to listen, and how to turn insights into action.
Typeform | 07.2023

The psychology behind surveys: How to design questions that get results
What happens when you apply a little psychology magic to surveys? Tammy Duggan-Herd—HubSpot Sr. Marketing Manager and Social Psychology Ph.D.—shares 14 proven principles to help you write survey questions that actually get answered.
Typeform | 01.2024

Why AI-powered marketing teams are about to do their best work yet
Generative AI has taken the world by storm—and the impact has been enormous for marketers. Typeform’s CPO, Oji Udezue, shares how marketers can tap into the power of AI for greater efficiency and how Typeform uses AI to help brands understand and engage with their audience.
Kevin Branscum | 09.2023
IMAGES
VIDEO
COMMENTS
For many researchers unfamiliar with qualitative research, determining how to conduct qualitative analyses is often quite challenging. Part of this challenge is due to the seemingly limitless approaches that a qualitative researcher might leverage, as well as simply learning to think like a qualitative researcher when analyzing data. From framework analysis (Ritchie & Spencer, 1994) to content ...
Learn the basics of six common qualitative data analysis methods, such as content analysis, narrative analysis, discourse analysis and more. See how to apply them to your research project and get extra resources to dive deeper.
Aims of Qualitative Data Analysis The analysis of qualitative data can have several aims. The first aim may be to describe a phenomenon in some or greater detail. The phenomenon can be the subjective experi-ences of a specific individual or group (e.g. the way people continue to live after a fatal diagnosis). This can focus on the case (indi-
Qualitative data analysis is a systematic process of examining non-numerical data to extract meaning, patterns, and insights. In contrast to quantitative analysis, which focuses on numbers and statistical metrics, the qualitative study focuses on the qualitative aspects of data, such as text, images, audio, and videos.
Learn about qualitative research methods, such as interviews, focus groups, ethnographic studies, and text analysis, and how to analyze qualitative data using thematic, content, discourse, and grounded theory analysis. Find out how qualitative research is used in various fields and industries.
Learn what qualitative research is, how it differs from quantitative research, and what methods and approaches are used to collect and analyze non-numerical data. Find out the advantages and disadvantages of qualitative research and see examples of common qualitative data analysis techniques.
Learn how to conduct qualitative data analysis using manual or automatic methods. Compare the steps, techniques, challenges and benefits of each approach, and see examples of qualitative data analysis methods.
This chapter provides an overview of selected qualitative data analysis strategies with a particular focus on codes and coding. Preparatory strategies for a qualitative research study and data management are first outlined. Six coding methods are then profiled using comparable interview data: process coding, in vivo coding, descriptive coding ...
Miles, Huberman, and Saldaña's Qualitative Data Analysis: A Methods Sourcebook is the authoritative text for analyzing and displaying qualitative research data. The Fourth Edition maintains the analytic rigor of previous editions while showcasing a variety of new visual display models for qualitative inquiry. Graphics are added to the now-classic matrix and network illustrations of the ...
As faculty who regularly teach introductory qualitative research methods course, one of the most substantial hurdles we found is for the students to comprehend there are various approaches to qualitative research, and different sets of data collection and data analysis methods (Gonzalez & Forister, 2020).
Learn about different methods of qualitative data analysis such as content analysis, narrative analysis, discourse analysis, framework analysis and grounded theory. Find out how to code, identify themes, patterns and relationships, and summarize the data in qualitative research.
INTRODUCTION. Qualitative research methods refer to techniques of investigation that rely on nonstatistical and nonnumerical methods of data collection, analysis, and evidence production. Qualitative research techniques provide a lens for learning about nonquantifiable phenomena such as people's experiences, languages, histories, and cultures.
How to conduct qualitative research? Given that qualitative research is characterised by flexibility, openness and responsivity to context, the steps of data collection and analysis are not as separate and consecutive as they tend to be in quantitative research [13, 14].As Fossey puts it: "sampling, data collection, analysis and interpretation are related to each other in a cyclical ...
In some cases, qualitative data can also include pictorial display, audio or video clips (e.g. audio and visual recordings of patients, radiology film, and surgery videos), or other multimedia materials. Data analysis is the part of qualitative research that most distinctively differentiates from quantitative research methods.
Thematic analysis is a method of data analysis in qualitative research that most researchers use, and it is flexible because it can be applied and utilized broadly across various epistemologies ...
Qualitative data analysis is an important part of research and building greater understanding across fields for a number of reasons. First, cases for qualitative data analysis can be selected purposefully according to whether they typify certain characteristics or contextual locations. In other words, qualitative data permits deep immersion into a topic, phenomenon, or area of interest.
A key feature of qualitative data analysis is. the application of inductive reasoning, which. generates ideas from the collected data. e. researcher uses speci c observations (data) to. develop ...
Analyze data: Analyze the data using appropriate qualitative data analysis methods, such as thematic analysis or content analysis. Interpret findings: Interpret the findings of the data analysis in the context of the research question and the relevant literature. This may involve developing new theories or frameworks, or validating existing ...
5 qualitative data analysis methods explained. Qualitative data analysis is the process of organizing, analyzing, and interpreting qualitative research data—non-numeric, conceptual information, and user feedback—to capture themes and patterns, answer research questions, and identify actions to improve your product or website.Step 1 in the research process (after planning) is qualitative ...
Methods used for data analysis in qualitative research. There are several techniques to analyze the data in qualitative research, but here are some commonly used methods, Content Analysis: It is widely accepted and the most frequently employed technique for data analysis in research methodology. It can be used to analyze the documented ...
Qualitative data is non-numerical data, such as text, video, photographs, or audio recordings. This type of data can be collected using diary accounts or in-depth interviews and analyzed using grounded theory or thematic analysis. Qualitative research is multimethod in focus, involving an interpretive, naturalistic approach to its subject matter.
Qualitative research is a type of research that aims to gather and analyse non-numerical (descriptive) data in order to gain an understanding of individuals' social reality, including understanding their attitudes, beliefs, and motivation. This type of research typically involves in-depth interviews, focus groups, or observations in order to collect data that is rich in detail and context.
Types of Qualitative Data Analysis Methodologies. Systematically analyzing textual, visual, or auditory content to identify patterns, themes, and meanings. Includes conventional, directed, and summative approaches. Identifying, analyzing, and reporting patterns or themes within qualitative data. Offers a systematic approach to coding and ...
INTRODUCTION. In an earlier paper, 1 we presented an introduction to using qualitative research methods in pharmacy practice. In this article, we review some principles of the collection, analysis, and management of qualitative data to help pharmacists interested in doing research in their practice to continue their learning in this area.
Qualitative research is a method focused on understanding human behavior and experiences through non-numerical data. Examples of qualitative research include: ... The approach chosen will take into account the purpose of the research, the role of the researcher, the data collected, the method of data analysis, and how the results will be ...
Qualitative Data Coding. Coding is the process of analyzing qualitative data (usually text) by assigning labels (codes) to chunks of data that capture their essence or meaning. It allows you to condense, organize and interpret your data. A code is a word or brief phrase that captures the essence of why you think a particular bit of data may be ...
In specific research areas, the depth of qualitative text analysis extends beyond theme and pattern identification. For instance, in system dynamics, researchers engage in rigorous coding of textual data to discern model variables, causal links, and feedback loops (Kim & Andersen, 2012; Newberry & Carhart, 2023; Tomoaia-Cotisel et al., 2022).
How to analyze survey data. The first step when analyzing survey data is to turn your individualized responses into aggregated numbers. This sounds complicated, but really, it just means you need to do some counting. For every question in your survey, you need to know the total number of people who answered with each response.
Qualitative methods encompass a variety of research and analysis techniques which have the common aim of uncovering what cannot be captured numerically through the quantification of data. For quali...